STABILITY INDICATING ANALYTICAL METHOD DEVELOPMENT
AND VALIDATION FOR ESTIMATION OF AZELNIDIPINE
Jenisha Modi, Shivangi K. Patel, Namrata Parikh, Shreya R. Shah*, Prasanna K. Pradhan and U. M. Upadhyay
Sigma Institute of Pharmacy, Bakrol, Vadodara, Gujarat, India, 390019.
ABSTRACT
A Simple Estimated critical Spectrophotometric methods was developed according to Quality by design (QbD) approach as per ICH Q8 (R2) guidelines for estimation of Azelnidipine. QbD approach was carried out by varying various parameters and these variable parameters was designed into Ishikawa diagram. The critical
parameters was determined by using principle component analysis as well as by observation. RP-HPLC method was developed for estimation of AZEL utilizing isocratic separation mode with Enable C18 (250×4.6mm.; 5 micron) column, optimum mobile phase consist of Sodium diabasic Phosphate Buffer: Acetonitrile: Methanol in the ratio of (10:50:40 v/v/v) ph adjust 4.50 by o-phosphoric acid. With effluent flow rate of 1ml/min and detecting wavelength at 257 nm in UV detector. parameters in zero order Spectrophotometric method were solvent (methanol + water), sample preparation API, Wavelength 257nm. And for first order derivative Spectrophotometric method it was sacling factor: 10 and delta lambda 4. The validation of the proposed method was found to be in compliance with the ICH guideline. For HPLC method the linearity was observed in concentration range of 2-10μg/ml for AZEL. The validation of the proposed method was found to be in compliance with the ICH guideline. The developed HPLC method was subjected to stability indicating studies for bulk formulation. Interfering peak from degraded products or solvent did not interfere with estimation of drug and the developed method was found to be specific for estimation of Azelnidipine.
KEYWORDS: Azelnidipine, Zero Order Spectroscopy, First Order Spectroscopy, RP-HPLC, Validation, Stability.
Volume 5, Issue 2, 831-847. Research Article ISSN 2277– 7105
Article Received on 30 Nov 2015,
Revised on 21 Dec 2015, Accepted on 10 Jan 2016
*Correspondence for
Author
Shreya R. Shah
Sigma Institute of
Pharmacy, Bakrol,
Vadodara, Gujarat, India,
1. INTRODUCTION
Azelnidipine is dihydropyridine calcium channel blocker. It is not available in official pharmacopeia. Dihydropyridine (DHP) calcium channel blockers are derived from the molecule dihydropyridine and often used to reduce systemic vascular resistance and arterial pressure. The class of CCBs known as dihydropyridines mainly affect arterial vascular smooth muscle and lower blood pressure by causing vasodilation. Iupac name of Azelnidipine: 03-[1-[di(phenyl)methyl]azetidin-3-yl]05-propan-2-yl 2-amino-6-methyl-4-(3-nitrophenyl)-1,4-dihydropyridine-3,5-dicarboxylate. This method was done by Uv Spectroscopic Method and by Hplc method.
Molecular formula
Figure: 1 Azelnidipine. 2. MATERIALS AND METHOD
2.1 Chemicals and reagents
Pure drug sample of Azelnidipine was kindly gifted by Zydus, Cadila Health Care Pvt. Ltd. Distilled grade water and methanol was used as solvent for drugs.
2.2 Spectrophotometric Conditions
For the selection of analytical wavelength, standard solution of AZEL was scanned in the spectrum mode from 400nm to 200nm. From the spectrum, 𝜆 max of AZEL, 257 nm (Figure)
was selected for method 1. Then it was transformed to its first derivative spectrum. It was found that AZEL showed maximum amplitude at 242.6 nm (Figure) which was selected for method 2.
2.3 Methods
By UV Spectroscopy
2.3.1 Preparation of Standard stock solution
diluent to give a solution containing 1000μg/ml Azelnidipine. Prepration of working standard stock solution of Azelnidipine (100μg/ml):- 10 ml of stock solution was withdrawn and transferred to 100 ml volumetric flask. volume is made upto the mark with diluent to get the working standard solution of 100 μg/ml.
Diluent
Methanol + Water (80:20 V/V).
2.3.2 Preparation of Calibration Curve of AZEL
Appropriate volume of aliquots 2, 4, 6, 8, 10 and 12 ml from working Azelnidipine stock solutions were transferred to different volumetric flasks of 10 ml capacity. The volume was adjusted to the mark with diluent to obtain Concentration of 2-12μg/ml. The absorbance of the solutions was measured at 257nm in zero order and at 242.6nm in 1st order derivative method.
By RP-HPLC method
2.3.3 Instrumental conditions
HPLC (shimadzu); LC-20 AT prominence solvent delivery module, manual rheodyne injector with a 20-μl fixed loop, Detector SPD-20A. Prominence UV–visible detector, Column- Enable C18 G column preceded by an ODS guard column (10μm, 10mm×5mm.). Software-Spinchrom Chromatographic Station®CFR Version 2.4.0.195 (Spinchrom Pvt. Ltd., Chennai, India).
2.3.4 Materials and Reagents
Pvt. Ltd The gifted sample were used as standard without any further purification. Distilled grade water, methanol and Acetonitrile was used as solvent for drugs. Ortho Phosphoric acid (88%) and Na2HPO4. 2H2O were of AR Grade.
2.3.5 Preparation of Mobile Phase
2.3.6 Preparation of standard solutions
stock solution of Azelnidipine
Accurately weighted 10 mg Azelnidipine was taken in 10 ml volumetric flask and then diluted with HPLC grade (methanol + water) (80:20 V/V) up to the mark (1000μg/ml). 1ml of this solution was transferred in 10 ml volumetric flask and diluted up to mark HPLC grade (methanol + water) (80:20 V/V) (100μg/ml).
2.3.7 Prepration of working standard stock solution of Azelnidipine
0.2, 0.4, 0.6, 0.8 and 1.0 ml of resultant solution was transferred in 10 ml volumetric flask and diluted up to mark with HPLC grade (methanol + water) to get concentrations 2,4,6,8 and 10μg/ml respectively.
Stability Study
2.3.8 Preparation of stock solution
Accurately weighted 10mg Azelnidipine was taken in 10 ml volumetric flask and then diluted with diluent up to the mark (1000μg/ml) and sonicated for 15min. 1ml of this solution was transferred in 10ml volumetric flask and diluted up to mark with Diluent (100μg/ml).
2.4 ANALYTICAL METHOD VALIDATION By UV Spectroscopy method
2.4.1 Linearity
The linearity of response for Azelnidipine was assessed by analysis of six independent levels of concentration in range of 2-12μg/ml in terms of slope, intercept and correlation coefficient values of calibration curve.
2.4.2 Precision
The reproducibility of all these two methods was determined by repeating the above methods at different time intervals (morning, afternoon and evening) on the same day (Intraday precision) and on three consecutive days (interday precision). The intraday and interday variation for the estimation of AZEL was carried out at three different concentration levels of 2, 6 and 12𝜇g/mL for method 1 and method 2. (Table 7.1).
2.4.3 Accuracy
known amount of working standard solution of Azelnidipine (0.33, 0.42 and 0.48 ml of 100 μg/ml) was added in 10 ml volumetric flask and made up to mark with diluent which was at
different level i.e. 80%, 100% and 120%. The solutions were analyzed by proposed method. Calculate the mean % recovery from peak areas obtained.
2.4.4 Limit of Detection (LOD) and Limit of Quantification (LOQ) A. LOD
The LOD was estimated from the set of five calibration curves used to determine methodlinearity. Calibration curve was repeated for 6 times and the SD of the intercept was calculated then LOD was calculated as follow: From the formula
LOD= (3.3*SD)/slope.
Where,
SD= the standard deviation of y-intercept of 5 calibration curves. Slope= the mean slope of the 5 calibration curves.
B. LOQ
The LOQ was estimated from the set of five calibration curves used to determine method linearity.
The LOQ may be calculated as LOQ = 10 × (σ/S).
Where,
σ = Standard deviation of the Y- intercepts of the five calibration curves.
S = Mean slope of the five calibration curves.
BY RP-HPLC METHOD Method Validation
2.4.5 Linearity and Range
2.4.6 Precision
For repeatability, six replicates of standard solution of AZEL (6μg/ml) was prepared and
Peak areas were recorded and RSD was calculated. Intraday and Interday precision were measured in term of % RSD. Three different concentrations were taken for intraday and intraday precision. The experiment was repeated three times in a day for intraday and on three different days for Interday precision. The limit for % RSD should be NMT 2%.
2.4.7 Accuracy (Recovery Study)
Accuracy was determined by performing recovery studies by spiking specific concentration of pure drug in pre analyzed sample solution of 4.1μg/ml of AZEL. To pre-analyzed sample solution, a known amount of standard stock solution were added which was at different level 80, 10 and 120%. The solutions were analyzed by proposed method. Mean % recovery was calculated.
2.4.8 Specificity
Specificity was determined by performing studies by spiking specific concentration of Excipient in pre analyzed sample solution of 4μg/ml of AZEL. To pre-analyzed sample
solution, a known amount of excipient stock solution were added which was at different level 75, 100 and 125%. The solutions were analyzed by proposed method. Mean % recovery was calculated.
2.4.9 Robustness
The robustness of the method was determined by changing flow rate of mobile phase and by changing the pH for mobile phase.
Stability Study
2.4.10 ACID HYDROLYSIS
Take 1.0 ml of aliquot from stock solution in 10 ml of volumetric flask. To this add 2.0 ml of 0.1N HCL and then solution is allowed to stand for 4 hrs and neutralized using 0.1N NaOH. Finally dilute upto mark using Diluent to get final concentration 10 μg/ml of AZEL.
2.4.11 ALKALI HYDROLYSIS
2.4.12 OXIDATIVE HYDROLYSIS
Take 1.0 ml of aliquot from stock solution in 10 ml of volumetric flask. To this add 2.0 ml of 3% Hydrogen peroxide and then solution is allowed to stand for 4 hrs. Finally dilute upto mark using diluent to get final concentration of 10 μg/ml of AZEL.
2.4.13 THERMAL HYDROLYSIS
Weigh 100mg sample and keep it in oven at 60-70◦C for 24hrs. From this weigh 10mg sample and transfer it in 10ml volumetric flask. Make up the volume upto the mark with diluents. Then take 1 ml of above solution and transfer it in to 10ml volumetric flask. Make up the volume with diluents. This solution injected into the system.
2.4.14 PHOTOLYTIC HYDROLYSIS
Weigh 100mg sample and keep it in sunlight for 4hrs. From this weigh 10mg sample and transfer it in 10ml volumetric flask. Make up the volume upto the mark with diluents. Then take 1 ml of above solution and transfer it in to 10ml volumetric flask. Make up the volume with diluents. This solution injected into the system.
2.4.15 UV DEGRADATION
Weigh 100mg sample and keep it in UV chamber at 200-400nm for 24hrs and 48hrs From this weigh 10mg sample and transfer it in 10ml volumetric flask. Make up the volume upto the mark with diluents. Then take 1 ml of above solution and transfer it in to 10ml volumetric flask. Make up the volume with diluents. This solution injected into the system.
3. RESULT AND DISCUSSION
Optimization by UV Spectroscopy method 3.1 Linearity
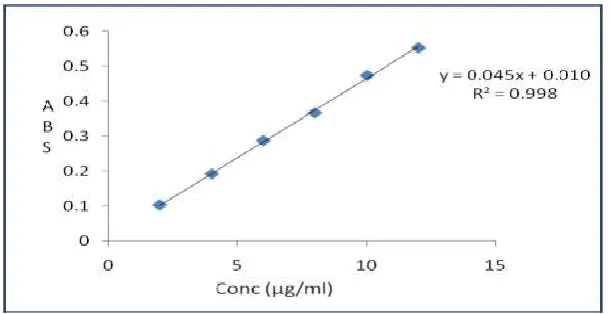
The linearity of response for Azelnidipine was assessed by analysis of six independent levels of concentration in range of 2-12μg/ml in terms of slope, intercept and correlation coefficient values of calibration curve.
Table 1: Calibration data.
Concentration(µg/ml) Absorbance ± SD (nm)
2 0.1018 ± 0.014
4 4 0.191 ± 0.009
6 6 0.286 ± 0.005
8 8 0.3654 ± 0.002
10 10 0.473 ± 0.012
Figure: 2 Calibration curve of AZEL. 3.2 Precision
The reproducibility of all these two methods was determined by repeating the abovemethods at different time intervals (morning, afternoon and evening) on the same day (Intraday precision) and on three consecutive days (interday precision). The intraday and interday variation for the estimation of AZEL was carried out at three different concentration levels of 2, 6 and 12𝜇g/mL for method 1 and method 2.
Table 2: Precision data.
Method Conc (µg/ml) Intraday(%RSD)(n=3) Interday(%RSD)(n=3) 1.
2 1.90 1.30
6 0.28 1.82
12 0.95 1.82
Mean 1.04 1.64
2.
2 1.31 1.89
6 0.31 0.91
12 0.13 1.43
Mean 0.58 1.41
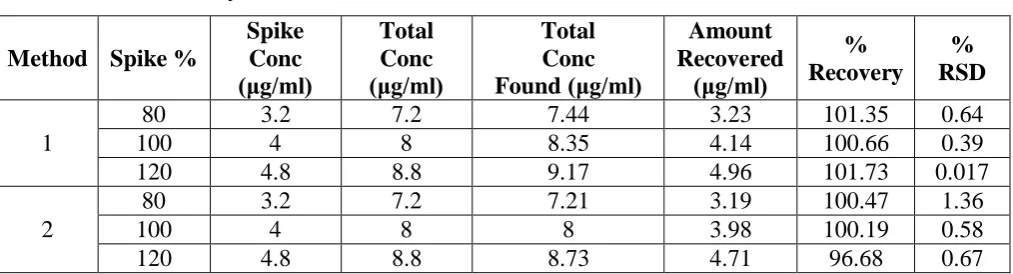
3.3 Accuracy
Accuracy was determined by performing recovery studies by spiking different concentration of pure drug in pre-analyzed sample solution of 4μg/ml. To preanalyzed sample solution, a known amount of working standard solution of Azelnidipine (0.33, 0.42 and 0.48 ml of 100 μg/ml) was added in 10 ml volumetric flask and made up to mark with diluent which was at
Table 3: Accuracy data. Method Spike %
Spike Conc (μg/ml)
Total Conc (μg/ml)
Total Conc Found (μg/ml)
Amount Recovered
(μg/ml)
% Recovery
% RSD 1
80 3.2 7.2 7.44 3.23 101.35 0.64
100 4 8 8.35 4.14 100.66 0.39
120 4.8 8.8 9.17 4.96 101.73 0.017
2
80 3.2 7.2 7.21 3.19 100.47 1.36
100 4 8 8 3.98 100.19 0.58
120 4.8 8.8 8.73 4.71 96.68 0.67
3.4 Limit of Detection (LOD) and Limit of Quantification (LOQ) A. LOD
The LOD was estimated from the set of five calibration curves used to determine method linearity. Calibration curve was repeated for 6 times and the SD of the intercept was calculated then LOD was calculated as follow: From the formula LOD= (3.3*SD)/slope.
Where,
SD= the standard deviation of y-intercept of 5 calibration curves. Slope= the mean slope of the 5 calibration curves.
B. LOQ
The LOQ was estimated from the set of five calibration curves used to determine method linearity.
The LOQ may be calculated as LOQ = 10 × (σ/S).
Where,
σ = Standard deviation of the Y- intercepts of the five calibration curves.
S = Mean slope of the five calibration curves.
Table 4: LOD and LOQ.
Parameters Method 1 Method 2 SD of Intercept 0.018 0.0030
Slope 0.045 0.0123
LOD (μg/ml) 0.75 0.82
LOQ (μg/ml) 2.15 2.48
Optimization by HPLC method 3.5 Linearity and Range
[image:10.595.126.466.209.391.2]The linearity response was determined by analyzing solutions having concentrations in the range of 2-10μg/ml Azelnidipine. Peak area of each solution was measured using developed method. Calibration curve of Peak area vs. Concentration was plotted. The correlation coefficient and regression line equations for Azelnidipine was determined.
Figure: 3 Linearity of Azelnidipine (2-10μg/ml).
Figure: 4 - 3 D Linearity of AZEL. Table 5: Linearity of AZEL.
Conc.(μg/ml) Peak Area (mv.s)
1 2 3
2 127.424 127.415 120.416
4 269.473 269.475 265.471
6 384.411 383.409 381.411
8 515.482 515.482 511.481
[image:10.595.130.466.429.609.2]3.6 Precision
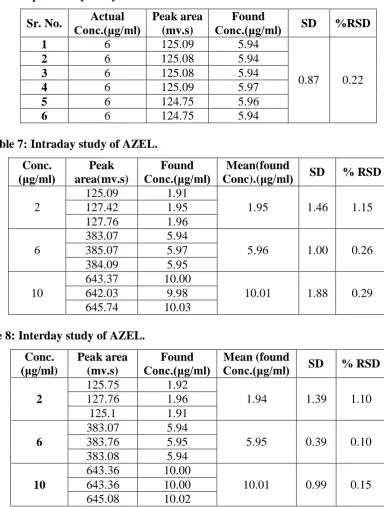
[image:11.595.99.484.222.729.2]For repeatability, six replicates of standard solution of AZEL (6μg/ml) was prepared and Peak areas were recorded and RSD was calculated. Intraday and Interday precision were measured in term of % RSD. Three different concentrations were taken for intraday and intraday precision. The experiment was repeated three times in a day for intraday and on three different days for Interday precision. The limit for % RSD should be NMT 2%.
Table 6: Repeatability study of AZEL. Sr. No. Actual
Conc.(μg/ml)
Peak area (mv.s)
Found
Conc.(μg/ml) SD %RSD
1 6 125.09 5.94
0.87 0.22
2 6 125.08 5.94
3 6 125.08 5.94
4 6 125.09 5.97
5 6 124.75 5.96
6 6 124.75 5.94
Table 7: Intraday study of AZEL. Conc.
(μg/ml) area(mv.s) Peak
Found
Conc.(μg/ml) Conc).(μg/ml) Mean(found SD % RSD 2
125.09 1.91
1.95 1.46 1.15
127.42 1.95
127.76 1.96
6
383.07 5.94
5.96 1.00 0.26
385.07 5.97
384.09 5.95
10
643.37 10.00
10.01 1.88 0.29
642.03 9.98
645.74 10.03
Table 8: Interday study of AZEL. Conc. (μg/ml) Peak area (mv.s) Found Conc.(μg/ml) Mean (found
Conc.(μg/ml) SD % RSD 2
125.75 1.92
1.94 1.39 1.10
127.76 1.96
125.1 1.91
6
383.07 5.94
5.95 0.39 0.10
383.76 5.95
383.08 5.94
10
643.36 10.00
10.01 0.99 0.15
643.36 10.00
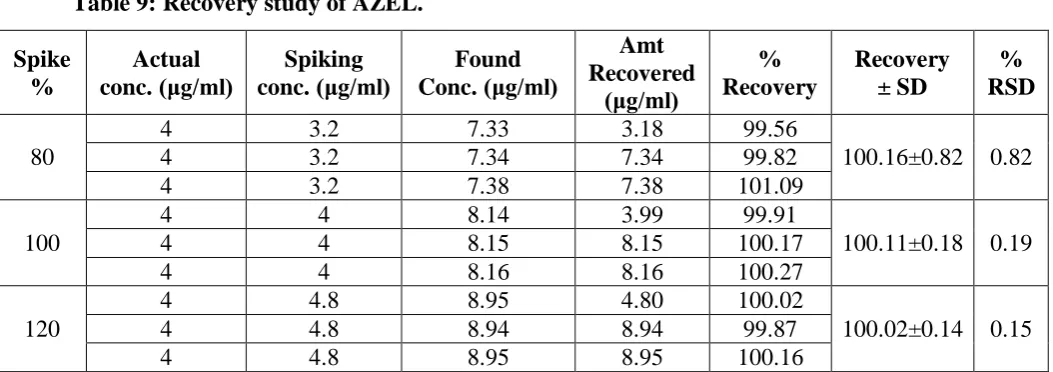
3.7 Accuracy (Recovery Study)
Accuracy was determined by performing recovery studies by spiking specific concentration of pure drug in pre analyzed sample solution of 4.1μg/ml of AZEL. To pre-analyzed sample
solution, a known amount of standard stock solution were added which was at different level 80, 10 and 120%. The solutions were analyzed by proposed method. Mean % recovery was calculated.
Pre-analyzed Conc 4.15μg/ml.
Table 9: Recovery study of AZEL. Spike % Actual conc. (μg/ml) Spiking conc. (μg/ml) Found Conc. (μg/ml) Amt Recovered (μg/ml) % Recovery Recovery ± SD % RSD 80
4 3.2 7.33 3.18 99.56
100.16±0.82 0.82
4 3.2 7.34 7.34 99.82
4 3.2 7.38 7.38 101.09
100
4 4 8.14 3.99 99.91
100.11±0.18 0.19
4 4 8.15 8.15 100.17
4 4 8.16 8.16 100.27
120
4 4.8 8.95 4.80 100.02
100.02±0.14 0.15
4 4.8 8.94 8.94 99.87
4 4.8 8.95 8.95 100.16
3.8 Specificity
Specificity was determined by performing studies by spiking specific concentration of Excipient in pre analyzed sample solution of 4μg/ml of AZEL. To pre-analyzed sample solution, a known amount of excipient stock solution were added which was at different level 75, 100 and 125%. The solutions were analyzed by proposed method. Mean % recovery was
[image:12.595.36.563.271.457.2]calculated.
Table 10: Specificity of AZEL. Spike % Actual conc. (μg/ml) Spiking conc. (μg/ml) Peak Area (mv.s) Found Conc (μg/ml) % Found Mean
(%found) SD %RSD
75
4 3 455.33 7.13 99.37
99.19 0.35 0.35
4 3 454.196 7.11 98.78
4 3 455.396 7.13 99.41
100
4 4 526.009 8.23 102.08
98.79 0.21 0.21
4 4 525.035 8.21 101.70
125
4 5 583.888 9.13 99.72
99.41 0.17 0.17
4 5 584.231 9.14 99.82
4 5 583.138 9.12 99.48
3.9 LOD & LOQ A. LOD
The LOD was estimated from the set of five calibration curves used to determine method linearity. Calibration curve was repeated for 6 times and the SD of the intercept was calculated then LOD was calculated as follow: From the formula LOD= (3.3*SD)/slope.
Where,
SD= the standard deviation of y-intercept of 5 calibration curves. Slope= the mean slope of the 5 calibration curves.
B. LOQ
The LOQ was estimated from the set of five calibration curves used to determine method
linearity.
The LOQ may be calculated as LOQ = 10 × (σ/S).
Where,
σ = Standard deviation of the Y- intercepts of the five calibration curves.
S = Mean slope of the five calibration curves.
Table 11: LOD & LOQ.
Parameters Method 1 SD of Intercept 0.109
Slope 64.123
LOD (μg/ml) 0.75
LOQ (μg/ml) 2.75
3.10 Robustness
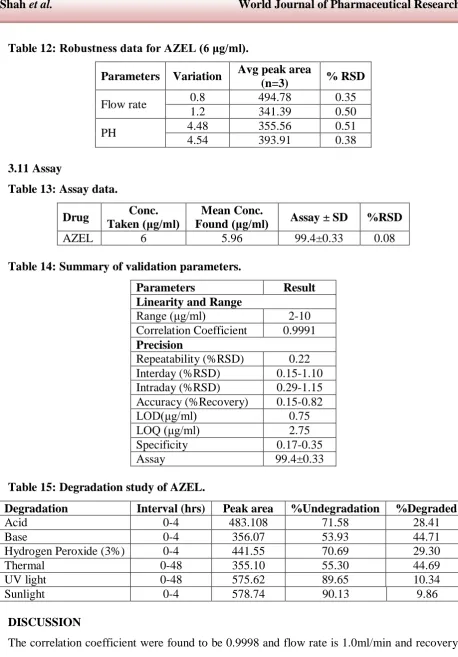
Table 12: Robustness data for AZEL (6 μg/ml).
Parameters Variation Avg peak area
(n=3) % RSD
Flow rate 0.8 494.78 0.35
1.2 341.39 0.50
PH 4.48 355.56 0.51
4.54 393.91 0.38
3.11 Assay
Table 13: Assay data.
Drug Conc.
Taken (μg/ml)
Mean Conc.
Found (μg/ml) Assay ± SD %RSD
[image:14.595.64.523.31.688.2]AZEL 6 5.96 99.4±0.33 0.08
Table 14: Summary of validation parameters.
Parameters Result
Linearity and Range
Range (μg/ml) 2-10
Correlation Coefficient 0.9991 Precision
Repeatability (%RSD) 0.22 Interday (%RSD) 0.15-1.10 Intraday (%RSD) 0.29-1.15 Accuracy (%Recovery) 0.15-0.82
LOD(μg/ml) 0.75
LOQ (μg/ml) 2.75
Specificity 0.17-0.35
Assay 99.4±0.33
Table 15: Degradation study of AZEL.
Degradation Interval (hrs) Peak area %Undegradation %Degraded
Acid 0-4 483.108 71.58 28.41
Base 0-4 356.07 53.93 44.71
Hydrogen Peroxide (3%) 0-4 441.55 70.69 29.30
Thermal 0-48 355.10 55.30 44.69
UV light 0-48 575.62 89.65 10.34
Sunlight 0-4 578.74 90.13 9.86
DISCUSSION
CONCLUSION
By comparing two method, it can be concluded that spectroscopic method was found to be simple and rapid First order spectroscopic method was found to be more accurate as compared to zero order spectroscopic method. The value of % RSD for intra-day and inter-day precision was found to be less than 2. The value of % Recovery greater than 98% for this method shows that the method is accurate and free from the in interference of excipients used in formulation. % Recovery of formulation were found to be 99-102%. It was concluded that developed method is simple, accurate, precise and reliable rather than already developed RP-HPLC method. The developed RP- RP-HPLC method was subjected to stability indicating studies for Azelnidipine. It was found that the interfering peak from degraded products or solvent did not interfere with estimation of drug and the developed method was found to be
specific for estimation of Azelnidipine.
REFERENCE
1. Meyer VR. Practical High Performance Liquid Chromatography; 2nd ed; John wiley and sons, London, 1993; 26-258.
2. Snyder LR., Kirkland JL. and Glajch JL. Practical HPLC Method Development; New York, Wiley, 1997.
3. Sethi PD. High performance liquid chromatography: Quantitative analysis of
pharmaceutical
4. Formulations; New Delhi: CBS publishers, 2000; 122.
5. Ahuja S. and Rasmussen H. HPLC Method Development for Pharmaceuticals; London: 6. Elsevier, Academic Press, 2007.
7. Dong MW., Modern HPLC for practicing Scientist; A John Wiley and Sons, Inc.
Publication
8. Hoboken, New Jersey, 2006; 1-7.
9. “ICH Guidelines, validation of analytical procedure, Methodology Q2B”; ICH Harmonized Tripartite Guidelines, 1996.
10. ICH guidelines, Q1A (R2): Stability Testing of New Drug Substances and Products
(revision 2), International Conference on Harmonization.
11. Blessy M., Patel RD., Prajapati PN. and Agrawal YK., “Review: Development of forced degradation studies of drugs.” International Journal of Advances in pharmaceutics, 2013;
4(3): 159-165.
13. www.wikipedia.org/wiki/Azelnidipine (Assessed on 12th Oct). 14. www,drugfuture.com/chemdata/azelnidipine(Assessed on 12th Oct)
15. Patel JK and Patel NK, “Validated stability-indicating RP-HPLC method for the
Simultaneous determination of Azelnidipine and Olmesartan in their combined dosage form.” Scientia Pharmaceutica, 2014; 82: 541-554.
16. Ganduri R, Vurimindi H, Peddapapireddigari J and Ramprakash, “Stability indicating liquid chromatographic method for the simultaneous determination of Olmesartanmedoxomil and Azelnidipine in combined tablet dosage form” International
Journal of Pharma Sciences and Reserch, 2014; 5: 275-282.
17. Patel N and Patel JN, “Simultaneous determination of Azelnidipine and Olmesartanmedoxomil by First derivative spectrophotometric method.” Scholar Research
Library, Der Pharmacia Lettre, 2012; 4(4): 1080-1084.
18. Veyama E, Takahashi F, Ohashi J, Konse T, Kishi N and Kano K, “Mechanistic study on
degradation of Azelnidipine solution under radical initiator-based oxidative condition .” Journal of Pharmaceutical and Biomedical Analysis, ELESVIER, 2012; 16: 277-283. 19. Rele RV and Terse RH, “A validated non-aqueous potentiometric titration method for the
quantitative determination of Azelnidipine from pharmaceutical preparation.” J. Chem. Pharm. Res., 2011; 3(3): 1-5.
20. Raskapur KD, Patel MM and Captain AD, “UV-spectrophotometric method development
and validation for determination of Azelnidipine in pharmaceutical dosage form.” International Journal of pharmacy and Pharmaceutical sciences, 2011; 4(1): 238-240. 21. Rele RV and Patil SP, “Uitra-Violet spectrophotometric method for estimation of
Azelnidipine from bulk drug and pharmaceutical formulation.” Asian Journal of Research in Chemistry, 2010; 3(4): 1077-1079.
22. Ding Li, Li Li and Pengcheng Ma, “Determination of Azelnidipine in human plasma by
liquid chromatography-electrospray ionization-mass spectrometry.” Journal of Pharmaceutical and Biomedical Analysis, 2007; 3(2): 575-579.
23. Urasaki Y and Kawabta K, “Simultaneous determination of Azelnidipine and two
metabolites in human plasma using liquid chromatography-tandem mass spectrometry.” Journal of Chromatography; B, 2006; 844(1): 45-52.
24. Ying-feng P, Jian-bing Z, Jie D, Tai-min W, “Dtermination of Azelnidipine Tablets by HPLC.” Qilu Pharmacetutical Affairs, 2008.
26. http://pharmacologycorner.com/calcium-channel-blockers-classificationmechanism-
of-action-indications.
27. Liping Y, Yuanhua Z and Meijun F. Stable Azelnidipine composition. World Intellectual
Property.
28. http://pharmacologycorner.com/calcium-channel-blockers-classificationmechanism- of-action-indications.
29. Liping Y, Yuanhua Z and Meijun F. Stable Azelnidipine composition. World Intellectual
Property Organization CN102688237, 2012.
30. Scott J and Liversidge G G. Nanoparticulates of Azelnidipine. World Intellectual Property Organization US20100221327, 2010.
31. Antihypertensive medicines. World Intellectual Property Organization CN102125553,
2011.
32. Masatsugu H, Makoto M, Toshio S and Masaru I. Medicine for Preparation of the
Treatment for Arteriosclerosis and Hypertension. European Patent CA2514921 (A1) and CA2514921 (C), 2013.
33. Wang J, You G and Zhang Z. Slow-release Preparation of Azelnidipine and Preparation
Method Thereof. European Patent CN101756977 (A), 2010.
34. Pavia LA., Lampman GM., Kriz GS., Vyvan JR. Spectroscopy; 6th Edn; Nelson education
Ltd., Canada, 2011.
35. Jadhav M and Tambe S, “Implementation of QBD Approach to the Analytical Method
Development and Validation for the Estimation of Propafenone Hydrochloride in Tablet Dosage form.” Hindawi Publishing Corporation, Chromatography Reserch International,
2013; 2013: 1-9.
36. www. dptlabs. Com (Accessed on 28th March).
37. ICH Topic Q8 (R2), “ICH harmonized tripartite guidelines,” in Proceeding of the