Master Thesis
INNOVATIVE SUNLIGHT DRIVEN
THERMAL STORAGE SLURRY FOR
DIRECT ABSORPTION SOLAR
COLLECTORS (DASC).
Rakshith Mukkatira Chengappa
S1893920
For the CTW Faculty at the University of Twente
Thermal Engineering
2019
EXAMINATION COMMITTEE
Prof. Ir. Theo Van der Meer (chairman)
Dr. Mina Shahi (Supervisor)
Dr. Mohammad Mehrali (Supervisor)
i
Summary
The solar energy is available freely in nature. Traditionally solar thermal receivers are used to utilize this carbon neutral energy. With recent advances in technology to improve the efficiency, and overcome the heating losses in the existing collectors, a new technology called Direct Absorption Solar Collector (DASC) is proposed. In this technology, the solar energy is directly absorbed and transferred by the working fluid. To overcome the time mismatch between availability and demand of solar irradiation, Phase Change Materials (PCMs) are added to the heat carrier. In this way, the latent heat can be exploited in combination with the sensible heat of the carrier itself. This innovative thermal storage slurry for DASC is in research phase but has numerous implications in building heating/cooling systems, thermal storage, and thermal regulating fabric.
In this thesis, the objectives are 1- to design and install a laboratory scale stationary state DASC with simulated radiation source; 2-to examine the photo-thermal as well as thermal storage performance of the slurries; 3- to study the effect of different parameters like collector height, irradiation time on the collector efficiency when using PCM slurries.
ii
Preface
This report is written for attaining the master’s degree in Mechanical Engineering at the University of Twente. Thermal storage slurry for direct absorption solar collector is the research topic.
Firstly, I would like to thank Dr. Mina Shahi, who allowed me to work on this project. I very much appreciate her positive attitude, timely advice, encouragement, and feedback to improve during our meeting.
I express my warmest gratitude to my daily supervisor, Dr. Mohammad Mehrali, to whom I am so much indebted. His constant support, discussion, and guidance are appreciated.
This thesis consists of a design process and experimental work in the Thermal Engineering Laboratory. The experiments would not be possible to perform without the help of Henk-Jan Moed and Robert, special thanks to them. I would also like to extend my acknowledgment to the people of the design lab for helping me with the 3D printing.
I want to express my gratitude for the support and guidance given by Dr. Sara Tahan Latibari during the initial phase of the project.
I thankfully acknowledge Prof. Theo van der Meer for his comments, and suggestions which helped me improve the readability of the thesis.
I would also like to thank the engineering technology faculty of the University of Twente for their kindness and administrative support.
iii
Table of Contents
Summary ... i
Preface ... ii
List of Figures ... v
List of Tables ... vi
Nomenclature ... vii
Chapter 1 ... 2
Introduction ... 2
1.1 Background ... 2
1.2 Non-concentrating solar thermal collectors ... 4
1.3 Nanofluids ... 5
1.4 Phase change material (PCM) slurries ... 6
1.5 Research goals ... 7
1.6 Outline of the thesis ... 7
Chapter 2 ... 8
Methodology ... 8
2.1 Working concept/ theory ... 8
2.2 Experimental setup ... 12
2.2.1 Solar Simulator ... 12
2.2.2 Quartz window ... 14
2.2.3 Collector ... 14
2.2.4 Thermometers ... 16
2.2.5 Data Acquisition system (DAQ) ... 16
2.3 Instrument calibration ... 18
2.3.1 Solar simulator setup fine-tuning ... 18
2.3.2 Thermometer calibration ... 19
2.4 Working fluids ... 20
2.4.1 Preparation and characterization ... 20
2.5 Experimental procedure ... 21
2.5.1 Instrument phase ... 21
2.5.2 Sample phase ... 22
Chapter 3 ... 24
Results and Discussion ... 24
iv
3.2 Efficiency ... 33
3.3 Thermal storage ... 38
Chapter 4 ... 41
Conclusions and Recommendations ... 41
4.1 Conclusions ... 41
4.2 Recommendations ... 42
References ... 43
Appendix A1 ... 47
Solar Simulator ... 47
Appendix A2 ... 51
Other Components... 51
Appendix A3 ... 55
v
List of Figures
Figure 1.1: Solar energy availability[18]. ... 3
Figure 1.2: Solar thermal collectors general classification [21]. ... 4
Figure 2.1: Concept of photothermal slurries. ... 8
Figure 2.2: The working concept of photothermal slurries in DASC. ... 9
Figure 2.3: Schematic of Direct Absorption Solar Collector experimental setup. ... 12
Figure 2.4: a) Dimensions in mm and other details of the collector. b) 3D printed collector. ... 15
Figure 2.5: The collector design process. ... 16
Figure 2.6: Data acquisition system. ... 17
Figure 2.7: Installed solar simulator. ... 17
Figure 2.8: Intensity measurement points for the non-uniformity profile. ... 18
Figure 2.9: a) Intensity (optical center) vs height for different power. b) Non-uniformity as a function of height and power. ... 18
Figure 2.10: Temperature voltage calibration curve. ... 19
Figure 2.11: Samples used in the photothermal experiment. ... 20
Figure 2.12: Instrument phase schematic. ... 22
Figure 2:13: Sample phase schematic. ... 23
Figure 3.1: Average temperature measured for base fluid (water) at 1 sun irradiation. 24 Figure 3.2: Average temperature as a function of time at 1 Sun irradiation for carbon black 45PPM. ... 25
Figure 3.3: Average temperature as a function of time with 1 Sun irradiation for 𝑃𝐴/𝑆𝑖𝑂2 10wt%-45PPM. ... 26
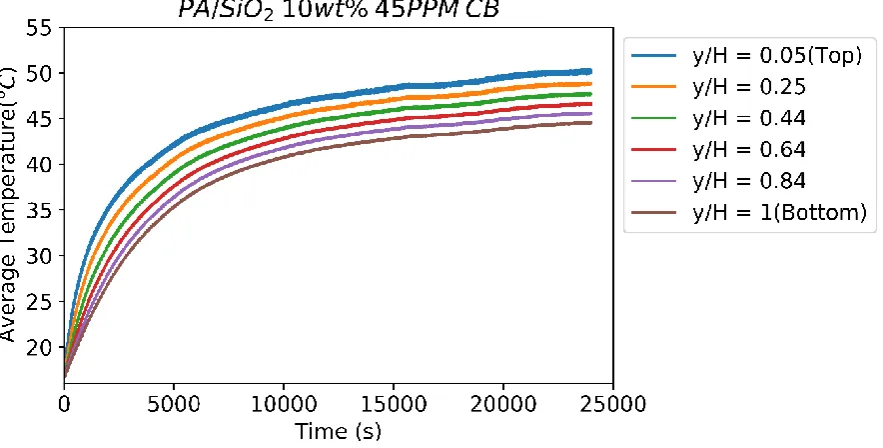
Figure 3.4: Average temperature as a function of time with 1 Sun irradiation of 𝑃𝐴/𝑆𝑖𝑂2 10wt% 45PPM till 25000s. ... 27
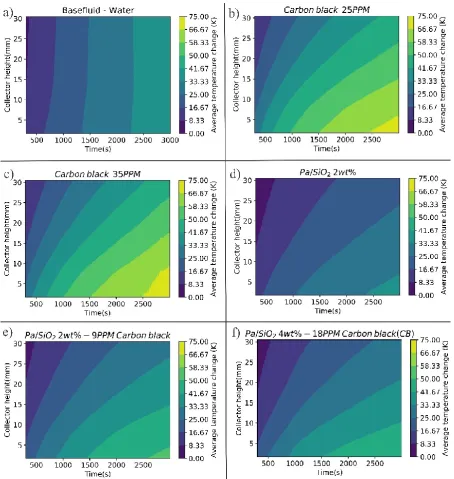
Figure 3.5: Temperature profiles at different heights and time up to 3000s; for a)base fluid - water, b)CB 25PPM, c)CB 35PPM, d) 𝑃𝑎/𝑆𝑖𝑂2 2wt%, e) 𝑃𝐴/𝑆𝑖𝑂2 2wt%-9PPM CB, f)𝑃𝐴/𝑆𝑖𝑂2 -4wt% 18PPM CB. ... 28
Figure 3.6: Temperature as a function of time, for different samples at y/H=0.05. ... 29
Figure 3.7: Average temperature as a function of time, for different samples at y/H=1. 30 Figure 3.8: Temperature variation with depth at the irradiation time of a)600s, b)3000s, c) 3600s, d)7200s, e) 9000s. ... 32
Figure 3.9: Collector efficiencies as a function of collector height and irradiation time for a) base fluid, b) CB 25PPM, c) CB 35PPM, d) 𝑃𝑎/𝑆𝑖𝑂22wt%, e) 𝑃𝑎/𝑆𝑖𝑂22wt%- 9PPM CB, f) 𝑃𝑎/𝑆𝑖𝑂24wt%-18PPM CB. ... 34
Figure 3.10: Collector efficiency as a function of irradiation time for different samples at height a) y/H = 0.05 and b) y/H = 1. ... 35
Figure 3.11: Collector efficiency as a function of height for water, Pa/SiO_2 and Pa/SiO_2-CB slurries with irradiation time a) 600s, b) 3000s, and c) 3600s. ... 37
Figure 3.12: Thermal storage capacity of base fluid and the slurries containing different PCM for heights a) y/H=0.05, b)y/H = 0.44, c) y/H = 1. ... 39
Figure 3.13: Efficiencies during phase change at different heights (represented in the bottom x-axis) and the corresponding phase change time (represented in the top x-axis), for a) pure 𝑃𝐴/𝑆𝑖𝑂2, b) 𝑃𝐴/𝑆𝑖𝑂22wt%-9PPMCB slurry, and c) 𝑃𝐴/𝑆𝑖𝑂24wt%-18PPMCB slurry; in comparison with water. ... 40
Figure A1.1 :Installed solar simulator without beam concentrator. ... 47
vi
Figure A1.3:Spectral distribution of AM1.5G simulators normalized to ASTM E892
standard spectrum [44]. ... 48
Figure A1.4: Spectral irradiance of 450W xenon bulbs [43]. ... 48
Figure A1.5: Installed 450W xenon ozone free lamp with heat sink... 48
Figure A1.6: Spectral match of Sol3A solar simulator [42]. ... 49
Figure A1.7: Non-uniformity of sol3A simulator[42]. ... 49
Figure A2.1: Transmission of light through uncoated UV fused silica window. ... 51
Figure A2.2: Quartz window. ... 51
Figure A2.3: Isometric view of the collector. ... 52
Figure A2.4: 3D printed collector. ... 52
Figure A2.5: Collector holder design. ... 52
Figure A2.6: 3D printed collector holder with collector and insulation. ... 52
Figure A2.7: DAQ system with transmitters. ... 53
Figure A2. 8: Solar simulator intensity measurement set up. ... 53
Figure A2.9: RTD calibration set up. ... 54
Figure A2. 10: RTD calibration at 0℃. ... 54
Figure A2.11: Measured voltage standard deviation of 3 trials for all the RTD used in the photothermal experiment. Maximum standard deviation is within 3.5%. ... 54
Figure A2.12:Temperature as a function of voltage for all the 8 RTD. ... 54
Figure A3.1: SEM image of palmitic acid. ... 55
Figure A3.2: DSC of palmitic acid. ... 55
Figure A3.3: Transmittance spectra of water, palmitic acid and photothermal slurry. .. 55
List of Tables
Table 2.1: Physical and thermal properties of the working fluid. ... 21Table 3.1: Average temperature summary after 9000s. ... 26
Table 3.2: Summary of temperature variation compared to water at top and bottom of the collector for different time. ... 30
Table 3.3: Optimum collector height for 𝑃𝐴/𝑆𝑖𝑂2-CB slurries based on temperature increment compared to water ... 31
Table 3.4: Efficiency compared to water at top and bottom of the collector for different time. ... 35
Table 3.5: Efficiency comparison for all the fluids up to 1 hour at different height. ... 37
Table A1.1: Performance and technical specifications of the solar simulator. ... 47
Table A1.2: Percentage change in non-uniformity with partial sun attenuator installed on sol3A solar simulator [42]. ... 50
Table A2.1: Specifications of quartz window. ... 51
Table A2.2: Specifications of Collector. ... 52
vii
Nomenclature
Abbreviations
DASC Direct absorption solar collector HTF Heat transfer fluid
LFTF Latent functional thermal fluid PCM Phase change material
SWCNH Single wall carbon nanohorns
Subscripts
𝑏𝑓 Base fluid
𝐶𝑜𝑙𝑙 Collector
𝑛𝑓 Nanofluid
𝑛𝑝 Nanoparticle
𝑃𝐶𝑀 Phase change material
𝑤𝑓 Working fluid
𝐴𝐶𝑜𝑙𝑙 Surface area of the receiver [𝑚2]
𝐶 Solar concentration factor
(𝐶𝑝)𝑏𝑓 Specific heat of the base fluid [𝐽 𝑘𝑔 −1𝐾−1]
(𝐶𝑝)𝑛𝑓 Specific heat of the nano fluid [𝐽 𝑘𝑔 −1𝐾−1]
(𝐶𝑝)𝑛𝑝 Specific heat of the nanoparticle [𝐽 𝑘𝑔 −1𝐾−1]
(𝐶𝑝)𝑤𝑓 Specific heat of the working fluid [𝐽 𝑘𝑔 −1𝐾−1]
(𝐶𝑝)𝑃𝐶𝑀 Specific heat of the phase change material [𝐽 𝑘𝑔 −1𝐾−1]
(𝐶𝑝)𝑠ℎ𝑒𝑙𝑙 Specific heat of the shell [𝐽 𝑘𝑔 −1𝐾−1]
(𝐶𝑝)𝑠𝑙𝑢𝑟𝑟𝑖𝑒𝑠 Specific heat of the photothermal slurries [𝐽 𝑘𝑔 −1𝐾−1]
𝐺 Irradiance of the solar simulator [𝑊𝑚−2]
∆𝐻𝑚 Latent heat of fusion[𝐽 𝑘𝑔−1]
𝑚𝑃𝐶𝑀(𝑦) Mass of the PCM [𝑘𝑔]
𝑚𝑤𝑓 Mass of the working fluid [𝑘𝑔]
𝑚𝑤𝑓(𝑦) Mass of the working fluid at a given height [𝑘𝑔]
𝑄𝐼 Total incident energy on the collector [𝐽]
(𝑄𝑎𝑏𝑠𝑜𝑟𝑏𝑒𝑑)𝑤𝑓 Heat absorbed by the working fluid [𝐽]
(𝑄𝑎𝑏𝑠𝑜𝑟𝑏𝑒𝑑)𝑤𝑓(𝑦) Heat absorbed by the working fluid as a function of collector
height [𝐽] 𝑄𝑙𝑎𝑡𝑒𝑛𝑡(𝑦) Latent heat [𝐽]
𝑡 Total amount of time exposed to solar radiation [𝑠] 𝑇𝑏𝑢𝑙𝑘 Average bulk temperature of the working fluid [𝐾]
𝑇𝑖𝑛 Average initial temperature of the working fluid [𝐾]
𝑇(𝑏𝑢𝑙𝑘)(𝑦) Average bulk temperature as a function of height [𝐾]
𝑉𝑤𝑓(𝑦) Volume of the working fluid as a function of collector height [𝑚3]
𝑦 Collector height as a function of thermometer location in the
collector [𝑚]
𝜌𝑏𝑓 Density of base fluid [𝑘𝑔 𝑚−3 ]
𝜌𝑛𝑓 Density of nano fluid [𝑘𝑔 𝑚−3 ]
𝜌𝑛𝑝 Density of the nanoparticle [𝑘𝑔 𝑚−3 ]
𝜌𝑃𝐶𝑀 Density of the phase change material [𝑘𝑔 𝑚−3 ]
𝜌𝑠ℎ𝑒𝑙𝑙 Density of the shell around PCM [𝑘𝑔 𝑚−3 ]
𝜌𝑠𝑙𝑢𝑟𝑟𝑖𝑒𝑠 Density of the photothermal slurries [𝑘𝑔 𝑚−3 ]
𝜌𝑤𝑓 Density of the working fluid [𝑘𝑔 𝑚−3 ]
viii 𝜙𝑃𝐶𝑀 Volume fraction of the phase change material
𝜙𝑠ℎ𝑒𝑙𝑙 Volume fraction of the shell material for the PCM
2
Chapter 1
Introduction
1.1
Background
Energy is the most fundamental and essential part of everyday life. It plays a prominent role in the development of civilization and is a major issue in politics and diplomacy around the world [1]. With the unprecedented increase in the demand for energy, the gap between the demand and supply is further increasing [2]. According to a statistical review of world energy, the global primary energy consumption comprising of commercially traded fuels, including renewables used to generate electricity, increased from 1.2% in 2016 to 2.2% in the year 2017 [3]. It is expected that the total primary energy demand continues to rise to 26% by the year 2040, based on the current increasing trend and implemented energy policies [4]. Currently, to meet the demand, non-renewable sources of energy such as fossil fuels, oil, natural gases are used which are not sustainable and the cause for global warming [5].
Over the last two centuries, there has been a huge investment and development in the energy infrastructure for coal, oil power plants, so that there is abundant energy to meet the modern energy demands of the fast-growing human population. As a consequence, the amount of naturally generated thermal energy has increased on the earth surface damaging the environment and affecting the climate drastically [5].
With the advent of fossil fuels and rapid growth of new energy infrastructure based on the abundant use of fossils, has been the cause for the decrease in the research and development of solar energy utilization. In an attempt to reduce the dependence on fossil fuels, there are tremendous research carried out in the past few decades, to utilize renewable energy and develop sustainable energy conservation techniques [5][6]. This is one of the most important challenges facing society today [7]. On the positive side, the share of renewable in global power generation increased from 7.4% to 8.4% in 2017, this is 17% higher than the 10-year average and the largest increment on record [3].
Among the alternative sources of energies available to replace fossil fuels, solar energy stands out because of its long history with humankind, inexhaustible, carbon-neutral, least environmental impact, readily available, minimum or no requirement of transportationand free availability for every human being all over the world. Also, solar energy is directly or indirectly origin of many other renewable sources such as wind, biomass, hydro [8][9][10][11][12].
3 Figure 1.1: Solar energy availability[18].
Focusing on the primary problem, there are different energy conversion principles available to convert solar energy to other useful forms. The most common solar energy conversion methods include thermal, electric and chemical [10]. The common applications of these conversion methods respectively are concentrated solar power, solar photovoltaic cells and photochemical synthesis [5][17]. To flourish the solar energy harvesting technologies, for heating and cooling applications of industrial, commercial, residential, and service sector, the significant technological improvement must be achieved and importance must be given to lowering the cost and increasing the efficiency [2][18].
In the conventional solar thermal energy systems, energy from the sun rays is collected by the solar thermal collectors like plates or tubes coated with a layer of selectively absorbing material. The absorbed energy is transferred to the heat transfer fluids (HTFs) driven by a temperature difference [17], which is then either converted to electrical energy or directly utilized as heat energy. Therefore, the efficiency of such a system is largely dependent on the collector efficiency.
4 Concentrating type, this include parabolic trough, heliostat, and parabolic dish; and non-concentrating type, like flat plate collectors, evacuated tube collectors and direct absorption solar collector (DASC) [2].
Figure 1.2: Solar thermal collectors general classification [21].
This thesis will be focusing on the non-concentrating types of solar thermal collector, mainly DASC. In the following section, the advantages and limitation of this system will be explained.
1.2 Non-concentrating solar thermal collectors
The commonly used non-concentrating solar thermal collectors are shown in figure 1.2. The general outline on the working principle, merits and demerits are discussed below.
1) Flat plate solar collector: In this type of solar thermal devices, a black surface is used as the solar absorber. The absorbed heat is transferred by conduction and convection to the heat transfer fluid (HTFs) running in tubes embedded within or fused onto the surface. Since the heat has to be absorbed by one medium and then transferred to another medium (i.e., from the black absorber to the heat transfer fluid), there are high heat losses between the mediums and also with the surrounding. Therefore, theoverall efficiency of the solar to thermal energy conversion is limited[11][17][21]. To overcome the limitation of poor thermal efficiency, corrosion and heating losses, a different design of collector called direct volumetric receivers or DASC is proposed [11][22], as explained below.
5 absorbers decreases the possibility of corrosion [21]. The important parameters that limit the direct volumetric receivers efficiency and overall system performance are optical absorption, thermo-physical properties and photo-thermal conversion performance of heat transfer fluids, hence it is crucial to develop a novel HTFs [9][11].
Heat transfer fluids are used as the medium for energy conservation and heat transfer. The commonly used HTFs are water, ethylene glycol, thermal oil, and ionic liquids. The limitations of these traditional HTFs are its low thermal conductivity; low absorption properties in the visible spectrum, which contains 44% of the solar radiation energy [11][7]; and conversion losses, which results in the reduction of solar collector efficiency [1].
To overcome the drawback of low absorptivity, micro-sized particles were added to HTFs. For low flux collectors, India ink was seeded into the base fluid, a suspension of micron-sized carbonaceous particles. For high flux collectors, micron-sized are suspended in falling films or seeded in a high-velocity gas stream [7][23]. But this didn’t solve the problems like particles settling out of solution, clogging of pumps and valves, fouling of transparent tubing and absorption spectrum dominated by the bulk material properties. With recent advancement in thermal engineering, these limitations have been overcome with the dispersion of nanoparticles into the traditional HTFs, known as nanofluids [24]. This is further discussed in the following sections.
1.3 Nanofluids
Nanofluid is an advanced kind of heat transfer fluids that contains nanoparticles of a higher degree of thermal conductivity dispersed in a continuous liquid phase. This helps to increase the heat transfer coefficient of the liquid phase/ base fluids/ traditional HTFs for a rapidly increasing number of solar energy harvesting applications [5]. The recent development in nanotechnology has caught researchers interest in radiative properties of nanoparticles in liquid suspensions. This is due to the tunability of the absorption spectrum and improvement in the optical properties of the system [7]. The other benefits of using nanofluids are that the base fluid simultaneously exhibits the superior thermal conductivity of the solid nanoparticles and the excellent fluidity characteristics of the traditional HTFs [25]. Nanofluids are prepared by dispersing uniform nanosized materials into the conventional heat transfer fluids (HTFs). The dispersed nanosized materials can be composed of metal, metal oxide and carbon. Carbon nanomaterials have a positive outlook for use in DASC, due to their black color and high thermal conductivity [9]. This improved thermal and heat transfer characteristics of nanofluids find application in the heating of buildings and reduction of pollution [26], solar energy systems [22], thermal storage, vehicle thermal management, space & military systems, medical applications and nuclear reactors [27].
6 hand, the factors hindering the further development and applications of nanofluids are long term stability, increased pumping power, thermal performance in turbulent flow, lower specific heat of nanofluids and higher production cost [27].
There are numerous experimental research in the past decade to support the idea of using nanofluids in DASCs; summary of them are outlined. In the primary research, Sani et al [28] investigated single-wall carbon nanohorns (SWCNHs) in an aqueous medium for different nanoparticle concentration, the results showed SWCNHs improved the thermal conductivity by 10% and photonic properties of the fluid at very low nanoparticle concentration. In their continued research [29], SWCNHs and carbon black were dispersed in ethylene glycol and same properties were studied; SWCNHs-glycol nanofluid showed better optical absorption properties and more stability in a stationary condition, increasing its reliability as direct absorbers in solar devices. Otanicar et al [7], reported their experimental findings of carbon nanotubes, graphite and silver nanoparticles, of different sizes, dispersed in de-ionized water; 30nm graphite and 20nm silver nanoparticle showed a maximum efficiency improvement of 3% and 5% respectively, with the volume fraction of nanoparticles up to 0.5%. The other problem of low specific heat of the working fluids used in DASC can be improved by adding phase change materials (PCMs), this is further discussed as follows.
1.4 Phase change material (PCM) slurries
Phase change materials are special kind of material, in addition to sensible heat, it also possesses latent heat in the process of melting and solidifying [30]. These materials provide high thermal storage density without a drastic rise in temperature [31][32]. Using this concept, PCMs can store solar thermal energy and corrects the mismatch between supply and demand of energy[11], thereby tackling the problem of solar energy intermittence.
There are a different classification of the PCMs, solid-liquid phase transition PCMs account for the substantial part. Among the solid-liquid PCMs, organic PCMs are considered favorable due to good chemical stability, no phase segregation during the repeated phase change process, nearly no supercooling, low vapor pressure and non-corrosiveness [33]. On the downside problems like leakage, non-effective use of solar radiation and high changes in volume on phase change restricts their direct application [6].
To overcome the above-mentioned problem of leakage, the microencapsulation technique is used. In this technique, a robust shell around the PCMs is developed. This helps to increase the heat transfer area, control volume changes during the phase transition and reduce PCMs reactivity towards the outside environment. The shell can be made from organic or inorganic materials. Polymers like polymelamine-formaldehyde (PMF) resin, polyurea-formaldehyde (PUF) resin, polyurea (PU), polystyrene (PS) and polymethyl methacrylate (PMMA) are commonly used as the shell material [11]. That is due to the outstanding sealing tightness, low price, thermal stability, appropriate plasticity and chemical resistance [6]. The conventional heat transfer fluids (HTFs) can be incorporated with microencapsulated PCMs to prepare latent functional thermal fluid (LFTFs). The LFTFs enhances the heat transfer by increasing the apparent specific heat of the HTFs.
7 PCMs possess the ability to harvest sunlight by the introduction of the nanomaterials with effective photon capturing ability such as dyes, graphite foam, expanded graphite, graphene oxide, carbon nanotube, graphene aerogels, graphene nanosheet and so on [6]. This modified latent functional thermal slurries with nanoparticles exhibit enhanced thermal conductivity and high specific heat. The followings are the research results supporting the idea of photothermal PCMs: Chen[34] studied the thermal properties of graphene oxide modified poly(melamine-formaldehyde) microcapsules containing n-dodecanol as the phase change material; the results were favoring the graphene oxide modified micro-PCM slurry.
Wang et al. [35] prepared a double-walled shell: polystyrene as interior shell and graphene oxide as the exterior shell, with n-hexadecane as the core PCM, the results showed outstanding thermal stability and protected the core PCM from leakage and evaporation, because of good barrier properties of graphene oxide.
Fang et al. [9] studied paraffin as the core and the MF resin as the shell, with graphite nanoparticle modifying the micro-PCM, dispersed into an ionic liquid. At a given concentration, micro-PCM modified with graphite nanoparticle slurries exhibited high photo-thermal performance and photo-thermal conductivity compared with micro-PCM slurries, showing a great potential to be used as medium-temperature heat transfer fluids.
Based on the above research, one can predict the micro-PCM modified with carbon nanoparticles slurries, exhibit enhanced thermal conductivity and high specific heat, making them very promising working fluids for DASC’s.
1.5 Research goals
Despite numerous research on thermal properties of microencapsulated phase change materials modified with nanoparticles, there is limited research on the photo-thermal performance of these slurries in DASC systems. To have a better understanding of the advantages, disadvantages and overall performance of PCM slurries with modified nanoparticles in DASC systems, the following aspects of this system are researched:
1. Design and installation of the simulated lab-scale stationary state condition in DASCs. 2. Investigation of the photo-thermal performance of slurries including both sensible and
latent heat storage.
3. Studying the effect of different parameters including collector height, irradiation time, and the existence of thermal storage on the collector efficiency, leading to the optimized collector.
1.6 Outline of the thesis
8
Chapter 2
Methodology
This chapter presents the working conception of the photo-thermal slurry in DASC. The design procedure and installation of the stationary state DASC experimental setup are explained, in the following section. Then the solar simulator and temperature measurement devices calibration are discussed. Next, the working fluid properties are studied. And finally, the procedures implemented to perform the photo-thermal experiments are described.
2.1 Working concept/ theory
The idea behind the direct absorption solar collector is to directly absorb the incident solar radiation volumetrically by the working fluid, and convert this incident radiation to heat energy. For effective absorption and improved efficiency of the DASC system, the design of the collector and the constituents of the heat transfer medium have a significant role. In this thesis, the following activities are done:
• The collector is used to hold the sample and designed to minimize the heat losses by convection and radiation to the surrounding.
• Carbon nanoparticles are added to increase the thermo-physical properties of the heat transfer fluid.
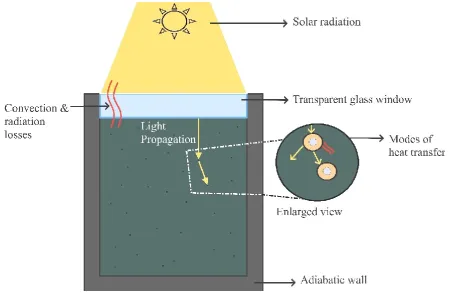
• Along with nanoparticles, phase change materials (PCMs) are added to improve the specific heat and act as the thermal storage medium. This is schematically shown in figure 2.1.
Figure 2.1: Concept of photothermal slurries.
9 the ambient atmosphere and thermal re-emission from the suspended particles. This is diagrammatically shown in figure 2.2.
Figure 2.2: The working concept of photothermal slurries in DASC.
In the experiments, the solar simulator is used to artificially produce solar heat flux in the UV-visible light spectrum. Therefore, the total incident energy on the collector (𝑄𝐼) is proportional to the solar simulator light intensity, the collector area on which simulated light is incident and a total time of irradiation and is given by equation Eq 2.1.
𝑄𝐼 = 𝐶. 𝐺. 𝐴𝐶𝑜𝑙𝑙. 𝑡 Eq 2.1
Where:
𝐶 is the concentration factor
𝐺 is the irradiance of the solar simulator in 𝑊
𝑚2 𝑡 is the total irradiation time in 𝑠𝑒𝑐𝑜𝑛𝑑(𝑠)
𝐴𝐶𝑜𝑙𝑙 is the surface area of the receiver in 𝑚2, given as 𝐴𝐶𝑜𝑙𝑙 = 𝜋
4 . (𝐷𝐶𝑜𝑙𝑙) 2.
𝐷𝐶𝑜𝑙𝑙 represents the diameter of the collector in meter (m), it is determined to be 30 𝑚𝑚 and
from this the area is calculated to be 706.85𝑚𝑚2(706.85 × 10⁻⁶𝑚2).
The heat absorbed by working fluid (𝑄𝑎𝑏𝑠𝑜𝑟𝑏𝑒𝑑)𝑤𝑓 depends on the specific heat capacity of the fluid, the mass of the fluid and the change in the temperature during the illumination represented by the equation 2.2. And the overall collector efficiency (𝜂𝐶𝑜𝑙𝑙𝑒𝑐𝑡𝑜𝑟) is the ratio of
10 (𝑄𝑎𝑏𝑠𝑜𝑟𝑏𝑒𝑑)𝑤𝑓 = 𝑚𝑤𝑓. (𝐶𝑝)𝑤𝑓. (𝑇𝑏𝑢𝑙𝑘− 𝑇𝑖𝑛) Eq 2.2 𝜂𝐶𝑜𝑙𝑙𝑒𝑐𝑡𝑜𝑟 = (𝑄𝑎𝑏𝑠𝑜𝑟𝑏𝑒𝑑)𝑤𝑓
𝑄𝐼 =
𝑚𝑤𝑓. (𝐶𝑝)𝑤𝑓. (𝑇𝑏𝑢𝑙𝑘− 𝑇𝑖𝑛)
𝐶. 𝐺. 𝐴𝐶𝑜𝑙𝑙. 𝑡
Eq 2.3
Where:
𝑚𝑤𝑓 is the mass of the working fluid in 𝑘𝑔
(𝐶𝑝)𝑤𝑓 is the specific heat of working fluid in 𝐽/𝑘𝑔𝐾
𝑇𝑏𝑢𝑙𝑘 is the average temperature of the fluid inside the collector at a particular instant of time in 𝐾
𝑇𝑖𝑛is the average initial temperature of the fluid in the collector in 𝐾.
The absorbed energy and collector efficiency at different heights of the receiver are given by the equation Eq 2.4 and equation 2.7 respectively. The absorbed energy at a particular height varies as a function of the mass and temperature change corresponding to the same height.
(𝑄𝑎𝑏𝑠𝑜𝑟𝑏𝑒𝑑)𝑤𝑓(𝑦) = 𝑚𝑤𝑓(𝑦). (𝐶𝑝)𝑤𝑓. (𝑇(𝑏𝑢𝑙𝑘)(𝑦) − 𝑇𝑖𝑛) Eq 2.4 𝑚𝑤𝑓(𝑦) = 𝜌𝑤𝑓. 𝑉𝑤𝑓(𝑦) Eq 2.5
𝑉𝑤𝑓(𝑦) =𝜋
4 . (𝐷𝐶𝑜𝑙𝑙)
2. 𝑦 Eq 2.6
𝜂𝐶𝑜𝑙𝑙𝑒𝑐𝑡𝑜𝑟(𝑦) =(𝑄𝑎𝑏𝑠𝑜𝑟𝑏𝑒𝑑)𝑤𝑓(𝑦) 𝑄𝐼 =
𝑚𝑤𝑓(𝑦). (𝐶𝑝)𝑤𝑓. (𝑇(𝑏𝑢𝑙𝑘)(𝑦) − 𝑇𝑖𝑛) 𝐶. 𝐺. 𝐴𝐶𝑜𝑙𝑙. 𝑡
Eq 2.7
Where:
𝑦 represents the different collector height in meter(m)
𝜌𝑤𝑓 is the density of the working fluid in 𝑘𝑔
𝑚3 (determined theoretically as explained below) 𝑉𝑤𝑓(𝑦) is the volume of the collector at a given height in 𝑚3
𝑇(𝑏𝑢𝑙𝑘)(𝑦) is the average bulk temperature at a particular height of the collector at the given instant of time.
In the experiments different working fluids like base fluid, nanofluid and PCM-nanofluid are irradiated under the simulator. Depending on the type of working fluid used in the experiment, the value of 𝜌𝑤𝑓 and (𝐶𝑝)𝑤𝑓 changes in the above equations, and is determined as follows. If
the working fluid is only base fluid(𝑏𝑓), then 𝜌𝑏𝑓 = 1000 𝑘𝑔
𝑚3 and (𝐶𝑝)𝑏𝑓 = 4.184 k𝐽/𝑘𝑔𝐾. If the working fluid is nanofluid (base fluid + nanoparticles), then the following expression holds:
𝜌𝑤𝑓 = 𝜌𝑛𝑓 = ((1 − 𝜙𝑛𝑝). 𝜌𝑏𝑓) + (𝜙𝑛𝑝. 𝜌𝑛𝑝) Eq 2.8
11 nanoparticle, 𝑤 is the mass fraction and subscript 𝑏𝑓and 𝑛𝑝 represents for the base fluid and the nanoparticles respectively, and other terms have the same meaning as described above.
If the working fluid is photothermal PCM slurries, then the equations are
𝜌𝑤𝑓 = 𝜌𝑠𝑙𝑢𝑟𝑟𝑖𝑒𝑠
= ((1 − 𝜙𝑛𝑝− 𝜙𝑃𝐶𝑀− 𝜙𝑠ℎ𝑒𝑙𝑙). 𝜌𝑏𝑓) + (𝜙𝑛𝑝. 𝜌𝑛𝑝) + (𝜙𝑃𝐶𝑀. 𝜌𝑃𝐶𝑀) + (𝜙𝑠ℎ𝑒𝑙𝑙. 𝜌𝑠ℎ𝑒𝑙𝑙)
Eq 2.10
(𝐶𝑝)𝑤𝑓 = (𝐶𝑝)𝑠𝑙𝑢𝑟𝑟𝑖𝑒𝑠
= ((1 − 𝜙𝑛𝑝− 𝜙𝑃𝐶𝑀− 𝜙𝑠ℎ𝑒𝑙𝑙). (𝐶𝑝)𝑏𝑓) + (𝜙𝑛𝑝. (𝐶𝑝)𝑛𝑝)
+ (𝜙𝑃𝐶𝑀. (𝐶𝑝)𝑃𝐶𝑀) + (𝜙𝑠ℎ𝑒𝑙𝑙. (𝐶𝑝)𝑠ℎ𝑒𝑙𝑙)
Eq 2.11
Where subscript 𝑠𝑙𝑢𝑟𝑟𝑖𝑒𝑠 represent photothermal PCM slurries, subscript 𝑃𝐶𝑀 represents the corresponding properties of PCM, and other terms have their usual representation as indicated above.
During the phase change process, the additional heat absorbed by the photothermal slurry is used for the phase transition from solid PCM to liquid PCM. The latent heat stored during the phase change depends on the effective mass of the PCM and the latent heat of fusion. This is represented by Eq 2.12.
The latent heat is added to Eq 2.7 to determine the overall performance of the collector during the phase change process and is as shown in Eq 2.13.
𝑄𝑙𝑎𝑡𝑒𝑛𝑡(𝑦) = 𝑚𝑃𝐶𝑀(𝑦). ∆𝐻𝑚 Eq 2.12
𝜂𝐶𝑜𝑙𝑙𝑒𝑐𝑡𝑜𝑟(𝑦) =(𝑄𝑎𝑏𝑠𝑜𝑟𝑏𝑒𝑑)𝑤𝑓(𝑦) + 𝑄𝑙𝑎𝑡𝑒𝑛𝑡(𝑦) 𝑄𝐼
= 𝑚𝑤𝑓(𝑦). (𝐶𝑝)𝑤𝑓. (𝑇(𝑏𝑢𝑙𝑘)(𝑦) − 𝑇𝑖𝑛) + 𝑚𝑃𝐶𝑀(𝑦). ∆𝐻𝑚 𝐶. 𝐺. 𝐴𝐶𝑜𝑙𝑙. 𝑡
Eq 2.13
Where:
𝑚𝑃𝐶𝑀(𝑦) is the mass of PCM at a given height in 𝑘𝑔
∆𝐻𝑚 is the latent heat of fusion of the PCM in 𝐽
𝑘𝑔
12
2.2 Experimental setup
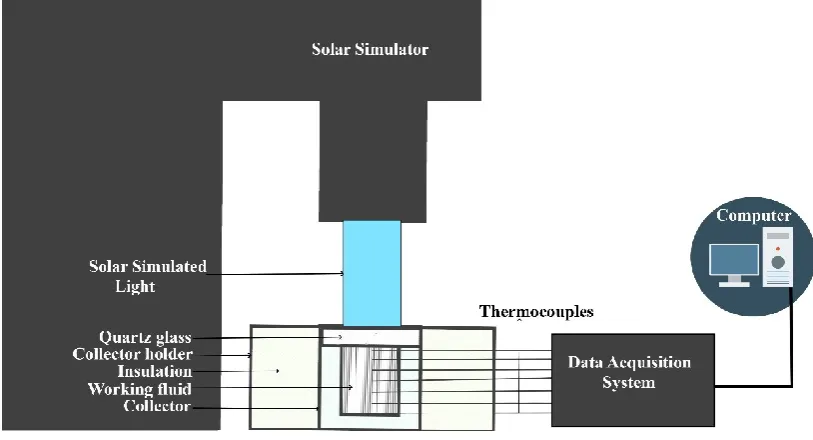
[image:22.595.110.517.175.395.2]To evaluate the photothermal conversion performance of the different working fluids for the direct absorption solar collector, a lab-scale stationary state experimental setup have been designed and installed, as illustrated in the figure 2.3. The experimental setup can be divided into two components: the photothermal conversion system and data collection system, as shown in figure 2.3.
Figure 2.3: Schematic of Direct Absorption Solar Collector experimental setup.
The photothermal conversion system consists of the solar simulator, collector, collector holder with insulation, and quartz window. The data collection system consists of thermocouples, data acquisition system, and the computer. The design of the solar collector system and instrumentation details are further discussed from sections 2.2.1 to 2.2.7.
2.2.1 Solar Simulator
13 output of 1000 𝑊
𝑚2 with air mass 1.5 global spectral filtering is equivalent to one sun. Further information on the lamp performance criteria is included in Appendix A1.
The installation of the solar simulator includes the following important components [42].
• An illuminator housing: The illuminator housing provides a safe enclosure to the
optical system, arc lamp, lamp ignitor, cooling system, and other electrical components. Its flat black outer surface minimizes stray light entering the illuminator. The housing is mounted on a riser assembly and this allows the head orientation to produce a downward-facing output beam. The illuminator housing has a control panel, with a switch to power on/off the illuminator, shutter close/ open button and operation indicators. The power on/off switch, powers the illuminator housing and turns on the cooling fans to provide forced-air cooling to maintain optimal lamp, optics, and housing temperature. The shutter close/open switch is used to manually activate the shutter either completely close the simulated light or completely expose the light. The operation indicators include a LED indicator for lamp on, shutter open, lamp replacement and a digital lamp hour indicator for easy monitoring of the lamp usage.
• Air mass filter: To match the solar spectrum under varying conditions, air mass(AM)
filter is used to correct the arc lamp light output. Sol3A simulator uses an AM1.5G filter, this filter simulates the global solar radiation, when the sun is at a zenith angle equal to 37°, as per the ASTM E 892 standard. It retains the optical properties under the operating conditions without degradation of the filter. The spectral distribution using AM1.5G filter is as shown in the appendix Figure A1.3.
• Partial sun attenuator: The partial sun attenuator is designed to manually control the
solar simulator irradiance level. The irradiance level can be increased by turning the knob in the clockwise direction and decreased by rotating in the counterclockwise direction. Although using the partial sun attenuator ensures class A spectral match of the system, it affects the uniformity. The percentage change in non-uniformity for sol3A simulator is included in Table A1.2. It is noted that non-uniformity tends to deteriorate, as the irradiance level is decreased.
• An arc lamp: The arc lamp produces the sources of light closely matching the UV-VIS
solar spectrum. A 450W ozone free xenon short-arc lamp is used for the purpose. The lamp is filled with purified xenon at 5-20 bar and the pressure triples during operation. The radiations are comparable to 5500-6000k black body radiations with some xenon lines superimposition dominant between 750 and 1000nm and the spectrum is shown in the appendix Figure A1.4. It is installed with a heat sink assembly to dissipate the heat produced during the operation of the lamp. The installed lamp is as shown in the appendix Figure A1.5. The power to the lamp is controlled by adjusting the setting in the power supply module.
• An arc lamp power supply: The constant electrical power/ current to the 450W xenon
14
• High flux beam concentrator: The high flux beam concentrator focuses the output
beam from the simulator, which is 51X51 mm to 30mm diameter spot at a working distance of 57.15mm. The concentrated beam energy density is increased by 9.5 times at 50.8mm working distance from the concentrator, with ±5% uniformity of intensity. It consists of multi-element fused silica lens assembly in a tube that extends up to 25.4 mm from the base of the solar simulator. The concentrator is attached to the simulator by an adapter that facilitates as a light-tight seal.
The installed solar simulator without and with beam concentrator is shown in the appendix Figure A1.1 and Figure A1.2 respectively.
2.2.2 Quartz window
It is a high precision glass window, with UV fused silica as a substrate. The quartz window is placed on top of the collector, it acts as a sealant, insulation to convective losses from the top of the collector and avoids a high evaporation rate. It helps in transmitting the incident solar heat flux from the simulator to the sample held in the collector container. The UV fused silica substrate allows wavelength in the range of 185 𝑛𝑚 to 2.1𝜇𝑚. The silica window is 50.8 𝑚𝑚 in diameter and 12 𝑚𝑚 in thickness. The specifications and transmission data is shown in Appendix A2. The benefits of using this glass window are increased transmission over a wide range of wavelength; for a given wavelength offers a lower index of refraction; better uniformity; and a low coefficient of thermal expansion.
2.2.3 Collector
The purpose of the collector in the photothermal conversion system is to hold the working fluid in a stationary state, during the irradiation time. The design requirement considered for the collector are: withstanding operating temperature up to 90°C, the temperature is limited to 90°C because the base fluid is water and hence heating above 90°C leads to evaporation losses and it is not desirable as this affects the concentration of the dispersed particles; low thermal conductivity, to minimize heat transfer losses through the collector walls; and easy machinability, to incorporate 6 thermocouples for temperature measurement at different heights of the collector. Apart from these the top of the collector is closed with the quartz glass and therefore the dimensions should match while they are assembled for experimentation and the working fluid should be within the solar simulator illumination area with and without beam concentrator.
15 two thermocouple T2 and T1 are 5.8mm apart so that the first thermocouple is not completely exposed to irradiation and doesn’t touch the quartz window. The non-dimensional location of the six thermometers installed in the center of the cylinder is determined to be 𝑦
𝐻=
0.05, 0.25, 0.44, 0.64, 0.84, 1, where 0.05 represents the non-dimensional distance of the first thermometer (T1) from the top of the collector and 1 represents the last thermometer (T6) at the bottom of the collector. Further, the isometric view and dimension specifications of the collector is shown in Figure A2.3 and Table A2.2 in Appendix A2 respectively.
Figure 2.4: a) Dimensions in mm and other details of the collector. b) 3D printed collector.
Next, the modeled design has to be built, for this 3D printing technique is chosen because of its easy prototyping, machinability, and cost. Also, the material used for 3D printing is polylactic acid (PLA) and has a melting point of 145 ⁰C, within the operating limit of 90 ⁰C. The 3D printed collector is as shown in figure 2.4b).To stably hold the collector in place during the experiment, a collector holder is designed and 3D printed, the details are shown in the appendix Figure A2.5 and Figure A2.6. The space in the collector holder is filled with an insulation material made from glass fiber, having a low thermal conductivity of 0.12𝑊
𝑚𝐾 [36].
The insulation minimizes the heat transfer losses and helps to isolate the collector from the surrounding.
The provision for thermocouples is resized, so the thermocouples are tightly held. The thermocouples are placed to the center of the collector. Further to avoid any leakage through the holes made for thermocouples positioning, silicone rubber adhesive is applied in the gap between the inner cylinder wall and outer cylinder wall and also on the periphery of the outer cylinder. This adhesive seals in the operating temperature ranging from -70⁰C to 200⁰C and has a low thermal conductivity of 0.17 𝑊
𝑚−𝐾. The flowchart in figure 2.5 highlights the design
16 Figure 2.5: The collector design process.
The top of the collector holder is covered with silver reflective tape as shown in Figure A2.6. The purpose of the reflective tape is to minimize the heating of the surrounding materials around the collector, that could influence the sample heating rate. Therefore, the sample in the collector is only heated under the influence of the direct irradiation. The other purpose of the reflective tape is to protect the insulation material from being damped, while transferring the working fluid to and from the collector, before and after the experiment respectively. The installed collector system is as shown in Appendix A2, Figure A2.6.
2.2.4 Thermometers
The temperature measurements are performed using a resistance thermometer detectors (RTD’s). From the availability of RTD’s, PT100 is used for temperature data collection. It works on the principle to measure the resistance of a platinum element. This type of thermometers needs calibration of resistance to a known reference temperature and the relationship between temperature and resistance is approximately linear over a small temperature range. The PT100 from Rossel Messtechnik has an operating temperature range from -100⁰C to +550⁰C with a tolerance of ±(0.15 + 0.002 ∗ 𝑡) in ⁰C, where 𝑡 is the operating temperature. The advantage of using this PT100 are: it is highly resistant against vibrations; short response times; mechanically resistant; and easily bendable to a small radius. The other technical specifications are included in Table A2.3. To convert the low-level signal from RTD’s into a high-level standard signal, a transmitter is used for this purpose. In the experiment a total of 8 RTD’s are used, of which 6 RTD’s are used for measuring the temperature of the working sample at different collector heights. The remaining 2 thermometers are used to monitor the surrounding environment temperature.
2.2.5 Data Acquisition system (DAQ)
17 used in the experiment is USB-6009 from National instruments. It is a multifunctional device with analog input/output channels, digital input/output channels and a 32-bit converter with a full-speed USB interface. The USB-6009 is controlled using a graphical programming language LabVIEW with a data collection rate of 2 samples per second. The installed USB-6009 along with transmitter is shown in Figure A2.7.
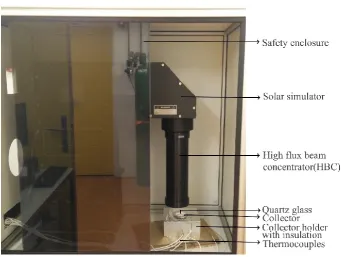
The installed direct absorption solar collector experimental set up is as shown in the figure 2.6 and 2.7.
[image:27.595.71.413.399.656.2]Figure 2.6: Data acquisition system.
18
2.3 Instrument calibration
2.3.1 Solar simulator setup fine-tuning
After installing the 450W lamp in the solar simulator, the solar simulator was tested for different power in the range of +10% to -20% of the nominal lamp rating. This was performed to determine the optimal working power and working distance with good uniformity of spectral intensity close to 1sun in the working plane. The intensity of the illuminator was measured using a PV reference cell at the optical center; at the boundaries of the working plane with co-ordinates (20,0), (0.-20), (-20,0) and (0,20) mm, with respect to optical center, as illustrated in the figure 2.8 and the actual set up is shown in Figure A2. 8 ; and also at different heights controlled by manually adjusting the lab jack.
Figure 2.8: Intensity measurement points for the non-uniformity profile.
The photo-thermal experimental sample will be placed within the working plane (40x40mm) and hence the uniformity is checked in this plane rather than the beam profile (51x51mm). At each working plane, the intensity is measured at all the 5 locations. From the known intensities the maximum and minimum are determined, later this is used in the equation A1.1 to determine the percentage non-uniformity in the spectral intensity. This is repeated for different heights and power. The intensity at the optical center as a function of height from the solar simulator to the reference cell, for different power is plotted, in figure 2.9a.
Figure 2.9: a) Intensity (optical center) vs height for different power. b) Non-uniformity as a function of height and power.
To validate the optimal working power and working distance, the percentage non-uniformity vs height for different working power is shown in figure 2.9b. The non-uniformity is almost constant for 365W operating power, in the working distance ranging from 210 to 160 mm. From the previous plot, for operating power of 365W, an initial working distance of 200 mm is chosen with an intensity of 1.01 suns at the optical center.
19
2.3.2 Thermometer calibration
The PT100 thermometers need to be calibrated before starting with the temperature measurements. The calibration process involves relating the detected voltage to a known reference temperature. The melting and boiling point of water is used as the reference temperature. The setup consists of magnetic stirrer with a hot plate from IKA model IKMAG RET, electronic thermometer for temperature regulation from IKA model IKATRON ETS D3, thermometer, glass beaker, demineralized water, 8 RTD’s to be calibrated and lab stand with clamps. The purpose of the hot plate with a magnetic stirrer is to maintain uniform distribution of heat in the water, the stirring is controlled by a knob set to the desired rpm. The electronic thermometer that is connected to the hot plate, helps in maintaining the hot plate to the desired temperature and the resolution of the temperature is 1K. The second mercury in glass thermometer is used as a reference thermometer, in addition to the electronic thermometer. To read the voltage output of the RTD’s, LabVIEW graphical programming is used. The setup is as shown in Appendix A2, Figure A2.9.
Initially, ice is placed in the glass beaker and it is made sure that all the RTD’s and thermometers are in contact with the ice before taking the voltage readings. Next, the hot plate with a magnetic stirrer is turned on, the stirring is set to 700rpm and for every 5 K increase in temperature, the corresponding voltage of the RTD’s are noted. It is necessary to make sure the RTD’s and thermometers are 70% immersed in the water, during every measurement. This procedure is repeated and from the collected data, the average of the three experimental voltages for different thermocouples is determined at different temperatures.
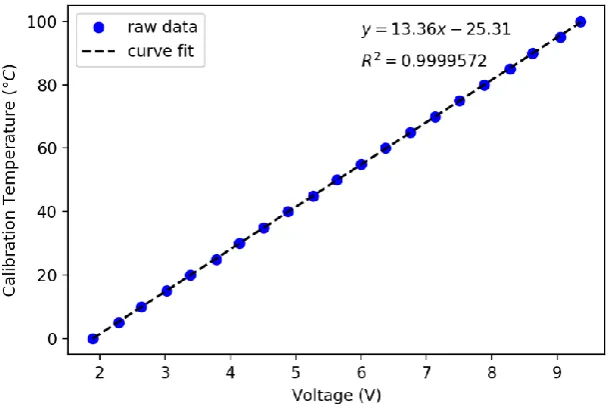
[image:29.595.77.382.505.707.2]The plot of temperature versus the averaged voltages for 8 different RTD’s is performed, Figure 2.10 shows for one of the RTD labeled T1. To the plotted results a linear curve is fit and its fit curve equation is determined. The closeness of the data points with the fitted curve (𝑅2
value) is estimated for the plotted results. The 𝑅2 value for all the RTD is determined to be ≃
0.9999572. The fit curve equation for different PT100 is used in the LabView program to directly relate the detected voltages into temperature.
20
2.4 Working fluids
The working fluids used in this experimentation can be categorized into base fluid, nanofluids, and photothermal slurries. The base fluid is distilled water, and the nanofluids are of two types, graphene nanoplatelet (GNP) and carbon black (CB). The photothermal slurries is a combination of nanofluids and phase change materials. Two different types of photothermal slurries are being tested for efficiency. In one type of slurries, a certain wax is microencapsulated by polyurea shell with GNP, due to confidentiality the results are not presented in this thesis. In the second type of slurries, shape stabilized palmitic acid/ silica di-oxide (𝑃𝐴/𝑆𝑖𝑂2) [37] combined with carbon black nanoparticles is studied. The schematic in Figure 2.11 outlines the sample used in the photothermal experiments.
Figure 2.11: Samples used in the photothermal experiment.
2.4.1 Preparation and characterization
The carbon black nanofluids are produced by dispersing a known concentration of carbon black nanoparticle; with the particle size of less than 30𝑛𝑚, in a known volume of distilled water, along with other stabilizing surfactants. Different concentration from 15PPM to 45PPM are prepared for photothermal testing.
The shape stabilized 𝑃𝐴/𝑆𝑖𝑂2 phase change material was prepared by sol-gel method and
material characterization are performed by Scanning Electron microscopy (SEM). The SEM image of 𝑃𝐴/𝑆𝑖𝑂2 particles shows homogeneous and uniform spherical structure with
diameters of 200-300𝑛𝑚. The melting and solidifying curves of palmitic acid and 𝑃𝐴/𝑆𝑖𝑂2 is
analyzed using Differential Scanning Calorimetry (DSC). From the DSC curves the 𝑃𝐴/𝑆𝑖𝑂2 starts melting at 63.1℃ and freezing at 59.2℃, whereas the pure palmitic acid melts and solidifies at 64.6℃ and 60.4℃, respectively. This data is referenced from [37] and the photograph of SEM and DSC are shown in Figure A3.1 and Figure A3.2 respectively in Appendix A3.
21 visible region compared to water, indicating high absorbance property, important for collecting sunlight irradiation.
The important physical and thermal properties that are used for further calculations are tabulated in Table 2.1.
Table 2.1: Physical and thermal properties of the working fluid.
Property Value Units
Density water (𝝆𝒘𝒂𝒕𝒆𝒓) 1000 𝑘𝑔/𝑚 3
Density carbon black(𝝆𝑪𝑩) 1700 𝑘𝑔/𝑚 3
Density palmitic acid (𝝆𝑷𝑨) 853 𝑘𝑔/𝑚 3
Density silica di-oxide (𝝆𝑺𝒊𝑶𝟐) 2410 𝑘𝑔/𝑚
3
Specific heat water (𝑪𝒑𝒘𝒂𝒕𝒆𝒓) 4.182 - 4.205 k𝐽/(𝑘𝑔𝐾)
Specific heat carbon black (𝑪𝒑𝑪𝑩) 710 𝐽/(𝑘𝑔𝐾)
Specific heat palmitic acid (𝑪𝒑𝑷𝑨) 1806 𝐽/(𝑘𝑔𝐾)
Specific heat silica di-oxide (𝑪𝒑𝑺𝒊𝑶𝟐) 705 𝐽/(𝑘𝑔𝐾)
Peak melting temperature 𝑷𝑨/𝑺𝒊𝑶𝟐(𝑻𝒎,𝒑𝒆𝒂𝒌) 63.1 ℃
Latent heat 𝑷𝑨/𝑺𝒊𝑶𝟐(∆𝑯𝒎) 74.8 𝑘𝐽/𝑘𝑔
2.5 Experimental procedure
The steps to power the instruments and setting up the sample for the photothermal experiment is outlined in this section.
2.5.1 Instrument phase
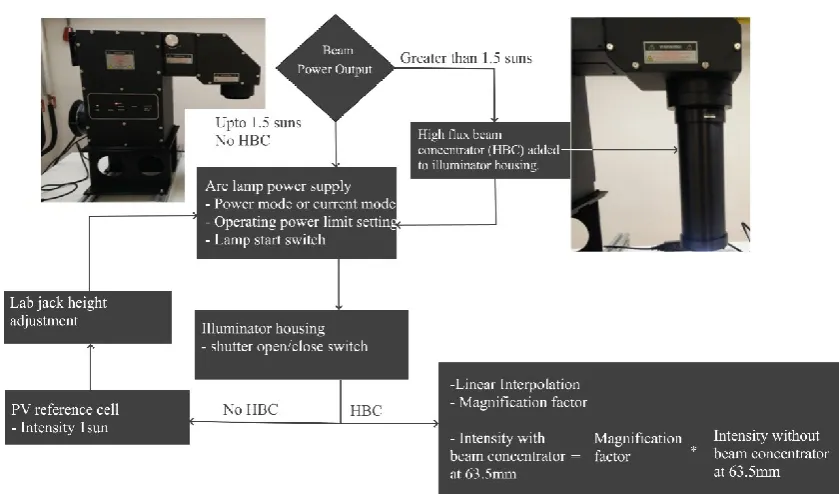
If the power output greater than 1.5 suns is required, then the high flux beam concentrator is added to the illuminator housing. For less than 1.5 suns, direct output from illuminator is used. The illuminator power switch and the power supply module is turned on. Next, the lamp power setting is configured in the power supply module. It is set to the desired mode, either constant power mode or constant current mode. In the constant power mode, the power limit is set in the range of +10% to -20% of the nominal lamp rating. After setting the desired power, the lamp start button on the power supply module turns on the solar simulator. It takes a few seconds to start the lamp. The illumination is controlled by using a shutter close/open switch. To ensure uniformity of irradiation in the working plane, a warm-up period of 30 minutes is given before placing the sample in the collector for the photothermal experiment. The power of the output beam is checked using the PV reference cell. If the desired output power is not attained, either lab jack height adjustments are made in the working distance ranging from 210 to 160 mm to have uniformity in the output beam, or the input power is adjusted on the power supply module.
22 silicon test cell had an output of 80.7mA at 50.8mm working distance. During the experiment, the sample will be placed at 63.5mm from the beam concentrator because the output beam from the concentrator is uniform\flattest at this working distance as provided in the beam concentrator report. From the above data, the output current is linearly interpolated and determined to be 77.09mA at 63.5mm working distance. The ratio of silicon test cell output with beam concentrator, to the silicon cell output without beam concentrator, determines the magnification factor. Using the PV reference cell, the intensity without the beam concentrator at a working distance of 63.5mm is determined to be 0.865 sun. Intensity without beam concentrator multiplied with the magnification factor determines the intensity with beam concentrator and found to be 7.8 suns. The general instrument phase outline is shown in the schematic 2.12.
Figure 2.12: Instrument phase schematic.
The other instrument used for the experiment are thermocouples and DAQ system, these are controlled via LABVIEW software. The calibrated thermometer equations are implemented in the LabVIEW graphical programming language. On running the program, the DAQ starts collecting the temperature data. The collected data is stored on the computer in the excel file format. This data is later retrieved and used for analysis using Python programming language.
2.5.2 Sample phase
23 The RTD’s are already placed in the collector, as described in section 2.2.3. In addition to measuring temperature, RTD’s stops any leakage through the holes drilled to place the RTD and furthermore it is sealed externally. Then, the known amount of sample is transferred to the collector with the help of a pipette. Further, the sample is filled till the upper edge (height=38.5mm) of the collector. Next, the quartz glass is placed on the filled collector, the excess sample flows out and is removed using a pipette. The excess sample added to the collector, to ensure no air bubbles are formed during the process of placing the quartz glass. The quartz glass acts as a sealant minimizing heat losses with the ambient. This whole assembly is placed under the solar illuminator for approximately 5400s to 9000s and the temperatures are recorded in the computer using the data acquisition system. The sample phase is pictorially represented as shown below. After the experiment, the used sample is removed and the collector is cleaned using isopropyl alcohol and the procedure is repeated for different samples.
24
Chapter 3
Results and Discussion
In this chapter, the experimental data is analyzed and the important results are discussed. In the first section, the temperature profile under low and high intensity are studied. The effects of collector height and irradiation time on temperature are discussed. In the subsequent sections, the collector efficiency and thermal storage are studied taking collector height and radiation time as the variable parameters.
3.1 Temperature distributions
The light from the artificial sun is absorbed by the working fluid in the DASC system and the light energy is converted into heat, thereby increasing the fluid temperature. At a given intensity of solar irradiation, the rate of temperature increase depends on the heat capacity, optical properties and thermal conductivity of the working fluid. The photothermal conversion performance of different working fluids is tested using a solar simulator with a solar flux of 1000𝑊
𝑚2 and 7800
𝑊 𝑚2.
During the instrument phase as discussed in section 2.5.1, the solar intensity is adjusted to 1000𝑊
𝑚2 (1 sun) by varying the height of illumination. The average temperature as a function of time and intensity level of 1 sun, for base fluid, is shown in figure 3.1, the water tends to reach a uniform temperature along the height of the collector. After irradiation time of 9000s, the maximum temperature reached by water at the top of the collector is 41.19℃ and the overall maximum bulk temperature reached is 39.94℃. For the same irradiation time, the maximum temperature difference between the first thermometer and last thermometer is 1.25℃. The temperature gradient along with the height of the collector, at the end of the irradiation, is determined to be 0.041℃/𝑚𝑚. The slope of the temperature-time plot decreases with increase in time, which is due to the rise in the temperature difference between the working fluid and the surrounding ambient, resulting in higher heat losses.
25 Figure 3.2 shows the average temperature variation with time for nanofluid with 45PPM carbon black (CB) particle. In comparison to water, the nanofluid has higher temperature increment as seen in the plot. The rate of rising in temperature is steep for the nanofluid in the first 2000s due to the small temperature difference between the working fluid and the environment. After 2000s the slope gradually tends to reduce, because of the increased heat losses with the ambient, causing the working fluid temperature to reach an equilibrium temperature with the surrounding. The maximum temperature achieved by this nanofluid after 9000s at the top of the collector and overall bulk temperature along the height of the collector is 50.40℃ and 44.43℃ respectively. Compared to base fluid, nanofluid shows a 22.35% temperature increase at the top of the collector and 11.24% considering the complete collector. This enhancement in temperature rise is due to the carbon nanoparticles dispersed in the base fluid.
Figure 3.2: Average temperature as a function of time at 1 Sun irradiation for carbon black 45PPM.
26 Figure 3.3: Average temperature as a function of time with 1 Sun irradiation for 𝑃𝐴/𝑆𝑖𝑂2 10wt%-45PPM.
Table 3.1: Average temperature summary after 9000s.
Samples
Height y/H=0.05 Height y/H=1
Average Temperature
(℃)
Temperature increase compared to
water (%)
Average Temperature
(℃)
Temperature increase compared to
water (%)
Water 41.19 - 39.94 -
45PPM CB - nanofluid
50.40 22.35 44.43 11.24
10wt% 𝑷𝑨/𝑺𝒊𝑶𝟐
-45PPM CB slurry 46.02 11.72 40.15 0.5
To analyze the thermal storage performance of 𝑃𝐴/𝑆𝑖𝑂2 10wt% - 45PPM CB slurry with a peak phase change temperature at 63.1℃, the sample is irradiated with 1sun intensity, for a duration of 23400s (6.5 hours) as shown in figure 3.4. From the plot, it is clear that the temperature tends to reach an equilibrium with the ambient. The maximum temperature achieved at the top of the collector (y/H =0.05) after 6.5 hours of 1 sun irradiation is 50.30 ℃. This temperature is far below than the required peak phase change temperature. Therefore further experiments were performed by installing high flux beam concentrator (HBC) with an intensity of approximately 7800 𝑊
27 Figure 3.4: Average temperature as a function of time with 1 Sun irradiation of 𝑃𝐴/𝑆𝑖𝑂2
10wt% 45PPM till 25000s.
The temperature variation of different working fluids along the height for a time duration of 3000s, for a high-intensity solar radiation, is shown in figure 3.5. In the plots, 0mm collector height represents the top of the collector and 30mm the bottom of the collector. As observed in the contour plot 3.5, the maximum temperature change is seen at the top part of the collector at any given instant of time, except for water. Another observation from the contour plots at the end of 3000s, in the top part of the collector, is that the temperature gradients are decreasing in the following order: CB nanofluid, 𝑃𝐴/𝑆𝑖𝑂2- CB slurry, plain 𝑃𝐴/𝑆𝑖𝑂2 2wt% and finally
water.
The temperature gradient for water is almost close to zero at any given time, indicating uniform heating of the base fluid. For all other samples during the radiation time of 3000s, a non-uniform temperature is seen along the collector height. This non-non-uniform temperature along the depth is because of the added micro and nanoparticles to the base fluid. These added particles absorb the energy from the incident radiation and increase the fluid temperature. This rapid rise in temperature in the top section of the collector creates a temperature gradient in the remaining part of the collector. Even though the added nanoparticles help to achieve a high temperature in a short amount of time, but will not create a uniform temperature throughout the collector volume. The reason is that part of the incoming light is blocked or reflected by the added particles, and also the photon energy deteriorates in the depth direction[38]. Consequently, for the bottom part of the DASC, the prominent part of the heat source/ temperature driving force is the conduction from the upper high-temperature fluid.
28 Figure 3.5: Temperature profiles at different heights and time up to 3000s; for a)base fluid - water, b)CB 25PPM, c)CB 35PPM, d) 𝑃𝑎/𝑆𝑖𝑂22wt%, e) 𝑃𝐴/𝑆𝑖𝑂22wt%-9PPM CB, f)𝑃𝐴/𝑆𝑖𝑂2-4wt% 18PPM CB.
• Effect of irradiation time:
29 Figure 3.6 and 3.7, presents the temperature profile at top (y/H=0.05) and bottom (y/H=1) of the collector height, respectively: for base fluid; nanofluids with CB concentration of 25PPM and 35PPM; 𝑃𝐴/𝑆𝑖𝑂2 2wt%; 𝑃𝐴/𝑆𝑖𝑂2 2wt%- 9PPM CB slurry; and 𝑃𝐴/𝑆𝑖𝑂2 4wt%-18PPM CB slurry as shown in the figure legend.
In the initial 1800s, at the top of the collector (𝑦
𝐻= 0.05, figure 3.6), the curves of carbon
black samples and 𝑃𝐴/𝑆𝑖𝑂2 – carbon black slurry samples show a sharp rise in temperature compared to water. The nanoparticles effective photon capture and molecular heating property attribute to the sharp increase in temperature behavior of the CB nanofluids and PCM slurries. Besides, the temperature rise of 𝑃𝐴/𝑆𝑖𝑂2 2wt%- 9PPM CB slurry is 31.58% better than the
pure 𝑃𝐴/𝑆𝑖𝑂2 2wt%, again indicating the ability of carbon black as a good photon absorber. After 1800s at the same height, rate of temperature growth for all the sample reduces, mainly because the temperature difference between the collector and the ambient increases, causing more convective heat losses from the top of the collector [39]. The carbon black sample attains a temperature of 90℃ within 3000s, while other samples are still below 65℃. In the case of 𝑃𝐴/𝑆𝑖𝑂2 – CB slurries reach a phase change onset temperature, hence the decline in slope indicating the latent heat storage, this will be further addressed in the thermal storage section.
At the end of 9000s of irradiation for the same height, 𝑃𝐴/𝑆𝑖𝑂2 4wt%-18PPM CB slurry reaches the highest temperature of 85.5℃, followed by 𝑃𝐴/𝑆𝑖𝑂2 2wt%-9PPM CB slurry (81.09℃), next by water (73.4℃), and finally 𝑃𝐴/𝑆𝑖𝑂2 2wt%. This 𝑃𝐴/𝑆𝑖𝑂2-CB slurry
[image:39.595.78.518.428.633.2]reaching the maximum temperature at the end of irradiation is due to the extra carbon black nanoparticles in the slurry.
Figure 3.6: Temperature as a function of time, for different samples at y/H=0.05.
At the bottom of the collector (y/H=1, figure 3.7), temperatures of all the samples are lower than the temperatures at the top of the collector (y/H=0.05), except for water. For instance, at 1800s, the temperature of 𝑃𝐴/𝑆𝑖𝑂2 2wt%-9PPM CB slurry is 0.63 times lower than the
30 Figure 3.7: Average temperature as a function of time, for different samples at y/H=1.
Table 3.2 shows the summary of the average temperature increment and decrement of the samples, compared to water at heights y/H=0.05 and y/H=1, for a different time. Thus from the table at y/H=0.05, the rate of rising in temperature is highest for the CB nanofluids, because of the higher concentration of nanoparticles compared to the CB nanoparticles in the 𝑃𝐴/𝑆𝑖𝑂2 – CB slurries. In the case of 𝑃𝐴/𝑆𝑖𝑂2 – CB slurries the minimum enhancement is achieved at
the end of irradiation at the top of the collector. In contrast, at the bottom of the collector (y/H=1) throughout the irradiation time, PCM slurries temperature is not enhanced, due to the reduced transparency of the photo-thermal slurries. However, the negative sign for the CB nanofluids (y/H=1) indicates the increment in the temperature compared to water. Therefore up to 3000s, CB nanofluids achieves high temperature, irrespective of collector height.
Table 3.2: Summary of temperature variation compared to water at top and bottom of the collector for different time.
Temperature increment (%) with reference to water at
height y/H=0.05
Temperature decrease (%) with reference to water at
height y/H=1 Time(s)
Samples
1800 3000 9000 1800 3000 9000
25PPM CB -
nanofluid 71.4 57.7 - -15.7 -14.6 -
35PPM CB - nanofluid
75.6 61.6 - -14.6 -17.9 -
𝑷𝑨/𝑺𝒊𝑶𝟐 2wt%- 9PPM CB slurry
37.4 26.7 10.5 10.4 12 12.7
𝑷𝑨/𝑺𝒊𝑶𝟐 4wt%- 18PPM CB slurry
![Figure 1.1: Solar energy availability[18].](https://thumb-us.123doks.com/thumbv2/123dok_us/9606633.463693/13.595.75.413.93.350/figure-solar-energy-availability.webp)
![Figure 1.2: Solar thermal collectors general classification [21].](https://thumb-us.123doks.com/thumbv2/123dok_us/9606633.463693/14.595.74.491.132.364/figure-solar-thermal-collectors-general-classification.webp)