VISUALIZING OCEAN CARRIER PERFORMANCE
A FRAMEWORK FOR EVALUATING LOGISTIC PARTNERS
WIM KLAASSEN
BSC INDUSTRIAL ENGINEERING & MANAGEMENT University of Twente
Visualizing Ocean Carrier Performance: A framework
for evaluating logistic partners
Bachelor Thesis Industrial Engineering & Management Enschede, May 2019
Author
Wim Klaassen S1737783 BSc Industrial Engineering and Management
CAPE Groep BV
First Supervisor University of Twente
Transportcentrum 14 Prof. Dr. M. E. Iacob
7547 RW Enschede Adjunct Professor
Netherlands Dep. of Industrial Engineering and
www.capegroep.nl Business Information Systems
University of Twente
Second Supervisor University of Twente
Drienerlolaan 5 Dr. L. O. Meertens 7522 NB Enschede Assistant Professor
Netherlands Dep. of Industrial Engineering and
www.utwente.nl Business Information Systems
Supervisor CAPE Groep BV
Principal Researcher TKI Dinalog project
Mr. M. Wesselink Mr. J.P.S. Piest
Consultant Professional Doctorate in Engineering CAPE Groep Dep. of Industrial Engineering and
i
Preface
This bachelor thesis is written in fulfilment of the bachelor Industrial Engineering and Management at the University of Twente. The writing of this thesis has been an exciting and challenging journey for the last six months. This research was conducted on behalf of CAPE Groep for a Logistic Service Provider. During this assignment, I investigated how the performance of ocean carriers can be visualized and ranked, to improve the selection of carriers.
I want to thank CAPE Groep for giving me the opportunity to conduct my research. I want to show my gratitude to Maik Wesselink in particular, for providing guidance and information during this assignment. Furthermore, I would like to thank the Logistic Service Provider for the opportunity to conduct research in their company and improve their processes.
Moreover, I would like to thank my supervisors from the University of Twente, Maria Iacob and Lucas Meertens, for providing valuable feedback to my research. Special thanks to Sebastian Piest, who provided me with constructive criticism and advice on the TKI Dinalog project.
In addition, I would like to thank my family and Joost Postma for suggestions, support, and feedback on my thesis. Moreover, I would like to thank my fellow graduation students for valuable insights regarding the thesis.
I wish you a pleasant read.
ii
Management Summary
Introduction
The maritime sector has a bad reputation regarding the performance of vessels. The Logistic Service Provider (LSP) in this research is struggling to contract the best performing carrier on each route. At this moment a carrier is contracted based on price alone, as no up-to-date performance is available for the different carriers. The research will provide a solution for the visualization and comparison of current carrier performance.
This research is conducted at CAPE Groep, commissioned by an LSP who handles the outbound logistics of Company X. Customers of Company X have expressed their concerns regarding the information sharing of orders and performance of carriers. Furthermore, employees of the LSP are experiencing a high workload, as a lot of time is lost in solving problems for delayed shipments. Both these issues occur as there is no up-to-date performance data available. Furthermore, there is only a limited amount of data available in the Logistic Management System of the LSP.
Firstly, the aim of this research is to visualize and automate the calculation of carrier performances, which must be done frequently. Secondly, research will be conducted into the collection of extra data, as some destinations only have a limited amount of orders each quarter, or do not have performances available for every carrier.
In this study, the main research question is answered:
“Which KPIs are valuable in evaluating an ocean carrier’s performance, and how can these KPIs be
visualized to give a Logistic Service Provider insight into carrier performance?”
Approach
To solve the problem and develop the solution, the systematic approach of the Design Science Research Methodology was followed. Literature research together with interviews determined the design and functionalities of the prototype. For the development of the dashboards, literature research was conducted into the following subjects:
• KPIs for evaluating ocean carrier performance • Managing the data required for KPI calculations
• Ranking the performance of carriers, based on multiple criteria • Designing a functional and attractive dashboard.
Prototype design
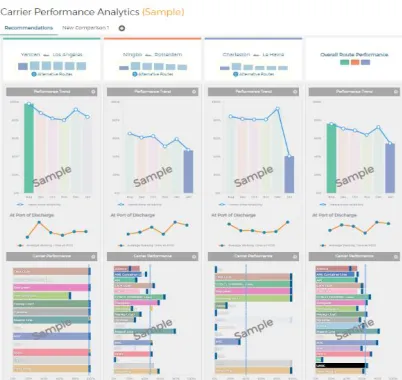
As a result of the literature research and conversations with the LSP, a prototype was created. Three different dashboards have been created in the Mendix application of the LSP, based on solution objectives. Each of these dashboards can be filtered on different criteria such as Port of Delivery, Shipping Lane, Carrier, Sales Area and Time period.
• General dashboard: Overview of the average performance of different carriers. This dashboard allows for carrier comparisons on specific Shipping Lanes or Areas.
• Carrier dashboard: Overview of the performance of different carriers on different routes. This dashboard allows for comparing the performance of a carrier on different routes.
iii Conclusions and recommendations
This research improves the availability of carrier performance, by automating the calculation of performance KPIs. The designed dashboards solve the core problem as performances of carriers are updated each day. The restrictions in the dashboard allow the LSP to compare different carriers on the different shipping lanes in a period.
Despite the realization of the goals, the prototype can be improved. Therefore, several recommendations are given to improve the prototype: Preparing the prototype for production, Collection of additional data, addition of extra functionalities, customer dashboards, and options for further research are discussed.
From use case to general framework
iv
Table of contents
Preface ... i
Management summary ... ii
Reader’s guide ... vi
List of abbreviations ... vii
Definitions ... vii
List of Figures and tables ... ix
1. Introduction ... ix
1.1 Context ... 1
1.2 The involved companies ... 1
1.3 Introduction to the problem ... 2
1.4 Problem statement ... 3
1.5 The core problem ... 5
1.6 Relevance of the problem ... 6
1.7 Methodology & Research Questions ... 6
1.8 Scope ... 8
1.9 Structure of the report ... 8
2. Current and preferred situation ... 9
2.1 Current processes ... 9
2.2 Ideal situation ... 10
2.3 Goals ... 10
2.4 Measurability ... 11
3. Framework ... 13
3.1 KPIs for evaluating ocean carriers ... 13
3.2 Data management ... 14
3.3 Multi-Criteria Decision Analysis... 16
3.4 Dashboards ... 17
4. New situation ... 19
4.1 KPI Selection ... 19
4.2 Data gathering unknown carriers ... 21
5. Design and development ... 24
5.1 Prototype requirements ... 24
v
5.3 Scrum ... 25
5.4 Architecture ... 25
5.5 Development of the prototype ... 26
5.6 Data management ... 28
5.8 Dashboard aggregations ... 31
5.9 Ranking the Carriers ... 31
6. Prototype demonstration ... 32
6.1 General dashboard ... 32
6.2 Carrier dashboard ... 33
6.3 Poor performing shipping lanes ... 33
6.4 KPI weight settings ... 34
6.5 Biceps ranking... 35
6.8 User feedback ... 35
7. Conclusion ... 36
7.1 variables and indicators ... 37
7.2 Limitations ... 37
7.3 Recommendations... 38
8. Framework for evaluating logistic partners ... 40
8.1 Conclusion ... 42
References ... 43
vi
Reader’s guide
This report contains the research conducted for the bachelor’s thesis Industrial Engineering and Management. The research titled “Visualizing Ocean Carrier Performance: A framework for evaluating logistic partners” is structured into eight chapters, which are introduced below.
Chapter 1 | Introduction covers a general introduction into the research. The context of the problem is discussed as well as the companies involved in this project. The problem is then introduced and investigated to find the core problem. The relevance of solving the problem is addressed, after which the methodology and research questions for solving the problem are discussed.
Chapter 2 | Current and preferred situation addresses two current processes occurring at the LSP. afterwards, the ideal situation for the LSP is explained and the goals for this research are determined. To measure the improved situation, several variables and indicators were determined.
Chapter 3 | Theoretical Framework explains the theory that is used for the development of the prototype and framework. A systematic literature review was done into KPIs that asses the performance of carriers, as well as research into data management, Multi-Criteria Decision Analysis, and dashboards.
Chapter 4 | New Situation clarifies the KPIs that were chosen from the literature and will be implemented in the prototype. Furthermore, research was done into the collection of extra data on ocean carriers, as there is only a limited amount of performance data available on certain destinations.
Chapter 5 | Design and Development shows steps taken in the creation of the prototype. Firstly, the requirements were determined, after which Mock-ups were created. Then, the approach of developing the prototype is discussed, as well as its architecture. The development is addressed afterwards, as well as the management of the data. And finally, KPI calculations and the ranking of carriers is shortly described.
Chapter 6 | Prototype Demonstration visualizes the developed dashboards. The page for changing the KPI weights is showed as well, as it was specifically developed for this prototype. And lastly, the carrier overview page is shown, as it is used for the updating of KPIs.
Chapter 7 | Conclusion answers the question whether the developed dashboards solved the core problem and improved the current situation. In this chapter, the limitations of this research and also recommendations for further research are discussed.
vii
List of abbreviations
ATA Actual Time of Arrival
ATD Actual Time of Departure
BPMN Business Process Model and Notation
B/L Bill of Lading
DSRM Design Science Research Methodology
ETA Expected Time of Arrival
ETD Expected Time of Departure
KPI Key Performance Indicator
LMS Logistic management system (Mendix application)
LSP Logistic Service Provider
MPSM Managerial Problem-Solving Method
MVP Minimal Viable Product
POD Port of Delivery
POL Port of Loading
SME Small and Medium Enterprises
STA Scheduled Time of Arrival
STD Scheduled Time of Departure
Definitions
Known carriers Carriers that were contracted in a certain quarter. The performances of these carriers can be calculated through the saved shipment information of the orders.
Unknown carriers Carriers that were not contracted in a certain quarter. No performance information is available in the system of the LSP. Therefore, information on their performance must be collected from other sources.
Cold store A Building which is artificially cooled so that food can be preserved in it. Reefer container A shipping container, also called refrigerated container, used in
intermodal freight transport, that can effectively control the temperature between -65°C and 40 °C.
Problem cluster A tool that helps a researcher find the relations between the problems. It brings order to the context and identifies the core problem(s) (Heerkens, van Winden & Tjooitink, 2017).
Problem owner A person, a group, or an organization, that feels that a certain problem exists (Heerkens et al., 2017).
Action Problem The discrepancy between the norm and reality as perceived by the owner of the problem (Heerkens et al., 2017).
viii Core Problem The problem(s) that is/are chosen to be solved. This problem cannot be caused by other problems. Not all causes of the problems are worth solving. For example, problems like the weather cannot be solved, or other solutions cost more than they return (Heerkens et al., 2017). KPI A Key Performance Indicator is a measurable value that shows the
performance of a business objective.
DSRM A methodology for conducting Design Science Research in Information Systems. The object created in this methodology is an artefact and the two major activities are designing and investigating this artefact. The artefact is designed to interact with the problem context and improve it (Wieringa, 2014).
MPSM A simple framework and method to solve managerial problems. It can be applied to various problems by following the seven phases. The Managerial Problem Solving Method takes into account that most problems are not an isolated issue and expresses these problems in variables (Heerkens et al., 2017).
Mock-up In software engineering, a mock-up is used to create a user interface that shows the end user what the software and functions will look like. It is not required to build the software or functionality. By using mock-ups, feedback can be collected in the early stages of development, which saves both time and money.
Balanced Scorecard A business framework for tracking and managing an organizations strategy. the BSC distinguishes 4 different perspectives: Learning and growth, Business processes, Customer perspective and financial data (Kaplan & Norton, 1996).
ix
List of Figures
Figure 1: Problem cluster ... 3
Figure 2: Design Science Research Methodology (Peffers et al., 2008) ... 6
Figure 3: Arbela Maturity Model (Arbela, 2017) ... 12
Figure 4: Example Mendix domain model ... 14
Figure 5: Data quality Dimensions (DAMA, 2016) ... 15
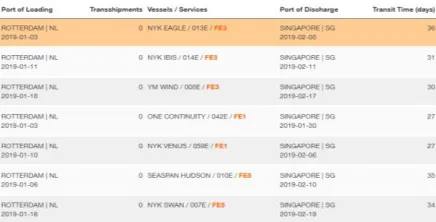
Figure 6: Sample dashboard (Big Schedules, 2019) ... 22
Figure 7: Example historic performance (Hapag-Lloyd, 2019) ... 23
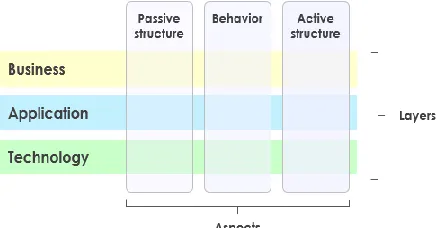
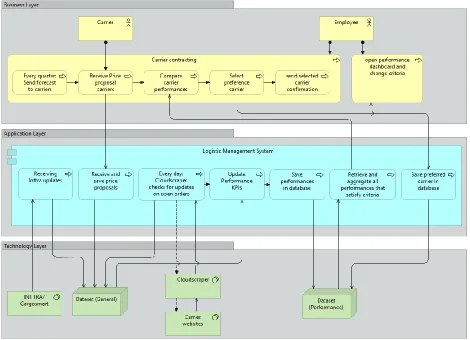
Figure 8: ArchiMate Core Framework ... 25
Figure 9: ArchiMate Model ... 26
Figure 10: A Simplified domain model ... 27
Figure 11: Example Microflow ... 27
Figure 12: Scheduled event performance update ... 29
Figure 13: Microflow retrieve shipments ... 29
Figure 14: General dashboard ... 32
Figure 15: Carrier dashboard ... 33
Figure 16: Poor performing shipping lanes ... 33
Figure 17: KPI weight settings ... 34
Figure 18: BICEPS Ranking ... 35
Figure 19: Framework logistic partner evaluation ... 40
Figure 20: Current shipment planning process ... 47
Figure 21: Current Carrier contracting process ... 49
Figure 22: Mock-up General dashboard ... 55
Figure 23: Mock-up Carrier dashboard ... 55
Figure 24: Mock-up Poor performing shipping lanes ... 56
Figure 25: Scrum Process ... 57
Figure 26: User stories for Sprint 1 ... 59
Figure 27: User Stories for Sprint 2 ... 59
Figure 28: User stories for sprint 3 ... 59
List of Tables
Table 1: Legend problem cluster ... 3Table 2: Structure of the report ... 8
Table 3: Evaluating the improvements in the prototype ... 12
Table 4: Prototype KPI selection ... 19
Table 5: Selected KPIs ... 36
Table 6: Possible data collection sources ... 36
Table 7: realized improvements in the prototype ... 37
Table 8: Different sales areas ... 50
Table 9: Search string and found sources ... 51
Table 10: Inclusion and exclusion criteria ... 51
Table 11: KPIs retrieved from literature and grouped by perspective ... 53
Table 12: Distinct KPIs, availability and collectability... 54
Table 13: Data used for KPI calculations ... 60
1
1 Introduction
In this chapter, companies that are involved in the project are introduced in section 1.2 after the general problem context is addressed in section 1.1. Additionally, a description of the occurring problems can be found in part 1.3. The core problems will be identified by means of a problem cluster in section 1.4 and 1.5, after which in part 1.6 the relevance is described. Section 1.7 states the research questions and problem approach. Finally, the scope and structure of the report are discussed in section 1.8 and 1.9 respectively.
1.1 Context
The world seaborne transportation was estimated at a total of 10.7 billion tons in 2017, which make it the largest transport method in terms of weight (Asariotis et al., 2018). 17.1% of this maritime transport was transported overseas in large 20- or 40-foot containers. Over the years, customers have been more demanding regarding the on-time arrival of their shipments. Customers are requesting more performance and information about delivery times and transport visibility. However, the maritime sector has a bad reputation with respect to the timeliness of vessels. In 2018 the average schedule reliability only measured 62.3% (CargoSmart, 2019). Logistic Service Providers have difficulty in selecting the best performing carriers, in order to improve the performances of containers shipped by them, as little information about carrier performance is available.
1.2 The involved companies
Multiple companies were involved in the creation of this report. Therefore, each company will be introduced together with their role in this research.
CAPE Groep
CAPE Groep, where is referred to as ‘CAPE’ further in this report, is an IT consultancy company which delivers services like software development, connectivity, business intelligence and integrations to businesses. These services are mainly created with the model-driven development platforms Mendix and eMagiz. Whereas Mendix is the foundation of dynamic and customized applications, eMagiz provides integrations between the different IT systems used by a company and the Mendix applications.
Logistic Service Provider
A Logistic Service Provider, from here on referred to as LSP, takes care of the partial or total logistics services of a company as a third party. LSPs are specialized in transport and can serve multiple clients at
the same time (“Logistic Service Provider,” 2013). In this situation, the LSP1 is a customer of CAPE and takes care of all the outbound logistics of a company that produces frozen food: Company X. The LSP does not own any trucks or vessels, but places orders for the shipments at the different carriers. CAPE has developed an application where all the orders of the LSP are processed and stored: the Logistic Management System (LMS).
Company X
Company X is a producer of frozen potato products, which are transported all over the world. The frozen potato products are shipped in 20- of 40-foot reefer containers, which can effectively control the temperature between -60 °C and 40 °C (“Refrigerated containers,” n.d.). Company X used to have its own
2 logistics department, but growth resulted in outsourcing the logistical processes. The LSP was founded to take care of the logistics of company X.
Dinalog project
This research is part of the “Autonomous Logistics Miners for Small-medium Businesses” project of TKI-Dinalog. The mission of TKI-Dinalog is to boost innovation in the logistics of the Netherlands to maintain en strengthen the logistics sector. The aim of this project is to increase the competitiveness of Small and Medium Enterprises (SMEs) by using smart data mining agents, which process data with minimal intervention of humans (“Autonomous Logistics,” 2018). Large quantities of data will be analyzed to help SMEs react quickly on disruptive circumstances and delays in the supply chain. Furthermore, it will help SMEs respond to the changes in trends and demand and provide insight into performance indicators and efficiency.
INTTRA / CargoSmart
INTTRA is an ocean trade platform, where shipments can be planned, booked and tracked from one easy-to-use software system. To date, it is the largest shipping network in the world with more than 60 connected carriers, including 9 of the top 10 shipping companies based on Twenty-foot Equivalent units
(TEU) According to “Top 10 International Container Shipping Companies” (2016).
CargoSmart is also a platform that, among other offered solutions, provides shippers with the option to submit booking requests online to improve the speed of the bookings. Over 40 carriers are connected to this platform including some of the world leading ocean carriers (CargoSmart, 2019). The LSP in this research mainly uses this platform for the carriers that are not connected to the INTTRA platform like Orient Overseas Container Line (OOCL).
1.3 Introduction to the problem
The Logistics service provider takes care of all outbound logistics of Company X. The deep-frozen food Company X produces, is shipped all over the world. Every week, on average 165 containers of potato products are transported from the factory to a cold store and from the cold store to the port of destination. The customers take care of road transport between the destination port and their businesses themselves.
Every quarter, carriers are contracted for the different destinations the reefer containers must be shipped to. The LSP sends a list to all carriers with the expected number of containers that need shipping. The carriers decide on which route they want to compete for a contract with other carriers. If they want to do a bid on a certain route, they send back their price proposal. Additionally, the carriers include extra conditions like the number of days a container can stay free of charge in the destination port.
At this moment, the decision for a carrier on each route is primarily based on price, as the other conditions included in the proposal are not very important to the LSP. No up-to-date information on carrier performance is easily accessible by employees of the LSP, which limits them to selecting carriers only based on price.
3
1.4 Problem statement
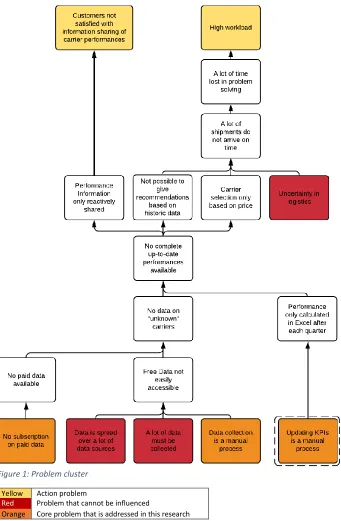
To get a clear overview of the problem and show the relations between the problems, a problem cluster was created. The problem cluster starts with a situation that is not how we want it to be, in this case the high workload at the LSP and the customers that are not satisfied with the sharing of shipment information. The discrepancy between this reality and the norm we want to have is called the action problem (Heerkens et al., 2017).
Yellow Action problem
Red Problem that cannot be influenced
[image:14.612.114.455.167.688.2]Orange Core problem that is addressed in this research Table 1: Legend problem cluster
4 The problem cluster starts at the top with the two action problems high workload and unsatisfied customers. Planners of the LSP lose a lot of time in handling the problems that occur during the shipping of orders, which increases their workload. When looking back on the performances of carriers in the last quarters, a lot of shipments did not arrive at the time initially promised by the carrier. For every shipment that did not arrive on time, the LSP must track the shipment, contact the carrier and inform customers with the new information on their shipments.
One of the main reasons that a shipment does not arrive on time, is that the preferred carrier is only selected based on the price that is offered before each quarter. When an employee books an order, he looks which carrier is contracted on that route and checks their scheduled sailings towards that destination. Only If no sailing is available within the timeframe, then another carrier is selected for the shipment. The current process of booking a shipment, together with the carrier contracting process were visualized using the BPMN to clarify the processes and find possibilities for the data visualization. Both these processes are addressed in Chapter 2: Current situation.
Secondly, it is not possible to give recommendations to planners based on historical data when booking a shipment. For example, a carrier is always around 7 days late when sailing from Rotterdam to Shanghai. A customer needs to have extra stock to take care of this uncertainty. When it is known that a carrier is around 7 days late, the LSP books a sailing one week earlier and the shipment is now at the right time in Shanghai which reduces the amount of stock the customer should have because the arrival date is more accurately determined.
And the last reason why shipments are often late is the uncertainty in logistics. This uncertainty is caused by unexpected breakdowns, weather, customs delays and many more. Unfortunately, most of these problems are not solvable by an LSP or only have a minor impact on the process which makes them not attractive to solve.
As mentioned before as the other action problem, the customers of company X are not content with the current sharing of information. The information on carrier delays is only shared reactively after the shipment is delayed, and performance information on specific destinations is not available to share with customers. Company X has given high priority to sharing relevant and up-to-date shipping information with customers. The data that is used for the sharing must come from the LSP, who takes care of the outbound logistics.
At this moment, customers cannot be informed with actual and complete performance data. There are multiple reasons why the performance data is not available or up-to-date: The Performances of shipments are not calculated frequently and they are not easily accessible for employees of the LSP. Furthermore, there is no performance data on carriers that did not ship containers for the LSP in a certain quarter. Therefore, it is not always possible to compare different carriers based on their performance for specific destinations.
No KPIs calculated
5 performances are only calculated quarterly. A detailed explanation of the current process of updating KPIs can be found in Chapter 2: Current situation.
No data on unknown carriers
The problem of finding the performance of an “unknown” carrier, a carrier that was not contracted in a quarter, is more complicated. There are two reasons why no data is available on these carriers. Firstly, because the free data is difficult to collect. The data required to get KPIs like on-time performance or booking response time is spread across many websites and sources, while the KPIs must still be calculated from this data. Collecting this data manually is time-consuming and vulnerable to mistakes, as a lot of data needs to be collected to produce a reliable performance.
Secondly, other data of “unknown” carriers is not accessible because the LSP does not have access to paid performance data, which is easier to collect. Several websites offer a subscription where it is possible to see performance data of carriers on route and vessel levels.
1.5 The core problem
The problems, which cannot have another cause, chosen to be solved in research can be identified as core problems (Heerkens et al., 2017). There are six candidate core problems visualized in the problem cluster:
- Uncertainty in logistics - No subscription on paid data - Data is spread over a lot of sources - A lot of data must be collected - Data collection is a manual process - Updating KPIs is a manual process
When assessing the problem cluster, three candidate core problems can be recognized. Three other problems are not solvable, as uncertainty in logistics like the weather cannot be solved. Furthermore, it is not desired to change the number of data sources and the amount of data that has to be collected. Reducing one of these two will either limit the amount of KPIs or will make the KPIs less reliable with fewer data points.
Heerkens advices to keep the number of core problems to a minimum, as it could lead to half-solved problems (Heerkens et al., 2017). This is especially relevant when considering the limited amount of time that is available for this bachelor thesis, namely ten weeks. Therefore, the core problem that is solved in this research is:
In this study, a solution will be developed that solves the core problem. This dissolves the problem of not having up-to-date performance information based on historical data of contracted carriers. This solution allows for carrier negotiation and selection based on performance. The performance data can furthermore be used for the booking of shipments and sharing of performance information.
The other two candidate core problems will be addressed as well, but are not be solved in this research. Having performance information of “unknown” carriers allows the LSP to compare more carriers on the same route and improve the performance of contracted carriers by selecting the best one. Additional
6 research will be conducted into possible sources for this extra data, but this data will not be collected due to the time restriction of this research. In the future, this extra data can be merged with the already available data in the LMS, to improve the amount of carrier data available for each destination.
1.6 Relevance of the problem
The LSP wants more insight into the performances of ocean carriers. By solving this problem, the LSP can save money and time by selecting better carriers. Time is saved because fewer problems occur during transport and the money is saved in avoiding delays and fines. Furthermore, the customers are content, as more orders arrive on time and performance information of their orders is actively shared. These advantages make it attractive and cost-saving for the LSP to solve the lack of performance information in the information sharing, order booking, and carrier selection processes. Therefore, the problem that is solved in this research is highly relevant to the LSP.
Additionally, the research is relevant for the University of Twente and TKI Dinalog, as research is done into ocean carrier performance and the visualization of these performances. This visualization of KPIs aims to help the LSP, or similar SMEs, in selecting the best performing carriers based on automatically calculated KPIs, to improve their competitiveness. In Chapter 8, a general framework for the visualization and evaluation of carrier performance is described, which was based on the case study performed for the LSP.
1.7 Methodology & Research Questions
The main goal of this research is to allow the LSP to make a well-reasoned decision in selecting the right carrier to improve the on-time performance and customer satisfaction. Therefore, the main research question is:
The main research question is split into several sub-research questions which will help to answer the main research question. The derived sub-questions and the chapters where they are addressed are described below.
In order to systematically solve the occurring problem, the steps of the Design Science Research Methodology (DSRM) will be followed (Peffers, Tuunanen, Rothenberger & Chatterjee, 2007). This approach was chosen over the Managerial Problem-Solving Method (MPSM) (Heerkens et al., 2017) because one of the deliverables is a prototype. The DSRM is focused on research which delivers a prototype and validating this prototype afterwards. Despite the use of the DSRM, the steps and elements of the MPSM will be kept in mind during this research.
Which KPIs are valuable in evaluating an ocean carrier
’s
performance, and how can these KPIs be
visualized to give a Logistic Service Provider insight into carrier performance?
7 Phase 1 Identify problem
In the first phase of the DSRM, the research problem is defined. Relevant problems and its relations are visualized by means of a problem cluster. Furthermore, the current processes are visualized by means of a BPMN model to gain more background understanding. To successfully visualize the current situation, the following sub-research questions were formulated:
1. What is the current situation?
1.1. What does the current carrier contracting process look like? 1.2. What does the current shipment planning process look like? 1.3. What does the current KPI calculation process look like?
Phase 2 Define the objectives of a solution
In phase 2 the desired situation is described. The objectives of the research and the objectives of the LSP are formulated. Additionally, literature research will be done into KPIs and data analysis, MCDA and dashboards to gain the knowledge to implement the solution successfully. The research questions in this second phase are:
2. Which existing KPIs can express the performance of ocean carriers?
2.1. Which of these KPIs can be calculated with available or easily collectable data? 2.2. How to gather and manage the required KPI data?
3. Which MCDA tool can be used to rank carriers based on their performance? 4. How to develop a dashboard for the selected KPIs?
5. Where could additional carrier performance data be gathered from?
Phase 3 Design & Development
In the 3rd phase, the prototype is developed. Before the development, the solution design of the prototype is drawn up in consultation with the LSP and CAPE. Based on the solution objectives, the prototype is developed in several sprints.
6. What will be the solution design of the prototype?
6.1. Which KPIs does the LSP want to use in the carrier comparison? 6.1.1.Which data is required for those KPIs?
6.2. What are the requirements for the prototype?
Phase 4 Demonstration
After the prototype is developed, it will be presented to the stakeholders. After the demonstration, it will be tested on its functionalities and efficiency in phase 4 of the DSRM.
Phase 5 Evaluation
In phase 5 the prototype and its functions are evaluated. Does the solution, which is implemented in the prototype, indeed reduce the number of delayed shipments? The calculated indicators are compared with the base values to calculate the improvements.
Phase 6 Communication
8 the steps to be taken to visualize the performance of logistic carriers. This proposed framework is addressed in Chapter 8.
1.8 Scope
Because the time of conducting this research is limited to ten weeks, not all the findings and solutions can be implemented. Therefore, it was chosen to only advice on the collection of extra data for carrier performance. Selecting such a source and collecting, implementing and calculating performances with this data, would take more time than the scheduled ten weeks. Hence, the focus will only be on visualizing the performances, and not on improving processes related to these performances, although certain processes can be improved through automation.
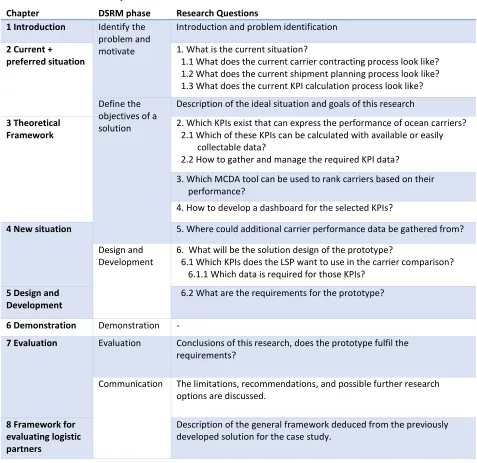
1.9 Structure of the report
Chapter DSRM phase Research Questions
1 Introduction Identify the
problem and motivate
Introduction and problem identification
2 Current + preferred situation
1. What is the current situation?
1.1 What does the current carrier contracting process look like? 1.2 What does the current shipment planning process look like? 1.3 What does the current KPI calculation process look like?
Define the objectives of a solution
Description of the ideal situation and goals of this research
3 Theoretical Framework
2. Which KPIs exist that can express the performance of ocean carriers?
2.1 Which of these KPIs can be calculated with available or easily
. collectable data?
2.2 How to gather and manage the required KPI data?
3. Which MCDA tool can be used to rank carriers based on their . performance?
4. How to develop a dashboard for the selected KPIs?
4 New situation 5. Where could additional carrier performance data be gathered from?
Design and Development
6. What will be the solution design of the prototype?
6.1 Which KPIs does the LSP want to use in the carrier comparison?
. 6.1.1 Which data is required for those KPIs?
5 Design and Development
6.2 What are the requirements for the prototype?
6 Demonstration Demonstration -
7 Evaluation Evaluation Conclusions of this research, does the prototype fulfil the requirements?
Communication The limitations, recommendations, and possible further research options are discussed.
8 Framework for evaluating logistic partners
[image:19.612.70.547.236.699.2]Description of the general framework deduced from the previously developed solution for the case study.
9
2 Current and preferred situation
In this chapter, research question 1: “What is the current situation?” and its sub-questions are answered. The current situation of carrier contracting together with the updating of KPIs, and the shipment planning process are explained and modelled in the BPMN in sections 2.1.1 and 2.1.2 respectively. Preceding research, which was done by Rasing in 2018, is addressed shortly, as the designed solution can make use of the performance visualized in this research. Consecutively, the ideal situation for the LSP is addressed and goals for this research are determined.
2.1 Current processes
2.1.1 Carrier contracting process
Before each quarter, carriers are contracted to ensure the best price for the shipments that are booked in each quarter. The LSP sends out a list with the forecasted number of containers to be shipped on each lane to every carrier. The carriers decide on which Shipping Lanes they want to return a price proposal. When the proposals of every carrier are received, a carrier is chosen for every Shipping Lane by an employee of the LSP. Carriers are contracted based on their proposed price and general feeling on performance by the planner of the LSP. The price is at this moment the only factor that can be objectively used for carrier comparison.
When looking back on past quarters, a lot of shipments did not arrive according to schedule. This conclusion was made based on quarterly dashboards and the significant length of time employees are busy with delayed shipments. The up-to-date carrier performance is unknown since these dashboards are not made frequently and are only used for reporting purposes. The detailed current carrier contracting process can be found in Appendix B.
Research by Rasing
Research was done into the carrier contracting process of the LSP by Rasing (2018). This study produced a prototype version within the LMS, where the carrier contracting process was optimized. However, this prototype is still in the development phase and is not used until fully completed and tested. In this research, the number of steps to be taken to choose a preferred carrier was reduced. Also, the time it takes, and the possibilities of mistakes were reduced as the process was automatized. Furthermore, Rasing made it possible to use performance KPIs in the carrier selection process.
To demonstrate the possible use of KPIs in the carrier contracting process, Rasing developed the possibility to upload performance KPIs into the LMS. In total, 4 KPIs that were available in the Excel dashboard, were calculated based on data from Q1 2018 and uploaded into the LMS.
The LSP plans on implementing the newly designed process by Rasing. However, it is already known that the KPIs will not be used as demonstrated in the prototype. This calculation only consists of data in a single quarter and takes too much time to calculate. Calculating these KPIs and using them in carrier selection
was not the aim of Rasing’s Research. Therefore, getting insight into actual carrier performance through calculating KPIs takes a lot of time, involves a lot of manual steps, and requires the use of the Excel dashboard made by the LSP.
Updating KPIs
10 manually. For example, when the actual time of arrival is missing, the KPI on-time performance cannot be calculated. Each quarter, more than 2100 orders are created and shipped. It takes a lot of time to perform all these checks manually. When each order must be checked on mistakes before a KPI calculation can be performed, a lot of time is lost.
If the order is checked, the KPI calculation can be made in the dashboard. When all the KPIs are calculated, the different KPIs could be exported back into the LMS. When exported back into the LMS, the employee of the LSP can view the KPIs and use them in the carrier contracting and order planning processes.
2.1.2 Shipment planning process
Orders from Company X are sent to the LMS of the LSP. When an order is received, the planner of the LSP will look for a suitable sailing. Basic information, such as the port of delivery and preferred arrival time, is already filled in by Company X. Usually, the planner will look for a sailing with the contracted carrier that fits within the timeframe. Only if booking the contracted carrier is not possible, then a sailing is booked at another carrier. When a sailing is selected, details of the sailing are sent to the carrier via a booking platform. The carrier will send back a booking confirmation when the booking is accepted. The shipment planning process is modelled in Appendix A. Further steps taken in the shipment planning process, such as cold store planning, are not relevant in this research and are thus left out of this report.
2.2 Ideal situation
The LSP wants to have a selection of relevant KPIs available in the LMS for all ocean carriers. With these KPIs, ocean carriers can be evaluated on their performance for different destinations and against other carriers. The aim of the LSP is to contract carriers based on their complete performances and not only on price, which is currently the only criterion.
These selected KPIs must be updated regularly to ensure that the KPIs are valid and up-to-date. These calculated KPIs can be used in several situations. One of the objectives is choosing the best performing carrier on each route. Therefore, data from carriers where the LSP does not work with at this moment should be available in the LMS as well. Only when all the possible carriers can be evaluated based on their performance, a well-reasoned carrier selection can be made.
The LSP aspires to use the performance KPIs in various other situations when the performance data becomes available. Performance information will be shared with customers to provide insight into performance of different carriers. In contract negotiations, carriers can be asked to explain why the promised performance was not achieved.
Furthermore, having a large selection of data available in the LMS provides opportunities for the LSP to improve the forecasts of Transit Times and ETAs with data analysis and machine learning. A first step would be giving planners advice in booking shipments. Advising a planner to book a shipment a week earlier when a carrier is always seven days late is an example of such an advice. Providing insight into carrier performance can be seen as the first step towards shipment recommendations or even the automatic selection of carriers, which is one of the goals of the LSP in the future.
2.3 Goals
11 with the focus on carrier selection. The literature research into these KPIs can be found in Chapter 3: Theoretical Framework.
The first goal is to make the process of updating KPIs automatic, instead of the now manual process and use of Excel. These automatic updates in the LMS will make sure that the KPIs are up-to-date and can be easily used in multiple processes. No more manual steps are needed to retrieve performance information, which is time-consuming and vulnerable to mistakes.
All the available and freshly calculated KPIs should be available in the Logistic Management System of the LSP. A prototype will be created, where the automatic updates of the KPIs are implemented. The KPIs will be visualized in a dashboard, where they can be filtered based on several restrictions. The functionalities and appearance of the prototype were determined after consultation with the LSP and CAPE and can be found in Chapter 5: Design and Development.
When the KPIs are available in the LMS, they can be used in multiple processes of the LSP. These processes include, but are not limited to, Carrier selection, shipment planning, and information sharing with customers. For valid and reliable KPI calculations, research will be done into data management, which can be found in Chapter 3.2: Data management.
Besides the historically available shipment data, the LSP wants data on carriers where they did not ship with in a quarter. This data will not be part of the prototype, but possible options where this data can be collected from will be given. In total, the four most relevant options will be investigated in Chapter 4, where both the advantages and disadvantages of each option are discussed.
2.4 Measurability
The core problems must be measurable to evaluate if the developed solution is an improvement on the current situation (Heerkens et al., 2017). Having carrier performance available in the LMS is a large improvement on the current situation where performance is only available in the quarterly dashboards. The presence of performance data does not show whether current processes are improved. For this reason, improvements will be measured in several other ways.
First, the number of criteria on which an employee selects a carrier is improved. At this moment, it is not known how many KPIs will be in the prototype and therefore the number of assessment criteria is also unknown. However, every criterion that is added to the LMS is an improvement on the current situation, as there are no KPIs available in the LMS.
The time it takes to get and calculate the performance of a carrier will be reduced. Instead of at least five hours of data gathering, processing and analyzing, the performance KPIs will be automatically calculated. This process can take some time but is done automatically without the involvement of humans.
Additionally, the time between two calculations of performance KPIs will be reduced from one quarter to preferably a single day. And lastly, the amount of data available for KPI calculations will be increased. The quarterly calculated dashboards only contain data of shipments in the last three months. Some destinations do not have any or only a small amount of orders in a quarter. Using older data can improve the reliability of a carriers’ performance for such a destination.
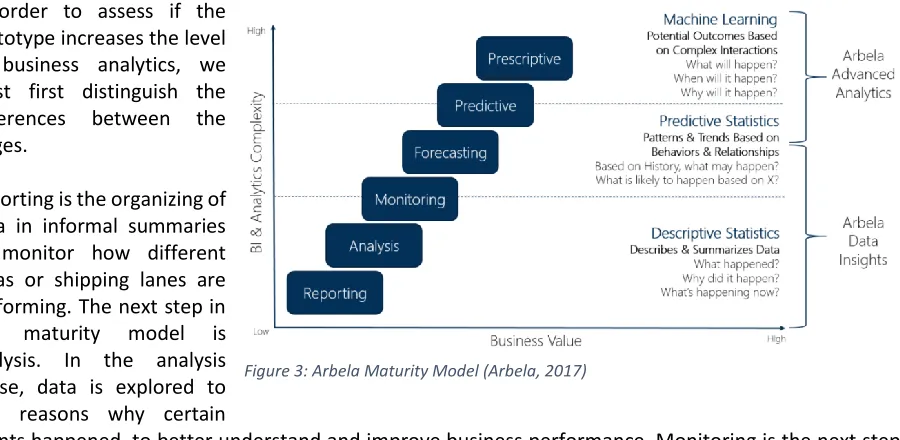
12 in costs saved. These costs savings could be determined after using the dashboards for carrier contracting. However, the results are only evident after a quarter. Another way to measure improvements is the use of a maturity model to determine the level of Business analytics. Arbela has created a simple and accurate overview of all the levels of Business intelligence, based on the first maturity model developed by Wayne Erickson.
In order to assess if the prototype increases the level of business analytics, we must first distinguish the differences between the stages.
Reporting is the organizing of data in informal summaries to monitor how different areas or shipping lanes are performing. The next step in the maturity model is analysis. In the analysis phase, data is explored to find reasons why certain
events happened, to better understand and improve business performance. Monitoring is the next step, which is keeping track of current performance. Forecasting is estimating future events based on past and present data, and thus requires the previous steps of reporting and monitoring.
Predictive statistics uses data mining and probability to estimate more specific outcomes. For example, forecasting estimates the number of customers for the next quarter, whereas predictive modelling could more specifically identify customers who are likely to buy the product. Prescriptive analysis goes even further and suggests decisions that will reduce the risk or maximize the return of each decision.
The current Excel dashboards are best classified as reporting analytics. Every quarter, a dashboard is calculated where the general performance of carriers is visualized. In the ideal scenario, the LSP would like to use machine learning to automatically and accurately predict ETAs and other relevant information, which is the 6th level of the Arbela maturity model.
Quarterly dashboard Preferred
Number of KPIs available 4 Depends on result literature research Time between the
updating of performance
Quarter Day
Time to update KPIs 5 hours No human involvement Data availability Last quarter All Time
[image:23.612.88.538.153.373.2]Maturity model level 1 6 (Not possible within this research) Table 3: Evaluating the improvements in the prototype
13
Chapter 3: Theoretical Framework
In this chapter, research questions 2, 3, and 4 will be answered in sections 3.1 and 3.2, 3.3 and 3.4 respectively. The findings and answers will be used to create a prototype in the LMS, where KPIs are visualized and analyzed to provide useful information for the LSP. This prototype will be further explained in chapter 5: Design and development.
3.1 KPIs for evaluating ocean carriers
A LSP is evaluated primarily based on their price and shipment performance. Therefore, an LSP wants to contract the carrier that has the best balance between price and performance. KPI measure a strategic objective against a set goal (Turban et al., 2010), which provide a means to compare the performance of different carriers. Selecting and comparing suitable KPIs for assessing carriers, will help the LSP to contract the best carrier on each route. Therefore, the research question ‘Which existing KPIs can express the
performance of ocean carriers?’ is answered in this section through a systematic literature review. The steps taken in the search and the in- and exclusion criteria can be found in Appendix D: Systematic literature review.
3.1.1 Filtering KPIs
There is a large number of KPIs available in the literature that can express the performance of transport companies. However, not all these KPIs are useful for an LSP to assess the performance of an ocean carrier. For example, the LSP is not interested in the capacity utilization of a vessel and overtime hours of employees.
Besides these KPIs, there is also a number of KPIs where no data is available for, as carriers want to keep them classified. Examples of such KPIs are profit margins and cost levels. In most of the conducted studies, all these KPIs are mixed together as they are focused on evaluating carriers. Only the relevant KPIs for LSPs were selected and gathered from the different sources. A list of all KPIs can be found in Appendix F: Complete list of distinct KPIs for carrier performance.
3.1.2 Structuring KPIs
There are many KPIs available to evaluate carriers or logistics and as not all KPIs are relevant for an LSP, it is of great value to structure the KPIs into an understandable overview. Krauth et. al (2005) developed a framework in the area of third-party logistics with different points of view on a company’s performance.
The KPIs are grouped into four perspectives: Internal Management, Internal Employee, External Customer and External Society. The perspectives were created because of the different points of view stakeholders have on different KPIs. For example, management wants the shipping price to be as high as possible to maximize profit, in contrast to the customer, who wants the lowest price to reduce costs.
In the case of the LSP, the customers point-of-view is most important. The LSP can be seen as a customer of the carrier and want to improve the performance for their own customers. Also, the management and society perspectives are looked at, as some of these KPIs are relevant for the LSP. An example of these perspectives is the level of sustainability from the social viewpoint. In contrast, no useful KPI for carrier evaluation was found in the employee’s perspective. Thus, the employee’s perspective is left out of the created table.
3.1.3 Selecting KPIs
14 Appendix, the KPIs are structured according to their perspective and source. A list of distinct KPIs is documented in Appendix F,where the availability of the data and the possibility to collect additional data is included as well.
When contracting a carrier, the LSP wants a selection of the most relevant KPIs calculated, to evaluate the overall performance. The LSP is limited by the data that is available in their application or data that is collectable from other sources. A handful of KPIs was removed, as no data was available. In consultation with the LSP, six KPIs were selected and will be used in the prototype dashboard, which can be found in Chapter 4: New situation.
3.2 Data management
After the KPIs have been selected data must be gathered and managed in order to be able to calculate the chosen KPIs. Chaudhuri et al. (2011) describe the process of integrating, cleansing and standardizing data as rather challenging. Efficient use of valid and reliable data is essential for Business intelligence. The data will be updated regularly and need to be quickly aggregated when restrictions on destinations and time periods are set in the dashboard.
3.2.1 Data gathering
The data used in the calculation of the selected KPIs are already structured and available in the LMS. In the future, it is likely that additional data will be collected from various sources, as the LSP wants to have data on carriers that were not contracted. This data is not directly available in the LMS and must be collected from another website. In contrary to the LMS, the data quality of these external sources can vary. The different sources can use their own representations, codes and formats, which needs to be changed to fit the data in the LMS. Possible sources where carrier performance data can be gathered from are listed in Chapter 4: New situation. When the source for the additional data is selected, it must be checked on the previously mentioned possible problems and integrated with the data in the LMS.
3.2.2 Data structure
The LSP saves data of all orders in the LMS where it is structured into a Mendix domain Model. In Figure 4, a simplified domain model is shown. This domain model is, like most modern-day business applications, a
structured data representation of a set of entities which are related to one another (Loshin, 2013). The data is stored in a database where every entity is a separate table. The entity Customer consists of several attributes as the customer has a Name and an Address. All the entities are linked together through relationships, or in Mendix called associations.
3.2.3 Data quality
When data is used from external sources, errors could occur through inconsistent representations for the same value and missing values. In the LMS the data is well structured through the domain model. However, it is still possible for data to be incorrect or missing. Therefore, the data must be checked before it can be used in KPI calculations or data analysis processes. It must be kept in mind that the quality of the data might be sufficient for one situation but not for the other (Olson, 2003). More specifically, When the ATA of a shipment is missing, the Bill of Lading performance could still be calculated, but the on-time performance of the shipments cannot.
15
3.2.4 Data cleaning
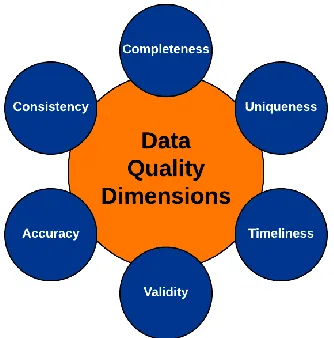
In order to ensure the quality of data used for the performance calculations, data cleaning activities must be performed. Data cleaning is the process of removing or modifying data in the database that is incorrect, incomplete, improperly formatted, or duplicated (Rouse, 2010). Using the 6 data quality dimensions, developed by DAMA (2013), the quality of the data can be checked and endorsed.
The quality requirements for each company vary but can be categorized into the following categories: Completeness, Uniqueness, Timeliness, Validity, Accuracy and Consistency (DAMA, 2013). The Completeness dimension checks how many empty fields (or null values) are present in an attribute. When calculating with empty or null values the results can differ from reality or produce errors as empty values cannot be calculated with. The uniqueness check verifies whether all things are only recorded once in the database. An example is the difference between Maersk, Maersk Line and A. P. Moller-Maersk, as they are still the same shipping company. The timeliness dimension assesses the time taken between an occurrence of the situation and the event being stored in the system (Batini & Scannapieco, 2006). The data is more likely to be incorrect, the longer it takes to save it in the system.
The data is valid if it is consistent with the predetermined
format, type and range. With the accuracy check, the data is checked whether it describes the real objects or events (Batini & Scannapieco, 2006). An example is whether there are any spelling mistakes, wrong data formats or not current data values. And lastly, the consistency dimension checks whether two or more representations are the same in different data sets, so that they can be easily linked with each other.
When conducting cleansing activities, every critical data item that is used should be checked with the selected data quality dimensions and their determined values or ranges. The dimensions and restrictions used for the prototype can be found in Chapter 5: Development of the Prototype.
After determining and checking the data on the 6 quality dimensions, the decision must be made of what to do with the data that did not pass the determined requirements. There are three main approaches to take care of this data: Listwise deletion, Pairwise deletion and predictive replacement (Cooper & Schindler, 2013). In listwise deletion cases with missing a variable are deleted, whereas pairwise deletion uses all the cases with no missing data to create an estimation and use it as a replacement for the missing value. Predictive replacement uses a prediction form observed values on another variable as a replacement.
Deleting the data that is not complete or valid can only be safely done if the missing data occurs at random. When data is missing systematically and still deleted, the calculated KPIs could be biased.
[image:26.612.366.533.169.338.2]As the used data is already structured according to the domain model, several potential problems are already addressed in Mendix. Each variable has a type property which for example prevents an integer to contain letters. Additionally, each attribute in the domain model can have validation rules, which declare the range, uniqueness or expression of the attribute. At this moment, not all variables that are used in the performance calculations, have all the required validation rules to ensure the data quality. The validation rules, which are created for the used attributes, are listed in Appendix J: Data used
16
3.2.5 Data filtering
Data filtering is the process of refining data sets to the needs of the user, such that repetitive, irrelevant or sensitive data are excluded. The reduced size of the data used will also improve the processing time of the queries. In the instance of the LSP, every order is only present once in the LMS. Therefore, data filtering is not required in the processes of the LSP. Some orders do not contain the required data that is necessary for the calculation of any KPIs. Those orders will not be deleted but are excluded from the KPI calculations.
3.3 Multi-Criteria Decision Analysis
In multiple criteria decision analysis (MCDA) multiple alternatives are evaluated based on a number of criteria that are in interference (Kumar et al., 2017). For example, most of the time the lowest price does not go together with the best performance. The LSP wants to make a well-balanced decision for carriers on each route, and therefore an MCDA method will be selected to rank the ocean carriers based on the selected KPIs. One of the requirements that was set for the prototype by the LSP, was that priorities of the different KPIs are likely to change in the future. As the dashboard will be frequently used in the future, the LSP wants to be able to change the importance of each KPI when desired. This requirement already limits the amount of MCDA methods, as pairwise comparisons are difficult to implement into the LMS of the LSP.
The initial selection of MCDA methods was determined using the website mcda.it, which filters MCDA methods based on decision weights, comparison scales, uncertainty and decision problematics. These criteria were the result of a study, which collected a large number of MCDA methods and categorized them in a decision tree (Watróbski et al., 2018). This research is especially helpful in narrowing down suitable MCDA methods, as there is a large number of MCDA methods, which appear to be identical at a first glance.
From the results, two possible methods that are applicable in this use case are discussed. Besides these methods, the WSM method is discussed as well. In Chapter 5: Design and Development, a method is chosen and implemented in the prototype design.
3.3.1 Weighted Sum Method (WSM)
The weighted sum model (WSM) is the simplest and best-known MCDA method for evaluating several options on a number of criteria (Figueira, Greco & Ehrgott, 2005). For every criterion, a weight is determined to distinguish their importance relative to each other. Then the score of an option is multiplied by the weight and added up. It is important to note that when using the WSM method, all the scores must be expressed in the same unit and preferably the same scale.
3.3.2 VIKOR method
The VIKOR method looks for the closest option to an ideal situation and was developed by Serafim Opricovic. The method produces a compromise ranking list based on given weights for each criterion. First, the best and worst value are determined for every single criterion. then, values are computed, weighed and normalized, in order to be able to rank the different alternatives. The result is a sorted list, which is based on the maximum utility and lowest regret. The maximum utility concept can be explained as the greatest outcome for the least amount of money (Chatterjee & Chakraborty, 2016).
3.3.3 TOPSIS method
17
to represent to closeness to the ideal situation, the TOPSIS method’s solution is an outcome with the
shortest Euclidian distance from the best situation and the farthest from the worst situation (Lai, Liu & Hwang, 1994). The performances are first normalized and multiplied by the weight of the specific criteria. Then, the best and worst criteria are determined for each criterion. The Euclidean distance, basically a straight line between points, is then determined between the alternative and the best and worst alternative. Then the final performance score is calculated by dividing the distance to the worst performance, by the sum of the distance to the best and worst performance. The alternatives are ranked based on the performances scores.
3.4 Dashboards
When developed correctly, dashboards can give users a powerful means to present information. However, poor implementations account for a large number of dashboards to be ineffective and inefficient (Few, 2006). Poor choice of graphs, dimensions, design and colours all have a negative impact on the effectiveness of the dashboard. Cahyadi and Prananto (2015) concluded after a literature review, that a dashboard could be broken down into 6 components. In order to develop a good dashboard, these components must be well-understood. The prototype created in this research will be build based on these 6 components.
Data is the first component addressed by Cahyadi and Prananto and consists of the three design elements data warehouse, database systems and data quality. What information is required to show the selected performance indicators? Furthermore, it is key to understand where that data is coming from and where it is stored. Moreover, how good is the quality of the data? Is the data incomplete or are the values false? The data component and its issues were previously discussed in section 3.2 Data management. The steps taken in the data management process of the prototype can be found in chapter 5.
The Technologies component addresses the platform the dashboard is built upon, system architecture, software and information systems used. Which software is going to be used and how is the data linked to the dashboard?
Knowing the dashboard User is a key component of developing a dashboard. Who will view the dashboards in day to day operations? What is the user supposed to see, and what are his preferences when using the dashboard? Does the user have a lot of background knowledge, or does the dashboard require extra explanation?.
What does an Organization want to achieve with their dashboard? What are the requirements of the dashboard and which types of employees will use the dashboard? Few (2006) has defined 3 types of dashboards that support the different business activities: Operational, Strategic and Analytical. An operational dashboard is used multiple times per day, and updated very frequently, as they monitor progress towards a goal. A strategic dashboard is used less often. It is mostly a reporting tool to monitor the status of KPIs. It is not required to update the data as often as operational dashboards. Lastly, the analytical dashboards are mainly developed for and by data analysts. The goal is to analyze large volumes of data to investigate trends, predict outcomes, and discover insights
18
Graphs and Metrics are about the user interface and metrics selections. Which types of graphs will present the selected performance indicators in a clear way? How can the graphs be organized in a structured way? Additionally, how can the selected graph immediately show the performance?
One important element of dashboards is not part of these 6 components. Therefore, another component is added to this research: Aesthetics. Aesthetics do certainly play an important part in the effectiveness of dashboards. One of the important characteristics of aesthetics is choosing the right colour scheme. The selected colours should be in alignment with the message that the graph is showing (Bhatt, Aggarwal & Sharma, 2017). Typography, choosing the right font and font sizes, and the layout is are key elements of
19
4. New situation
Before a specific solution is designed for the identified problems, it is important to gather the requirements of the LSP for the solution. What functions should be implemented, and which KPIs should be available in the solution. In consultation with the LSP, the performance KPIs were determined based on the literature research and a list of requirements for the prototype was made. The selected KPIs, which are the answer
to research question 6.1: ‘Which KPI does the LSP wantto use in the Logistic Management System”, are
discussed below in part 4.1. whereas the requirements set for the prototype can be found in chapter 5.1: Prototype requirements. Additionally, research was conducted into the collection of additional data, which can be found in chapter 4.2. This research answers research question 5: “Where can additional carrier performance data be gathered from?”.
4.1 KPI Selection
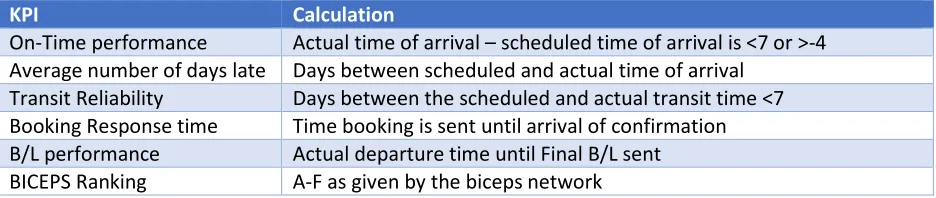
The systematic literature review produced a large number of KPIs that could be used to evaluate carrier performance. In consultation with the LSP, a selection of 6 KPIs was made which will be implemented in the prototype. This selection was based on KPIs that were most important for the LSP, like on-time performance. Furthermore, some KPIs could not be calculated as data is unavailable, or the effect of the KPIs was of minimal impact on the processes of the LSP. For example, the number of complaints about damage to shipments was at most 3 claims per carrier per year. The limited number of claims made the KPI irrelevant for carrier comparison. Similarly, a seventh KPI, the number of booking rejections was selected at first, but did not occur often enough to have any impact on the processes of the LSP. The list of data, which is required for calculating the KPIs, and provides the answer to research question 6.1.1, can be found in Appendix J: Required data.
4.1.1 On-Time performance
No general consensus exists in logistics for shipments to be considered ‘on-time’ or ‘late’. Even in the
ocean shipping industry, different companies use their own definitions for orders to be ‘on-time’. The LSP defines orders as ‘late’ when they arrive 7 or more days after their scheduled time of arrival. Furthermore, an order should not arrive more than 4 days before the scheduled time of arrival. Orders that do arrive
more than 4 days before the STA are also considered to be ‘late’ although they are technically early. As
shipments are rarely early, they are added to the list of ‘late’ shipments for simplification.
4.1.2 Average delay
The average delay KPI aggregates the delays of all orders. The LSP has defined 3 different stages of delay for their shipments. If shipments arrive less than 4 days late, they are considered to be ‘on-time’ and no
action is taken. If orders arrive between 4 and 7 days after ETA, they are still marked ‘on-time’, but an
automatic update is sent to the customers to inform them of the delay. Only if an order arrives 7 or more
days late, an order is marked ‘late’ and an employee of the LSP undertakes action. The respective carrier
KPI Calculation
On-Time performance Actual time of arrival – scheduled time of arrival is <7 or >-4 Average number of days late Days between scheduled and actual time of arrival
Transit Reliability Days between the scheduled and actual transit time <7 Booking Response time Time booking is sent until arrival of confirmation B/L performance Actual departure time until Final B/L sent
[image:30.612.72.540.402.501.2]