Original citation:
Pasini, Martina, Fernández-Castané, Alfred , Jaramillo, Alfonso, de Mas, Carles ,
Caminal, Gloria and Ferrer, Pau. (2016) Using promoter libraries to reduce metabolic
burden due to plasmid-encoded proteins in recombinant Escherichia coli. New Biotechnology, 33 (1). pp. 78-90.
Permanent WRAP URL:
http://wrap.warwick.ac.uk/71872
Copyright and reuse:
The Warwick Research Archive Portal (WRAP) makes this work by researchers of the University of Warwick available open access under the following conditions. Copyright © and all moral rights to the version of the paper presented here belong to the individual author(s) and/or other copyright owners. To the extent reasonable and practicable the material made available in WRAP has been checked for eligibility before being made available.
Copies of full items can be used for personal research or study, educational, or not-for-profit purposes without prior permission or charge. Provided that the authors, title and full bibliographic details are credited, a hyperlink and/or URL is given for the original metadata page and the content is not changed in any way.
Publisher’s statement:
© 2016, Elsevier. Licensed under the Creative Commons
Attribution-NonCommercial-NoDerivatives 4.0 International http://creativecommons.org/licenses/by-nc-nd/4.0/
A note on versions:
The version presented here may differ from the published version or, version of record, if you wish to cite this item you are advised to consult the publisher’s version. Please see the ‘permanent WRAP URL’ above for details on accessing the published version and note that access may require a subscription.
Using promoter libraries to reduce metabolic
burden due to plasmid-‐encoded proteins in
recombinant
Escherichia coli
Martina Pasini
1, Alfred Fernández-‐Castané
2, Alfonso Jaramillo
3,4, Carles de Mas
1, Gloria
Caminal
5, Pau Ferrer
11 Department of Chemical Engineering, Escola d’Enginyeria, Universitat Autònoma de Barcelona,
Bellaterra (Cerdanyola del Vallès), Spain
2 School of Chemical Engineering, University of Birmingham, Edgbaston (Birmingham), UK
3 School of Life Sciences, University of Warwick, Coventry CV4 7AL, United Kingdom
4 Institute of Systems and Synthetic Biology, Université d’Évry Val d’Essonne, CNRS, F-‐91000 Évry,
France
5 Institute of Advanced Chemical of Catalonia, IQAC−CSIC, Spain
Key words: Synthetic Biology, Golden Gate, recombinant protein production and Escherichia coli
Abbreviation: FucA, L-‐Fuculose phosphate-‐aldolase; SHMT, serine hydroxymethyl transferase enzyme.
Abstract
The over-‐expression of proteins in recombinant host cells often requires a significant amount of resources causing an increase in the metabolic load for the host. This results in a variety of physiological responses leading to altered growth parameters, including growth inhibition. Moreover, the expression of other plasmid-‐encoded genes such as antibiotic resistance genes or repressor proteins may also alter growth.
system to the FucA over-‐production, showing increased production levels.
Our results showed that the aforementioned approaches are of paramount importance in order to increment the protein production in terms of mass and activity.
Acknowledgements:
This work was supported by the project “Novel Alternatives for Microbial Production of Enzymes and Multienzymatic stereoselective Synthesis (EnzProSyn)”. M. P. acknowledges the Universitat Autònoma de Barcelona for the pre-‐doctoral grant.
Authors’ contributions
MP: Performed all experiments, acquisition and analysis of all the data, as well as in drafting of the manuscript. AFC: Contributed to the conceptual design of the study and manuscript editing. AJ: Involved in the design of constructs and manuscript edition. CdM, GC and PF: Contributed to the overall conceptual design of the study and data interpretation, as well as in drafting and revision of the manuscript. All Authors read and approved the manuscript.
1
Introduction
Among the many systems available, the gram negative bacterium Escherichia coli remains one of the most versatile and used host for the production of heterologous proteins, because of its rapid growth rate, the easiness to attain high cell density cultures on inexpensive substrates, its well-‐characterized genetics and the availability of excellent genetic tools (1). Efforts in developing strategies to maximize the productivity in E. coli are well documented in literature (2)(3). Extensive research has been performed over the past years in order to improve recombinant protein production in this cell factory, including the optimization of process parameters such as the growth temperature, the media composition, the induction conditions, as well as engineering the expression system (4).
In particular, thanks to the development of the synthetic biology, new methods and tools to speed up and standardize strain engineering have been established. Compared with conventional DNA cloning protocols, these advanced DNA assembly tools offer an efficient approach to construct multi-‐gene pathways in a one-‐step, scar-‐less, and sequence-‐ independent manner.
Specifically, collections of standard biological parts (BioBricks) allow for the fast assembly of new functions in many organisms (5). For example, individual parts or combinations of parts that encode defined functions can be independently tested and characterized in order to improve the expression system. Besides, parts or devices that do not function as expected can be readily modified or removed(6). DNA construction based on the BioBrick theory has become a key part of most metabolic engineering projects and genetic circuits design. The BioBrick concept exploits the advantage that the same promoters, ribosome binding sites, expression tags, antibiotic resistances and origins of replication are frequently reused, with only the genes of interest being varied (7)(8). Thus, with a series of standardized biological parts, researchers should be able to quickly assemble biological parts (bricks) into different biological functions, pathways and mechanisms.
coli has been proven to be an efficient platform for soluble overexpression of a wide range of aldolases, both endogenous and from other bacteria (13)(14). Initial FucA over expression studies in our laboratory were carried out when the gene fucA from E. coli K12 was cloned into a plasmid vector controlled by a Trc promoter (pTrcfucA) and overexpressed as a recombinant his-‐tag fusion protein (13). After that, Vidal et al. (15), switched to a commercially available expression system (Qiagen), consisting of the M15 strain and a two-‐plasmid system including the pQE40 expression vector, which uses the stronger T5 promoter. This system was used to overproduce a range of different aldolases, including a DHAP-‐dependent aldolase, the rhamnulose 1-‐phosphate aldolase (RhuA) (16). Moreover, this expression system was further evolved into an auxotrophic marker-‐based plasmid maintenance system by knocking out the glyA gene from the M15 prototrophic strain and by constructing a pQE-‐40 derived plasmid containing the auxotrophic marker gene (glyA) under the control of a weak constitutive promoter (17). The E. coli glyA gene encodes for the enzyme serine hydroxymethyl transferase (SHMT). This 46 kDa enzyme has two activities: i) threonine aldolase activity, which catalyzes the reversible interconversion between L-‐threonine and glycine plus acetaldehyde, and ii) serine hydroxymethyl transferase activity, which catalyzes the reversible interconversion between serine and glycine (18).
Previous studies have shown that the glyA-‐based antibiotic-‐free system of plasmid maintenance in E. coli is a promising alternative approach to the use of antibiotic selection markers. However increased SMHT levels might burden the cell’s metabolisms, which lead to a decrease in activity and specific productivity profiles compared to the original system. Furthermore, according to Glick (19), the biosynthesis of proteins is an energy intensive process and it is therefore not surprising that the overproduction of one or more foreign proteins encoded within the DNA may cause segregational instability, where it is often all or part of the foreign gene of interest that is deleted from the plasmid.
Moreover, the presence of a second antibiotic resistance marker in the second plasmid (pREP4), expressing the lacI repressor, impedes the achievement of an expression system completely free from the use of antibiotics. For these reasons, further studies to fine-‐tune the glyA and lacI expression levels and to eliminate the pREP4 plasmid are needed in order to overcome these limitations.
Despite the large diversity of existing DNA shuffling protocols for collecting variant gene libraries (20)(21), the golden gate method based on the type IIs restriction enzymes has been used for assembling the BioBrick vectors. This protocol allows the assembling of multiple DNA fragments into a plasmid by a single restriction-‐ligation reaction.
In addition, to completely avoid the presence of the antibiotic resistance gene, considered unacceptable in many areas of biotechnology by regulatory authorities (22), the expression system has been further engineered to be finally devoid of antibiotic resistance marker genes and tested for FucA production in shake flasks.
2
Materials and methods
2.1 Bacterial strain
In this work, the K12 derived strains E. coli M15 and M15ΔglyA have been used and were constructed as previously described (17). The strain E. coli DH5α has been used for expression vector engineering purposes, whereas the M15ΔglyA strain has been used for recombinant FucA
expression. Bacterial strains and plasmids used in this study are summarized in table 1. The strains were stored at -‐80°C in cryo-‐stock aliquots prepared from exponential phase cultures grown in Luria-‐Bertani (LB) medium.
Tabla 1 List of Escherichia coli strains and plasmids used
Strains and plasmids Characteristics Reference or source
E. coli
M15ΔglyA Deletion of the glyA locus of the chromosome (17) DH5α Cloning application Invitrogen
Vectors
pTrcfuc pTrc HisC vector with the fucA gene cloned Garcia-‐junceda et al., 1995 (13) pQE-‐FucA pQE-‐40 derived (QIAGEN) with fucA gene
cloned
This study pREP4 LacIq kanR Qiagen
pQEαβFucA pQE-‐FucA derived with fragment, containing the glyA gene, under P3 promoter transcriptional control
This study
pSB1C3_GG High-‐copy camR, used for BioBricks standard
assembly vector, carried the mCherry gene, with two BsaI restrictions sites with the two different overhangs.
Synth-‐bio group (group leader A. Jaramillo). Institute of System and Synthetic Biology (iSSB), university of Évry-‐Val-‐d’Essonne Genopole® (France)
pSB1C3_GG J231XX-‐lacI-‐glyA pSB1C3_GG derived with a library of promoter for lacI and glyA expression
This study
pQE-‐FucA_puzzle (J23110) pQE-‐FucA derived with insertion of the cassette (J23110-‐lacI-‐glyA) for lacI and glyA genes transcription
This study
pQE-‐FucA_puzzle (J23110) AmpR-‐
pQE-‐FucA_puzzle (J23110) derived without the
bla gene
This study
2.2 Molecular biology techniques
Plasmid and strain constructions. Plasmid DNA and DNA fragments were isolated or purified using PreYieldTM plasmid miniprep system and Wizard® SV gel and PCR clean-‐up system
(Promega) according to the manufacturer’s instructions. Restriction enzymes were purchased from Thermo Scientific and T4 DNA ligase from Roche. Transformation of E. coli DH5α, M15 and M15ΔglyA competent cells with the DNA ligation reactions was performed by electroporation using a GenePulser MXcellTM electroporator from Bio-‐Rad. Transformants were grown on LB-‐
agar medium plates containing the corresponding amount of antibiotic or on defined medium (DM)-‐agar plates. All the selected clones were confirmed by colony-‐PCR, single or double restriction digests and DNA sequencing.
were performed using the GoTaq® master mix (Promega). All the primers used are listed in Table 2.
Tabla 2 List of primers used in this study. The Tm, melting temperature in °C, and the size in pb are described.
Bases in bold represent the BsaI enzyme recognition site; underline bases represent the four different overhangs
used for this study; red bases indicate the RBS BBa_B0034 for the lacI gene and the green bases specify the RBS
J61100 for the glyA gene.
Name Sequence 5’-‐3’
Tm
(°C)
Size (pb)
FucA FW CGGTACGTGGATCCATGGAACGAAATAAACTTGCTCG 61 37 FucA REW GCTAGTCCAAGCTTCTCTTCAATTCGTAACCCATAGG 60 37 αβT FW GCTTGATCTCCGGAGTGAAGACGAAAGGGC 61 31 αβT REW CGTCCATGTCTAGAGGGCGGATTTGTCCTACTC 63 33 GG_lacI FW TTGGTCTCTTAGC2TCTAGAGAAAGAGGAGAAATACTAGGTGAAACCAGTAACGTTATACG 59 60
GG_lacI REW TTGGTCTCTTCCA3TTCAAGATCTTCACTGCCCGCTTTCC 61 39
GG_glyA FW TTGGTCTCTTGGA3GAAAGAGGGGACAAACTAGTATGTTAAAGCGTGAAATGAA 58 53
GG_glyA REW TTGGTCTCTCGCT4GATAACGTAGAAAGGCTTCC 58 33
PJ1_FW GCTAAGGATGATTTCTGGAATTC 59 23 PJ2_FW GCTAAGGCGGACTGCAGGAAGAC 58 23 PJ_REW TGGCCA CGATAACGTAGAAAGGCTTCC 60 27 J23100_FW TTGGTCTCTCGCT1TTGACGGCTAGCTCAGTCCTAGGTACAGTGCTAGC2TGAGACCTT
J23100_REW AAGGTCTCAGCTA2GCACTGTACCTAGGACTGAGCTAGCCGTCAAAGCG1AGAGACCAA
J23110_FW TTGGTCTCTCGCT1TTTACGGCTAGCTCAGTCCTAGGTACAATGCTAGC2TGAGACCTT
J23110_REW AAGGTCTCAGCTA2GCATTGTACCTAGGACTGAGCTAGCCGTAAAAGCG1AGAGACCAA
J23111_FW TTGGTCTCTCGCT1TTGACGGCTAGCTCAGTCCTAGGTATAGTGCTAGC2TGAGACCTT
J23111_REW AAGGTCTCAGCTA2GCACTATACCTAGGACTGAGCTAGCCGTCAAAGCG1AGAGACCAA
J23117_FW TTGGTCTCTCGCT1TTGACAGCTAGCTCAGTCCTAGGGATTGTGCTAGC2TGAGACCTT
J23117_REW AAGGTCTCAGCTA2GCACAATCCCTAGGACTGAGCTAGCTGTCAAGAG1CAGAGACCAA
The four promoters used (J23100, J23111, J23110 and J23117) in this study were selected from a small combinatorial library of constitutive promoters (Figure 1) (Registry for Standard Biological Parts, http//parts.igem.com). Each promoter was synthetized by oligonucleotide hybridization including two BsaI sites with 2 different overhangs at both, 5’ and 3’ terminus.
BsaI enzyme recognition site
RBS BBa_B0034 (http://parts.igem.org/Part:BBa_B0034)
RBS BBa_J61100 (http://parts.igem.org/Part:BBa_J61100)
Legend
1,2,3,4
PCR, agarose gel electrophoresis and DNA sequencing were performed to check all the cloning reactions. PCR verification of plasmid constructs was carried out using GoTaq® with the following PCR program: 95°C for 45 s, 55–58°C for 45 s, and 72°C for 0.5–3.5 min, for a total of 30 cycles and a final extension of 72°C for 5 min.
Fig. 1 A) The J23119 promoter series is a family of constitutive promoter parts isolated from a small combinatorial
library. J23119 is the wild type /wt) promoter sequence and the strongest member of the family. B) Reported activities of
the promoters are given as the red fluorescence protein (RFP) relative fluorescence (in arbitrary units, AU), pSB1A2 plasmid (Registry for Standard Biological Parts, http//parts.igem.org/parts: pSB1A2) in strain TG1 grown in LB media to saturation. The strength of the promoters goes from the weakest to the strongest, as the orientation of the green arrow on left hand side of the figure. The four promoters used in this study are marked with a green box (J23110, J23111, J23110, J23117).
2.3 Plasmid constructs
pQE-‐FucA: The commercial vector pQE-‐40 (Qiagen) was used as reference expression vector for the protein of interest, FucA. This expression vector is based on the IPTG-‐induced T5 promoter, derived from the T5 phage. This promoter is recognized by E. coli RNA polymerase, and has a double lac operator (lac O) repression module in series to provide tightly regulated and high-‐ level expression of recombinant proteins (Figure. 2A). The fucA gene was amplified from the pTrcfuc vector using the FucA FW and REW primers (Table 2). Thereafter, the 0.65 Kbp PCR fragment was digested with the restriction enzymes BamHI and HindIII and subsequently cloned into the pQE-‐40 vector linearized with the same enzymes, yielding pQE-‐FucA (Figure. 2B). E. coli M15 [pREP4] cells were transformed with the ligation reaction, and the positive clones were selected by growing on LB plates containing of ampicillin and kanamycin.
[image:9.595.91.483.171.368.2]Fig. 2 A) T5 promoter region from the pQE-‐40 expression vector. The lac O sequences and the -‐
35 and -‐10 regions are shown. B) pQE-‐FucA expression vector obtained by cloning the PCR-‐
amplified fucA gene into the pQE-‐40 vector. PT5, promoter T5; 6xHis, histidine affinity tag coding
sequence; FucA, fucA gene; MCS, multi cloning site; Lt0, lambda t0 transcriptional termination
region; rrnBT1, transcriptional termination region; ColE1, replication origin and AmpR, ampicillin
resistance gene.
pQEαβFucA: The DNA fragment comprising the glyA gene with its own promoter and its 3’ termination region (designated as αβTerminator) was amplified using the KOD polymerase and pQEαβRham (17) as template DNA. The resulting 1,784 Kbp fragment was then digested by BspEI and XbaI and subsequently ligated into the pQE-‐FucA vector previously linearized with the same enzymes, obtaining the pQEαβFucA. The ligation reaction was transformed into E. coli M15ΔglyA[pREP4] competent cells and the transformants selected on LB plates containing ampicillin and kanamycin.
Fig. 3 pQEαβFucA expression vector. PT5, promoter T5; 6xHis, histidine affinity tag coding
sequence; FucA, fucA gene; ‘MCS, multi cloning site; Lt0, lambda t0 transcriptional
termination region; glyA, glyA gene; T, termination sequence of the glyA gene; ColE1,
replication origin and AmpR, ampicillin resistance gene.
[image:10.595.215.387.68.289.2] [image:10.595.238.366.538.653.2]
BioBrick-‐based vectors (pSB1C3-‐J231XX_lacIglyA).
The BioBrick vectors were assembled using the golden gate technique (23). The Golden Gate method exploit the ability of type IIs endonucleases to cleave DNA outside of the recognition sequence leaving an overhang. In this study BsaI restriction enzyme and its four bp overhangs is used.
The lacI and glyA genes for the golden gate reaction were amplified from the pREP4 and the pQEαβFucA vectors, respectively with the GG_lacI FW and REW primers and with the GG_glyA FW and REW primers (Table 2), obtaining the lacI_GG and glyA_GG modules. For convenience, the starting BioBrick vector pSB1C3_GG, the promoters and the PCR products were diluted to a final concentration of 69 fmol·∙μL-‐1. To each reaction, 0.5 μL of BsaI and T4 ligase were added.
Final reactions were incubated in a thermocycler as follows: 25-‐30 cycles, cycling between 37 °C 3 min and 16 °C 4 min, ending with 5 min at 50 °C and 5 min at 80 °C. Four BioBrick constructs were assembled, each one with a different constitutive promoter to tune the expression levels of lacI and glyA genes. The four vectors were named pSB1C3-‐J231XX where the double X represents the last two digits of the promoter name. Finally, 2-‐5 μL of assembly BioBrick constructs were transformed into 50 μL of E. coli DH5α competent cells and plated on LB plates containing chloramphenicol. Plasmids were isolated from white colonies and validated as described in section 2.2.
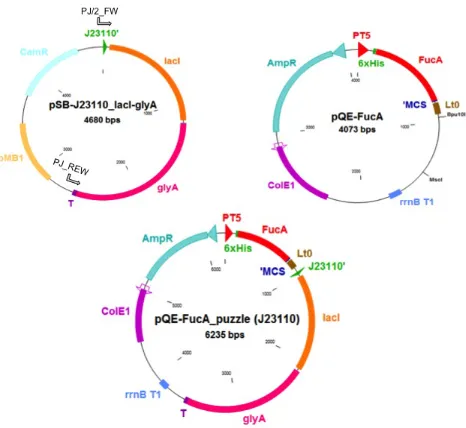
pQE-‐FucA puzzle (J23110). Constructing new vector starting from the pQE-‐FucA and the BioBrick vector requires just two-‐assembly step (Figure 4).
Fig. 4 Strategy for pQE-‐FucA_puzzle (J23110) construction. A) PCR amplification lacI-‐
glyA cassette using plasmid SB1C3-‐J23110 as template and the primers PJ/2_FW and PJ-‐
REW. B) Double digestion of pQE-‐FucA with Bpu10I and MscI. C) Final ligation step of the
PCR-‐amplified fragment (in step A) into the pQE-‐FucA_puzzle (J23110) expression
vector.
The expression cassette J23110-‐lacI-‐glyA was amplified from the plasmid SB1C3-‐J23110 by PCR using the Phusion high fidelity polymerase (NEB) and the PJ/2_FW and PJ_REW as amplification primers (Table 2). Both the PCR product and the destination vector pQE-‐FucA were digested with restriction enzymes Bpu10I and MscI and subsequently purified after agarose gel electrophoresis. The expression cassette was cloned into the pQE-‐FucA (double digested) obtaining the pQE-‐FucA_puzzle (J23110). Finally, the ligation product was transformed into the M15ΔglyA competent cells obtaining the M15ΔglyA pQE-‐FucA_puzzle (J23110). Transformants were isolated and correct plasmid sizes were verified.
pQE-‐FucA_puzzle (J23110)_AmpR−. The vector pQE-‐FucA_puzzle (J23110) was double digested
with Eco0109I and Ahdl in order to eliminate de bla gene. The 5´-‐3´polymerase and the 3´-‐ 5´exonuclease activities of the DNA Polymerase I (Large) Klenow Fragment was used in order to end-‐removal and fill-‐in terminal unpaired nucleotides.
[image:12.595.186.419.70.284.2]M15ΔglyA and plated on defined medium (DM) plates. Transformants were isolated and tested both in DM and LB plus ampicillin plates, for positive and negative control, respectively. Transformants were selected as being able to grow in defined media plates but not in LB plates plus ampicillin and validated as described in section 2.2. The best clone in terms of growth and FucA production was selected through a screening process in 500 mL Shake Flasks with 100 mL of defined media for triplicate (data not shown). The induction was performed at the exponential phase with a pulse of 1 mM IPTG and the induction was maintained for 4 hours.
2.4 Culture media
Luria Bertani (LB) medium, containing 10 g·∙L-‐1 peptone, 5 g·∙L-‐1 yeast extract and 10 g·∙L-‐1 NaCl,
was used for pre-‐cultures.
The Defined Medium (DM) used for shake flasks cultures and for the agar plate contained per liter: 5 g glucose, 2.97 g K2HPO4, 0.60 g KH2PO4, 0.46 g NaCl, 0.75 g (NH4)2SO4, 0.11 g
MgSO4·∙7H2O, 0.006 g FeCl3, 0.025 g thiamine, 1.44 g CaCl2·∙2H2O, 0.07 mL·∙100mL-‐1 medium of
trace elements solution (TES) (TES contained per liter: 0.04 g AlCl3·∙6H2O, 1.74 g ZnSO4·∙7H2O, 0.16
g CoCl2·∙6H2O, 2.18 g CuSO4·∙5H2O, 0.01 g H3BO3, 1.42 g MnCl2·∙6H2O, 0.01 g NiCl2·∙6H2O, 0.23 g
Na2MoO4·∙5H2O).
Stock solutions of kanamycin and chloramphenicol were prepared with a concentration of 100 mg·∙mL-‐1 and 30 mg·∙mL-‐1, respectively, and stored at -‐20 °C. Ampicillin 100 mg·∙L-‐1 ethanol stock
was prepared and stored at -‐20 °C. IPTG stock was prepared at 100 mM, and stored at -‐20 °C.
Vitamins, antibiotics, TES, FeCl3, MgSO4·∙4H2O, CaCl2·∙2H2O and inducer were sterilized by
filtration (0.2 µm syringe filter made from a blend of cellulose esters, Sartorius). Glucose and saline solutions were separately sterilized by autoclaving at 121°C for 30 min.
2.5 Cultivation conditions
agitation, and after around 16 h of incubation, cultures reached 2.0-‐2.5 units of optical density at 600 nm (OD600).
Inoculum. 3 mL of the overnight pre-‐inoculum were transferred to a shake flask containing 100 mL of DM, with the same growing conditions as pre-‐inoculum cultures. All cultivations were performed in a working volume of 100 mL in 250 mL-‐volume baffled shake flasks.
To induce fucA expression, an IPTG pulse with a concentration of 1 mM was carried out. Cells were induced when reached an OD600 of 1.5 and the induction was maintained for 4 hours,
sampling before induction and after 1, 2 and 4 hours of induction.
2.6 Analytical methods
Cell concentration was determined by optical density (OD) measurements at 600 nm using a spectrophotometer (Uvicon 941 Plus, Kontrol). OD values were converted to biomass concentration expressed as Dry Cell Weight (DCW), with 1 OD600 equivalent to 0.3 gDCW·∙L-‐1 (24).
For analysis of substrate and by-‐products concentration in the cultivation broth, one milliliter of culture medium was separated from biomass by centrifugation at maximum rpm for 6 min and filtered (0.45 µm membrane filter of cellulose esters, Millipore) prior to analysis. Glucose concentration was determined enzymatically on an YSI 2070 system (Yellow Spring System). Acetic acid was analyzed by HPLC (Hewlett Paackard 1050) equipped with an ICSep COREGEL 87H3 ICE-‐99-‐9861 (Transgenomic) column and an IR detector (HP 1047), using 6 M H2SO4 (pH
2.0) as mobile phase, a flow rate of 0.3 ml·∙min-‐1, at 40 °C.
The biomass yield, YX/S was calculated using the next equation:
𝑌!/!=(𝐷𝐶𝑊!"#−𝐷𝐶𝑊!)
(𝐺𝑙𝑐!−𝐺𝑙𝑐)
where DCWmax and DCW0 (g·∙L-‐1) are the maximum and the initial biomass value, and the Glc0 and
Glcf (g·∙L-‐1) are the initial and the final value of glucose concentration, respectively.
The specific substrate uptake rate, qS, is defined as follows:
𝑞!=
𝜇 𝑌!/!
where qS is given as grams of carbon per grams of biomass per hour (g·∙g-‐1DCW·∙h-‐1).
2.7 Enzyme activity for FucA
Samples from culture broths were withdrawn, adjusted to a final OD600 of 3, centrifuged and
then processed as previously described (25)(17). Briefly, after rejecting the supernatant, the pellets were resuspended in 100 mM TrisHcl (pH 7.5) keeping the same OD600 previously adjusted. Cell suspensions were placed in ice and sonicated with four 15 seconds pulses at 50W with 2 minutes intervals in ice between each pulse, using a VibracellTM model VC50 (Sonics & Materials). Cellular debris was then removed by centrifugation and the clear supernatant was collected for product analysis.
Two different methods were used to quantify the product in each sample. One was used to calculate the FucA activity while the second one was used to quantify the amount of FucA amongst the rest of intracellular soluble proteins (17). One unit of FucA activity is defined as the amount of enzyme required to convert 1 μmol of fuculose-‐1-‐phosphate in DHAP and L-‐ lactaldehyde for minute at 25 °C and pH 7.5.
For all the results, average values were plotted with error bars. The error indicates the confidence interval with a confidential level of 90%.
3
Results
3.1 Comparison of FucA expression between M15[pREP4] and M15[pREP4] ΔglyA strain
A first stage performance, the reference FucA expression systems E. coli M15[pREP4] pQE-‐FucA and E. coli M15ΔglyA[pREP4] pQEαβFucA was assessed in shake flasks cultures in defined media (DM). Heterologous expression was induced in mid-‐ exponential phase cultures using 1mM IPTG in order to compare biomass, FucA and acetate production, as well as glucose consumption profile along time (Figure. 5). As it can be seen in figures 5A and 5B, cell growth slows down after IPTG induction and even starts declining in the M15ΔglyA strain. The reference M15 strain presents a slightly higher maximum specific growth rate (μmax) of 0.49 ± 0.01 h-‐1 compared to
0.44 ± 0.01 h-‐1 of the M15ΔglyA. This effect may be caused by the increase in the metabolic
burden due to expression vector maintenance in the M15ΔglyA strain.
Fig. 5 (¢) Biomass DCW (g·∙L-‐1),( ) enzyme activity (AU·∙gDCW-‐1), (n)specific mass production content
(mgFucA·∙gDCW-‐1), ( ) Glucose (g·∙L-‐1) and ( ) Acetic Acid (g·∙L-‐1) profiles along time in a defined medium. The
arrow indicates the IPTG pulse for the induction. A and C refer to the M15[pREP4] pQE-‐FucA strain while B and D
refer to the M15ΔglyA[pREP4] pQEαβFucA strain. Shake flasks cultures were performed by triplicate, at 37°C in
[image:16.595.96.501.347.685.2]Substrate uptake rates, qS, along the induction phase for both strains were calculated being 0.37
± 0.04 and 0.50 ± 0.13 gGlc·∙g-‐1DCW·∙h-‐1 for the M15 and for the M15 ΔglyA[pREP4], respectively.
As a consequence, the M15 ΔglyA[pREP4] strain accumulated higher amounts of acetate throughout the growth process, reaching a final concentration of 0.54 ± 0.03 g·∙L-‐1 as it can be
observed in figure 5D. The physiological background for this acid production under aerobic conditions has been found to be a result of unbalanced rates of glycolysis and the oxidation of the metabolites formed due to saturation of this respiration capacity of E. coli (26). Furthermore, it has been reported, that the recombinant protein production is significantly reduced by acetate accumulation (27). Accordingly, both FucA activity (AU·∙g-‐1 DCW) and FucA
mass (mg·∙g-‐1DCW) (Figure 5B) decrease more than 50% comparing the M15ΔglyA strain to the
reference M15 system (Figure 5A). Whereas the M15 strain reached a final production of 181 ± 5 mgFucA·∙g-‐1DCW, with an activity of 721 ± 82 AU·∙g-‐1DCW, these values were reduced to 67 ± 37 mgFucA·∙g-‐1DCW 291 ± 24 AU·∙g-‐1DCW respectively, in the M15ΔglyA strain. The results shown
above could be related to the concomitant SHMT overexpression observed after induction in the M15ΔglyA strain. This fact could impose a slight metabolic burden to the cell, i.e. having a negative impact on the μmax and FucA production.
Noteworthy, the metabolic burden is caused not only due to the overexpression of the protein of interest but also to the expression of other plasmid-‐encoded genes, e.g. the glyA may also contribute (19).
Fig. 6 SDS-‐PAGE of shake flasks culture’s samples. A) Triplicate of the M15[pREP4]/pQE-‐FucA strain; B) Triplicate
of the M15ΔglyA[pREP4]/pQEαβFucA strain. Lane M: molecular weight marker. 1, 2, 3 correspond to the shake
flask culture replicates while the PI (pre induction) and 1 h, 2h and 4h correspond to the time after induction. The
26 kDa FucA and 46 kDa SHMT bands are indicated in the figure with arrows.
3.2 Single plasmid expression system
The regulation of glyA expression levels has a key role in improving the recombinant protein production, as mentioned before. In addition, in order to decrease the extent of the metabolic load and in order to obtain an expression system completely antibiotic free-‐plasmid selection system, we focused on pREP4 plasmid elimination. The objectives were to i) obtain an expression system based on a single plasmid; ii) clone the lacI gene from the pREP4 plasmid to the pQE-‐expression vector; and iii) tune the glyA expression levels.
[image:18.595.114.486.74.233.2]A possible explanation for the lack of FucA expression in the system with no lacI gene may be related to T5 promoter leakiness in absence of lacI repressor, leading to plasmid structural instability, as discussed in section 3.3. Alternatively, a possible explanation for the lack of FucA expression in the single plasmid system may be that the copy number of the lacI gene increases when cloned into the pQE-‐ vector, resulting in significantly higher lacI intracellular levels. In fact, the pQE vector is based on the plasmid ColE1 replication origin, which presents a copy number 2-‐fold higher compared with the P15A replicon of the pREP4 (1).
Overall, these experiments confirmed the need for tuning the lacI transcriptional levels for optimal regulation and induction of the foreign gene expression when re-‐locating different parts of the reference two-‐plasmid system into a single plasmid.
3.3 Tuning of lacI and glyA expression levels
As mentioned in the materials and methods section, the T5 promoter has a double lac O region in order to guarantee a strong repression under non-‐induction conditions. The lac repressor, encoded by the lacI gene, binds very tightly to the promoter and ensures efficient repression of the strong T5 promoter interfering with the transcription of the gene of interest. As stated above, promoter leakiness in repressor absence might have lead to structural instability of the expression vector, resulting in reduced expression levels. To test this hypothesis, we sequenced the T5 promoter region isolated from several non-‐producing M15ΔglyA pQEαβFucA constructs. Notably, we observed a deletion in the lac O regions, probably due to recombination events of the homology region (data not shown).
3.3.1 pSB1C3 J231XX constructions
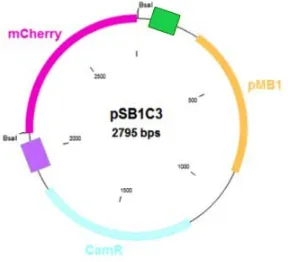
In this study, the BioBrick vector pSB1C3 was used as template for the construction of a series of four vectors, each co-‐expressing the glyA and lacI genes under the four selected constitutive promoters. That is, each expression vector differs from the other just for the constitutive promoters. The aim was to find the promoter with enough activity to produce the minimum amount of LacI inhibitor preventing “promoter leakiness”, as well as the minimal glyA transcriptional levels needed for plasmid maintenance and optimal cell growth in defined media. This plasmid series was assembled using a Golden Gate-‐based strategy. In particular, the pSB1C3 (Figure. 7), a high copy BioBrick assembly plasmid, was prepared by means of a PCR reaction, introducing two BsaI restrictions sites with the two different overhangs. Both the replication origin and the antibiotic resistance marker were maintained as standard parts.
Fig. 7 pSB1C3 vector with the 2 BsaI restriction sites. In pink the mCherry gene, in yellow the
replication origin (pMB1) and in light blue the chloramphenicol resistance gene (CamR).
[image:20.595.231.375.316.447.2]
Fig. 8 Golden Gate Assembly Method. A) PCR products of the promoters (J231XX) and the lacI and glyA genes
with the different overhangs of the BsaI at the 5’ and 3’ terminus in different colors showing the
complementary part for the directional cloning. B) Schematic diagram of Golden Gate assembly method to facilitate the construction of the new BioBrick vectors. C) Representation of the four pSB-‐J231XX vectors, each
one with one of the four constitutive promoters.
Once obtained the four expression vectors, they were transformed together with the pQE-‐FucA plasmid into M15ΔglyA. The resulting final strains were named M15ΔglyA pQE-‐40 + pSB1C3-‐ J231XX. To demonstrate the correct assembly of BioBrick parts into the new expression vectors, colony PCR was performed for at least 6 white transformants for each construction. Finally, one correct assembled clone for each strain was selected for further testing in expression experiments in shake flasks cultures.
A
C
[image:21.595.93.506.91.465.2]3.4 Small scale expression experiments with the BioBrick constructs
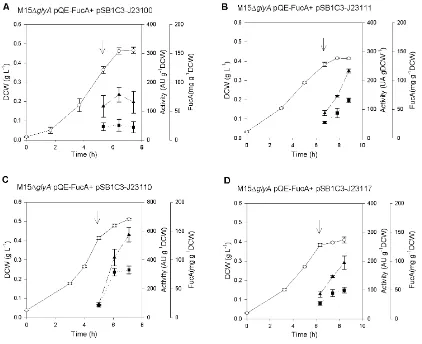
The over-‐expression of FucA for the 4 resulting selected transformants was tested in triplicate shake flasks cultures, in which biomass, glucose consumption and enzyme production was analyzed along time (Figure 9). The cultures were grown on 5 g·∙L-‐1 of initial glucose
concentration and when the OD reached 1.5, FucA expression was induced with 1 mM of IPTG. Culture samples were collected before induction and, 1 h and 2h post-‐induction for further analysis. The evolution of cultures is summarized in figure 9.
Fig. 9. Shake flask cultures of M15ΔglyA pQE-‐FucA pSB1XX strains series. (¢) Biomass DCW(g·∙L-‐1), ( ) enzyme
activity (AU·∙g-‐1DCW) and (n)specific mass production (mgFucA·∙g-‐1DCW) profiles along time in a defined media shake
flasks cultures performed for the 4 different selected transformants, that is, M15ΔglyA pQE-‐FucA pSB1C3 with the 4
different constitutive promoters: A) J23100 B) J23111 C) J23110 D) J23117. The arrow indicates the IPTG pulse for the induction.
The specific growth rate measured in the different cultures showed a similar behavior for all the transformants except for those with the J23100 promoter, which presented a μmax 1.3 fold
[image:22.595.97.519.238.582.2]the previous results (Section 3.2). Therefore, a higher growth rate could be explained as follows: higher constitutive lacI expression level may lead to a reduction of the fucA expression and subsequently to the decrease of the metabolic burden.
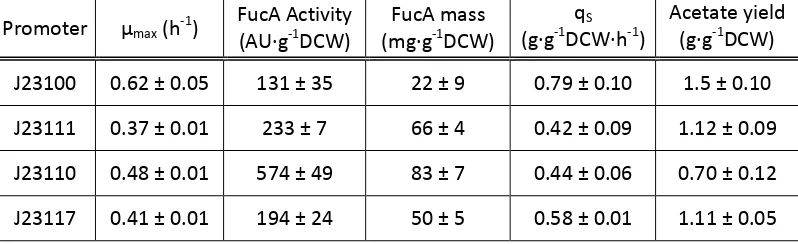
Table 3 Maximum specific growth rate (μmax h-‐1), FucA activity (AU·∙g-‐1DCW), FucA mass (mg·∙g-‐1DCW), qS of the
induction phase and the maximum acetate yield (g·∙g-‐1DCW) for each of the fours selected transformants
M15ΔglyA pQE-‐FucA pSB1C3 with the 4 different constitutive promoters: J23100, J23111, J23110 and J23117.
The values represent the sample after 2 hour of induction.
Promoter μmax (h-‐1) FucA Activity (AU·∙g-‐1DCW) (mg·∙gFucA mass -‐1DCW) (g·∙g-‐1DCW·∙hqS -‐1) Acetate yield (g·∙g-‐1DCW)
J23100 0.62 ± 0.05 131 ± 35 22 ± 9 0.79 ± 0.10 1.5 ± 0.10
J23111 0.37 ± 0.01 233 ± 7 66 ± 4 0.42 ± 0.09 1.12 ± 0.09
J23110 0.48 ± 0.01 574 ± 49 83 ± 7 0.44 ± 0.06 0.70 ± 0.12
J23117 0.41 ± 0.01 194 ± 24 50 ± 5 0.58 ± 0.01 1.11 ± 0.05
As it can be seen in figure 9C and in table 3, the best expression vector is the one harboring the constitutive promoter J23110, which is in the lower range of tested lacI and glyA transcriptional levels (Figure 1A). This suggested that the reduced lacI and glyA genes expression seems to have reduced the energy and building blocks demand for glyA synthesis, as well as minimizing T5 promoter leakiness, resulting in an overall reduced metabolic burden, as reflected in the fact that the μmax of this strain under pre-‐induction conditions was comparable to that of the M15
reference strain (0.48 ± 0.01 h-‐1).
Furthermore, when looking at the glucose consumption profile (Fig 10) it can be observed that the 4 different constructs have a similar trend during the exponential phase, while comparing the qS values during the induction phase it can be clearly seen that the “J23100” strain is the one
with higher specific uptake rate of glucose (Table 3). Coherently this strain is the one with the highest yield of acetate reaching 1.50 ± 0.10 gAc·∙g-‐1DCW.
Concerning the best expression vector J23110: it is the one that present the lowest qS (0.44 ± 0.06 g·∙g-‐1DCW·∙h-‐1) and acetate yield (0.70 ± 0.12 g·∙g-‐1DCW) comparing with the other constructs.
[image:23.595.103.502.200.322.2]Fig. 10 ( ) Glucose (g·∙L-‐1) and ( ) Acetic Acid (g·∙L-‐1) profiles along time in a defined media shake flasks cultures
performed at 37°C 150 rpm for the 4 different selected transformants M15ΔglyA pQE-‐FucA pSB1C3 with the 4
different constitutive promoters: A) J23100 B) J23111 C) J23110 D) J23117. The arrow indicates the IPTG pulse for the
induction.
3.5 M15ΔglyA pQE-‐FucA_puzzle strain
Once selected M15ΔglyA pQE-‐FucA + pSB1C3-‐J23110 as the strain with highest FucA production and specific activity among the 4 different constructs, as well as being able to grow at the same
μmax as the reference strain (0.48 ± 0.01 h-‐1), our next goal was the construction of a single
expression vector harboring both the fucA gene under control of the inducible T5 promoter and the lacI-‐glyA cassette cloned under the J23110 constitutive promoter. Such plasmid was constructed as described in Materials and Methods section and further transformed into M15ΔglyA, yielding E. coli M15ΔglyA pQE-‐FucA_puzzle (J23110).
Shake flask cultivations of the new strain were carried out in triplicate at 37°C in defined medium (DM) with 5 g·L-‐1 glucose as initial carbon source, without any antibiotic
[image:24.595.97.489.67.432.2]FucA_puzzle (J23110) was 0.45 ± 0.01 h-‐1, comparable to those from the preceding 2-‐plasmid
construct and original reference strain (0.49∼0.48 ± 0.01 h-‐1).
Fig. 11 A) (¢) Biomass DCW (g·∙L-‐1), ( ) enzyme activity (AU·∙g-‐1DCW), (n)specific mass content
(mgFucA·∙g-‐1DCW) and B) ( ) Glucose (g·∙L-‐1) and ( ) Acetic Acid (g·∙L-‐1) profiles, along time in a defined
medium shake flasks cultures performed at 37°C for the M15ΔglyA pQE-‐FucA_puzzle (J23110) strain.
The arrow indicates the 1mM IPTG pulse for the induction.
Maximum FucA mass and FucA specific activity reached were 97 ± 14
mg-‐1 FucA·∙g-‐1DCW and 984
± 32 AU·∙g-‐1DCW, respectively (Figure 11 A). Comparing these values with those obtained with
the M15 pQE-‐FucA reference strain (181 ± 5
mg FucA·∙g-‐1 DCW and 721 ± 82 AU·∙g-‐1 DCW), it can
be observed how, even though the amount of the recombinant protein was still lower, the specific activity increased 1.4-‐fold. Besides, the M15ΔglyA pQE-‐FucA_puzzle (J23110) presented a reduction in the amount of acetate production, being 0.57 ± 0.03 g·∙g-‐1DCW, relating to 0.73 ±
0.04 g·∙g-‐1DCW of the M15 pQE-‐FucA reference strain.
Overall, these results suggest that transcriptional tuning of lacI expression levels brings to a better fucA expression regulation allowing for an extended production formation period, leading to a higher FucA specific activity. Moreover, glyA levels also co-‐down regulated, have a positive effect on the reduction of the metabolic load due to expression of plasmid-‐encoded genes (also reflected in the reduced acetate production).
[image:25.595.103.505.140.321.2]3.6 M15ΔglyA pQE-‐FucA_puzzle_AmpR-‐ strain
Lastly, an expression system completely devoid of antibiotic resistance genes was constructed by removing the bla gene from the expression vector. The corresponding strain was named E. coli M15ΔglyA pQE-‐FucA_puzzle (J23110)_AmpR-‐. The ampicillin resistance gene (bla) was
eliminated from the pQE-‐FucA_puzzle (J23110) plasmid using the Klenow fragment-‐based blunting DNA technique (Figure. 11).
After a screening process (section 2.3) the best clone in term of best growth rate and higher recombinant protein production was selected (Data not shown).
As for the previous strains, shake flask cultures of the new strain were carried out in triplicate at 37°C in defined medium (DM) without any antibiotic supplementation. The time-‐profiles of the biomass, glucose consumption, acetate and FucA mass and FucA specific activity were analyzed and represented in figure 14.
Fig. 12 Schematic diagram of the construction strategy of pQE-‐FucA_puzzle (J23110)_AmpR−. A)
Double digestion of pQE-‐FucA_puzzle (J23110) vector by the restriction enzymes Eco0109I and
AhdI. B) End removal and fill-‐in of terminal unpaired nucleotides by DNA polymerase I (large)
Klenow fragment (NEB). C) Final ligation obtaining pQE-‐FucA_puzzle (J23110)_AmpR− expression
[image:26.595.107.494.222.513.2]Fig. 13 A) (¢) Biomass DCW(g·∙L-‐1), ( ) enzyme activity (AU·∙g-‐1DCW), (n)specific mass
(mgFucA·∙g-‐1DCW) and B) ( ) Glucose (g·∙L-‐1) and ( ) Acetic Acid (g·∙L-‐1) profiles, along time
in a defined medium shake flasks cultures performed at 37°C 150 rpm for the M15ΔglyA
pQE-‐FucA_puzzle (J23110) strain. The arrow indicates the IPTG pulse for the induction.
A small but significant decrease can be observed in the μmax 0.41 ± 0.01 h-‐1 compared to the
strains M15[pREP4] pQE-‐FucA and M15ΔglyA pQE-‐FucA_puzzle (J23110), which showed a μmax of
0.49 ± 0.02 h-‐1 and 0.45 ± 0.01 h-‐1, respectively (Table 4). However, a significant increase can be
observed both for the FucA specific mass and FucA specific activity. The point of maximum activity corresponds to 1309 ± 24 AU·g-‐1DCW and 254 ± 5 mgFucA·g-‐1DCW after 2 h of induction.
Comparing with all the previous constructs, FucA over-‐production in the final antibiotic free-‐ plasmid selection system is the highest. As it can be seen in table 4, M15ΔglyA pQE-‐FucA_puzzle (J23110)_AmpR-‐ FucA yield is: i) more than 1.4 fold higher comparing with the M15pQE-‐FucA
strain; ii) two-‐fold higher comparing with M15ΔglyA pQE-‐FucA + pSB1C3 (J23110) and M15ΔglyA pQE-‐FucA_puzzle (J23110) and iii) three-‐ fold higher referred to the M15ΔglyA strain. Coherently, the FucA activity, in terms of AU·∙g-‐1DCW, increased through the different strain
improvements performed along this work, reaching 4.5-‐fold higher values when compared to the first ΔglyA strain generation. In parallel, the acetate production, expressed as gAc·∙gDCW-‐1,
was also significantly reduced after these series of expression system engineering steps.
[image:27.595.102.506.90.258.2]
Tabla 4 Maximum FucA activity (AU·∙g-‐1DCW), maximum FucA mass (mg·∙g-‐1DCW), μmax and maximum acetate
yield (g·∙g-‐1DCW) along the induction phase for the principal strains presented along this study.
E. coli strains FucA activity (AU·∙g-‐1DCW) (mg·∙gFucA mass -‐1DCW) (hμmax -‐1) Acetate yield (g·∙g-‐1DCW)
M15[pREP4] pQE-‐FucA 721 ± 82 181 ± 5 0.49 ± 0.02 0.73 ± 0.04 M15ΔglyA[pREP4]
pQE-‐FucA 291 ± 24 67 ± 37 0.44 ± 0.01 0.90 ± 0.04 M15ΔglyA pQE-‐FucA +
pSB1C3 J23110 574 ± 49 83 ± 7 0.48 ± 0.02 0.70 ± 0.12 M15ΔglyA pQE-‐
FucA_puzzle (J23110) 984 ± 32 97 ± 14 0.45 ± 0.01 0.57 ± 0.03 M15ΔglyA pQE-‐FucA_
puzzle(J23110)_AmpR-‐ 1309 ± 24 254 ± 5 0.41 ± 0.01 0.37 ± 0.01
4
Conclusions
This work has developed a novel expression system based on an antibiotic-‐free plasmid maintenance mechanism. We demonstrated that a tuning of the glyA and lacI expression was required to reduce metabolic burden. Although the overexpression of the plasmid-‐encoded protein of interest (FucA) is a major factor in the metabolic burden, the non-‐optimized expression levels of lacI and glyA genes, coding for the lac repressor and the auxotrophic selection marker protein respectively, also contributed. The selected expression cassette for the lacI and glyA, where these genes have been placed under the control of a constitutive promoter J23110, seems to down regulate their transcriptional levels. This tuning, together with the complete deletion of the antibiotic resistance gene, results in to a reduction of the metabolic burden leading to a better stability of expression system that, ultimately, allows an improvement of the recombinant protein production and a reduction of acetate secretion.


![Fig.
6
SDS-‐PAGE
of
shake
flasks
culture’s
samples.
A)
Triplicate
of
the
M15[pREP4]/pQE-‐FucA
strain;
B)
Triplicate
of
the
M15ΔglyA[pREP4]/pQEαβFucA
strain](https://thumb-us.123doks.com/thumbv2/123dok_us/9478147.454101/18.595.114.486.74.233/culture-samples-triplicate-strain-triplicate-dglya-pqeabfuca-strain.webp)