http://wrap.warwick.ac.uk
Original citation:
Cowin, Peter I., Lan, Rong, Petit, Christophe T. G. and Tao, Shanwen. (2015)
Conductivity and redox stability of double perovskite oxide SrCaFe1+xMo1–xO6–δ (x =
0.2, 0.4, 0.6). Materials Chemistry and Physics, 168 . pp. 50-57.
Permanent WRAP url:
http://wrap.warwick.ac.uk/76080
Copyright and reuse:
The Warwick Research Archive Portal (WRAP) makes this work of researchers of the
University of Warwick available open access under the following conditions.
This article is made available under the Creative Commons Attribution 4.0 International
license (CC BY 4.0) and may be reused according to the conditions of the license. For
more details see:
http://creativecommons.org/licenses/by/4.0/
A note on versions:
The version presented in WRAP is the published version, or, version of record, and may
be cited as it appears here.
Conductivity and redox stability of double perovskite oxide
SrCaFe
1
þ
x
Mo
1
e
x
O
6
e
d
(x
¼
0.2, 0.4, 0.6)
Peter I. Cowin
b, Rong Lan
a, Christophe T.G. Petit
b, Shanwen Tao
a,b,* aSchool of Engineering, University of Warwick, Coventry CV4 7AL, UKbDepartment of Chemical&Process Engineering, University of Strathclyde, Glasgow G1 1XJ, UK
h i g h l i g h t s
New perovskite oxides SrCaFe1þxMo1exO6ed(x¼0.2, 0.4, 0.6) synthesised.
The conductivity of SrCaFe1.2Mo0.8O6edin 5% H2/Ar was around 73.5 Scm1.
The conductivity of these compounds relies on high temperature reduction.
a r t i c l e i n f o
Article history: Received 10 March 2015 Received in revised form 30 September 2015 Accepted 24 October 2015 Available online 14 November 2015
Keywords: Ceramics
Inorganic compounds Oxides
Electrical conductivity
a b s t r a c t
A series of new double perovskite oxides SrCaFe1þxMo1exO6ed(x¼0.2, 0.4, 0.6) were synthesised by
solid state reaction method. Synthesis of SrCaFe1þxMo1exO6ed(x¼0.2, 0.4, 0.6) were achieved above
700C in 5% H2/Ar, albeit with the formation of impurity phases. Introduction of calcium to Sr2Fe1þxMo1
exO6ed(x ¼0.2, 0.4, 0.6) was not successful in simultaneously improving the conductivity of these
compounds, with a significant reduction in the formability observed with increasing calcium content. Phase stability upon redox cycling was not observed for SrCaFe1þxMo1exO6ed(x¼0.2, 0.4, 0.6). Redox
cycling of SrCaFe1þxMo1exO6ed(x¼0.2, 0.4, 0.6) demonstrates a strong dependence on high temperature
reduction to achieve high conductivities, with re-reduction at lower temperatures attaining between 0.1% and 58.4% of the initial conductivity observed after high temperature reduction. The conductivity of SrCaFe1.2Mo0.8O6edin 5%H2/Ar between 300C and 500C was around 73.5 Scm1. The reliance of these
compounds on high temperature reduction is expected to limit their utility as SOFC anode materials, as the vulnerability to oxidation can have disastrous consequence for fuel cell durability.
©2015 The Authors. Published by Elsevier B.V. This is an open access article under the CC BY license (http://creativecommons.org/licenses/by/4.0/).
1. Introduction
Development of Sr2(TM)MoO6ed(TM¼Mn, Mg, Fe, Co, Ni, Cu,
Zn) as potential anode materials has been the subject of a sub-stantial body of research[1e5]. Whilst reasonable fuel cell perfor-mance has been achieved using Sr2MgMoO6ed(642 mWcm2 at
750C in pure H2)[1], Sr2MnMoO6ed(467 mWcm2at 750C in
pure H2)[1], Sr2CoMoO6ed(1017 mWcm2at 800C in pure H2)[6]
and Sr2FeMoO6ed(412 mWcm2at 750C in pure H2)[7]anodes, of
these compounds only Sr2MgMoO6ed(SMMO) has been proven to
be redox stable[8]. Despite achieving redox stability, the chemical reactivity of SMMO with common electrolytes, such as LSGM and YSZ, limits its utility[9,10].
Substitution of magnesium with iron has previously been shown to improve the conductivity, albeit with a reduction in the redox stability[8]. Xiao et al. improved both the formability and stability of Sr2FeMoO6edthrough an increase in the iron content of
the sample, with Sr2Fe1.33Mo0.66O6edformed in at 800C in H2,
300C below the synthesis temperature of Sr2FeMoO6edin 5% H2/
Ar[7,11]. The conductivity of Sr2Fe1.33Mo0.66O6edin 5% H2/Ar ranges
between 15 S cm1and 30 S cm1from 700C to 300C, sufficient for an IT-SOFC anode material, although the fuel cell performance only reached 268 mWcm2 at 700C in pure H2. Further
devel-opment of this series by Liu et al. formed Sr2Fe1.5Mo0.5O6edin air at
1000C and demonstrated high conductivity in both oxidising and reducing atmospheres[2]. Good performance of Sr2Fe1.5Mo0.5O6ed
as a symmetrical electrode was achieved, attaining ~500 mWcm2 at 800C in humidified H2with good stability over successive redox
cycles. *Corresponding author. School of Engineering, University of Warwick, UK.
E-mail address:S.Tao.1@warwick.ac.uk(S. Tao).
Contents lists available atScienceDirect
Materials Chemistry and Physics
j o u rn a l h o m e p a g e : w w w . e l s e v i e r . c o m / l o ca t e / m a t c h e m p h y s
http://dx.doi.org/10.1016/j.matchemphys.2015.10.056
A-site substitution of alkaline earth metals was determined to cause a significant alteration of material properties, with a reduc-tion in careduc-tion size (from Ba to Sr to Ca) causing an increase in the conductivity and a reduction in the material stability[7]. The in-crease in conductivity achieved through calcium substitution would be expected to improve anodic performance, although a significant improvement in the stability of the compound is required for use in IT-SOFCs[10,12]. To this end, in this study, a series of compounds of iron rich calcium iron molybdates, Ca2Fe1þxMo1exO6ed(x¼0.2, 0.4, 0.6) and strontium calcium iron
molybdate, SrCaFe1þxMo1exO6ed (x ¼ 0.2, 0.4, 0.6), were
syn-thesised to determine whether a simultaneous improvement of the conductivity and stability of these compounds was attainable.
2. Experimental information
2.1. Materials synthesis
Ca2Fe1þxMo1exO6ed(x¼0.2, 0.4, 0.6) were prepared by solid
state synthesis technique. Stoichiometric amounts of CaCO3(99%
min, Alfa Aesar), Fe2O3(99.5%, Alfa Aesar) and MoO3(99.5%, Alfa
Aesar) were weighed and mixed in a planetary ball mill for 2 h prior tofiring in air at 900C for 10 h. A secondfiring at 1200C in air for 50 h was then performed. For comparison, the samples fired at 1200C in air were furtherfired in 5% H2/Ar at 700C for 10 h.
SrCaFe1þxMo1exO6ed(x¼0.2, 0.4, 0.6) were prepared by solid
state synthesis technique. Stoichiometric amounts of CaCO3(99%
min, Alfa Aesar),SrCO3(>99.9%, Sigma Aldrich), Fe2O3(99.5%, Alfa
Aesar) and MoO3(99.5%, Alfa Aesar) were weighed and mixed in a
planetary ball mill for 2 h prior tofiring in air at 900C for 10 h. Pellets of all the samples (øz 13 mm2 mm) were uniaxially pressed at 221 MPa and sintered in air at 1300C for 5 h. The as-prepared SrCaFe1þxMo1exO6ed samples were further fired in 5%
H2/Ar for 10 h at 700C and 1200C respectively.
2.2. Materials characterisation
Phase purity and crystal parameters of the samples were examined by X-ray diffraction (XRD) analysis using a PANalytical X'Pert PRO MPD Multipurpose diffractometer (Cu Ka1 radiation,
l
¼1.5405 Å). GSAS[13] software was used to perform a least squares refinement of the lattice parameters of all suitable samples. The densities of the pellets were determined from the measured mass and volume. Theoretical densities were calculated using experimental lattice parameters and the chemical formula of the sample. The relative densities were calculated from the actual and theoretical density values. The density of the pellets was 65e80% for Ca2Fe1þxMo1exO6ed (x ¼ 0.2, 0.4, 0.6) and 80% forSrCaFe1þxMo1exO6ed(x¼0.2, 0.4, 0.6).
Thermal analysis was conducted using a Stanton Redcroft STA 1500 Thermal Analyser on heating from room temperature to 800C and on cooling from 800C to room temperature in air, with a heating/cooling rate of 10C/min, and in 5% H2/Ar, again with a
heating/cooling rate of 10 C/min, and with a flow rate of 50 mLmin1for 5% H2/Ar.
2.3. Conductivity measurements
Pellets for SrCaFe1þxMo1exO6ed(x¼0.2, 0.4, 0.6) were coated on
opposing sides using silver paste afterfiring at 1200C for 8 h in 5% H2/Ar. The conductivity of the samples was measured primarily in
5% H2/Ar between 300 and 700C. Although pure H2is used in a
hydrogen fuel cells, it is normally wet H2with 3%H2O. The oxygen
partial pressure of wet H2is at the same level as the un-humidified
5%H2/Ar used in our conductivity measurement. Therefore the
conductivity measured in 5%H2/Ar in this study can provide a good
reference for the conductivity in wet H2which is close to the fuel
cell operating condition[14]. Secondary measurements over the same temperature range were conducted in air following an equilibration step of 12 h at 700C in air. Final measurements over the same temperature range were conducted after an equilibration step of 12 h at 700C in 5% H2/Ar. Measurements were conducted
using either an A.C. method utilising a Solartron 1455A frequency response analyser coupled to a Solartron 1470E potentiostat/gal-vanostat controlled by CellTest software over the frequency range 1 MHze100 mHz or a DC method using a Solartron 1470E poten-tiostat/galvanostat controlled by CellTest software with an applied current of 1e0.1 A as described elsewhere[15e17].
3. Results and discussion
3.1. Synthesis of Ca2Fe1þxMo1exO6edand SrCaFe1þxMo1exO6ed
(x¼0.2, 0.4, 0.6) in air and 5%H2/Ar
Synthesis of single phase Ca2Fe1þxMo1exO6ed(x¼0.2, 0.4, 0.6)
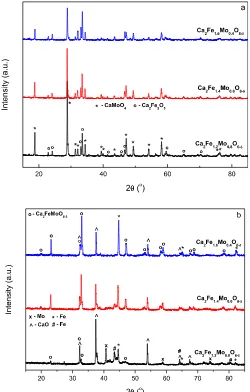
[image:3.595.312.562.322.714.2]compounds in air at 1200C was unsuccessful, with the formation of both CaMoO4(PDF: 01-077-2238, 29e351) and Ca2Fe2O5(PDF:
Fig. 1.XRD patterns of Ca2Fe1þxMo1exO6ed(x¼0.2, 0.4 and 0.6) synthesised in air at 1200C (a) and 5%H2/Ar at 1000C (b).
01-071-2108, 38e408) phases observed,Fig. 1(a). Previous research by Zhang et al.[7]indicated that formation of the calcium based compounds would requirefiring in reducing atmospheres, there-fore it is somewhat unsurprising that synthesis of pure calcium materials in air was unsuccessful. The samplesfired at 1200C in air were furtherfired in 5%H2/Ar at 700C for 10 h. Formation of a
single phase perovskite afterfiring at 700C in 5% H2/Ar was also
unsuccessful, with the presence of calcium oxide and pure iron phases observed for all compounds,Fig. 1(b). Comparison to the unreduced samples,Fig. 1(a), demonstrates that reduction causes degradation of the phases formed in air, likely due to reduction of the iron and molybdenum in the samples. This corresponds to previous reports which suggest that extended reduction of calcium iron molybdates at high temperatures will cause the exsolution of iron and molybdenum from the structure[18]. The differing phase fractions observed for this series could be related to the stability of the Ca2Fe1þxMo1exO6edphase, with increasing proportions of the
desired phase evident with increasing iron content.
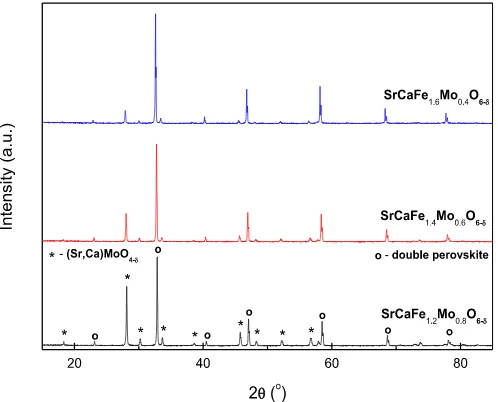
Synthesis of SrCaFe1þxMo1exO6ed(x¼0.2, 0.4, 0.6) in air was
found to form a two phase mixture, with a primary double perovskite phase (Space Group (SG): Fm-3m) and a secondary SrMoO4edebased phase (PDF: 01-085-0809, SG:I4/mmm) observed
for all compounds,Fig. 2. The formation of materials with theFm
-3mspace group correlates with the observed structure of the iron rich strontium analogues previously synthesised by Liu et al.[19]. Due to the formation of the desired phase, comparison of these compounds to Ca2Fe1þxMo1exO6ed(x¼0.2, 0.4, 0.6) demonstrates
a significant improvement in the formability in air with increased strontium content.
3.2. Synthesis of SrCaFe1þxMo1exO6ed(x¼0.2, 0.4, 0.6) in 5%H2/Ar
at 700C and 1200C respectively
Simultaneous thermal analysis in 5% H2/Ar of the samples
formed in air,Fig. 3(a), exhibited a weight loss proportional to the iron content of the samples. This suggests that the primary element reduced during exposure to 5% H2/Ar at this temperature is iron,
[image:4.595.308.548.67.433.2]from Fe4þ to Fe3þ, and that reduction at higher temperatures,> 800C, is required for significant reduction of the molybdenum and subsequent formation of single phase perovskites. A small devia-tion in the DSC,Fig. 3(b), was observed for all compounds between
[image:4.595.35.284.517.718.2]Fig. 2. XRD patterns of SrCaFe1þxMo1exO6ed(x¼0.2, 0.4 and 0.6) synthesised in air at 1300C.
Fig. 3.Thermogravimetric analysis (a) and differential scanning calorimetry (b) of SrCaFe1þxMo1exO6ed(x¼0.2, 0.4 and 0.6) in 5% H2/Ar.
[image:4.595.305.549.518.717.2]550C and 750C, correlating with the induction of weight loss observed on the TGA.
Reduction of the samples at 700C in 5% H2/Ar formed a single
phase double perovskite for the iron rich SrCaFe1.6Mo0.4O6ed
sam-ple (PDF: Fm-3m), Fig. 4, although both SrCaFe1.2Mo0.8O6edand
SrCaFe1.4Mo0.6O6ed continued to exhibit the secondary
SrMoO4edebased phase (PDF: 01-085-0809), with little change in
the phase fraction. The formation of a single phase double perov-skite for SrCaFe1.6Mo0.4O6edat 700C in 5% H2/Ar demonstrates an
improvement in the formability over the pure calcium analogue. Formation of mainly single phase double perovskites (SG:Fm
-3m) was achieved for all compounds after reduction in 5% H2/Ar at
1200C for 10 h,Fig. 5. The formation of the double perovskite phase at 1200C in 5% H2/Ar was predicted to occur, as previous
reports suggested that the formation of the less stable Ca2FeMoO6edphase was achieved at 1100C in 5% H2/Ar[7]. As
with reduction of the pure calcium analogue in 5% H2/Ar at 700C
for 10 h, exsolution of elemental iron (PDF: 6e696) was observed for all compounds, reducing with increasing iron content in the primary phase. A proportion of Ca2Fe2O5 (PDF: 01-071-2108,
38e408) was also observed for sample SrCaFe1.6Mo0.4O6ed. The
proportion of the secondary phase in the synthesised materials was calculated as 2e8 wt% for iron and 24 wt% for Ca2Fe2O5through
GSAS refinement of the phase fractions. Due to the proportion of these phases, elemental iron in the samples is considered to have a minimal effect on the preceding measurements, however the sizeable presence of Ca2Fe2O5 in SrCaFe1.6Mo0.4O6ed must be
considered in the analysis of the material properties.
GSAS refinement of the structure of these compounds,Table 1, demonstrated a non-linear increase in lattice parameters with increasing iron content. Both SrCaFe1.2Mo0.8O6ed and
SrCaFe1.4Mo0.6O6ed exhibit similar lattice parameters with
SrCaFe1.6Mo0.4O6edexhibiting significantly higher lattice
parame-ters. The higher lattice parameter noted for SrCaFe1.6Mo0.4O6edmay
be due to the large proportion of the secondary phase and the corresponding inaccuracy associated with three phase refinements. GSAS plots of SrCaFe1þxMo1exO6ed, x ¼ 0.2, 0.4 and 0.6 after
reduction in 5% H2/Ar at 1200C are shown inFig. 6.
3.3. Conductivity and redox stability of SrCaFe1þxMo1exO6ed
(x¼0.2, 0.4, 0.6)
DC conductivity measurements of each of the
SrCaFe1þxMo1exO6ed(x¼0.2, 0.4, 0.6) compounds exhibited high
electronic conductivity,>30 Scm1, between 300C and 700C in 5% H2/Ar immediately after reduction at 1200 C in 5% H2/Ar,
Fig. 7(aec). Initial semiconducting behaviour was observed for SrCaFe1.6Mo0.4O6edbetween 300C and 450C, SrCaFe1.4Mo0.6O6ed
between 300C and 350C and SrCaFe1.2Mo0.8O6edbetween 300C
and 500 C, exhibiting maximum conductivities of 64.8 Scm1, 60.6 Scm1and 73.5 Scm1respectively, with metallic conductivity was observed for all compounds above 500C. The conductivity of these compounds is comparable to those observed for Sr2Fe1.5Mo0.5O6ed [20] and Sr2Fe1.33Mo0.66O6ed.achieved by Xiao
et al.[11].
The metallic conductivity observed for all compounds above 500C is also found for Ca2FeMoO6ed[18]and Sr2FeMoO6ed[21]as
a result of the delocalisation of electrons in the spin down band at the Fermi level. Band structure calculations of Ca2exSrxFeMoO6ed
[22]exhibit a gap at the Fermi level between Fe 3d and Mo 4d states for the spin up structure, however the spin down structure exhibits a mixing of the Fe 3d, Mo 4d and O 2p bands at the Fermi level. Spin down electrons from either the Mo 4d or Fe 3d states are delo-calised at the Fermi level, arising from Mo5þ(4 d1) and Fe3þ(3 d5), accounting for the observed metallic conductivity[7,18,21].
The high conductivity of SrCaFe1.2Mo0.8O6ed, SrCaFe1.4Mo0.6O6ed
and SrCaFe1.6Mo0.4O6ed after reduction in 5% H2/Ar at 1200 C
suggests that delocalised electrons from Mo5þare unlikely to be the sole source of the metallic conductivity, as minimal variation in the electronic conductivity was observed despite significant variation in the molybdenum content.
The observed conductivity of A2FeMoO6ed(A¼Ca, Sr, Ba)[7]
was linked to a potential double exchange mechanism, with con-duction between Fe3þ-O-Mo-O-Fe2þ. Double-exchange mecha-nisms, as proposed by Zener [23], posit that electron transfer between ions in different oxidation states may be facilitated if the electron does not have to alter its spin state. Replacement of Mo with Fe in this mechanism would be expected to result in a reduction of the conductivity through reduction of the available percolation pathways, unless delocalisation of Fe electrons through Fe2þ-O-Fe3þexchange could also occur. Double exchange mecha-nisms have been observed previously for mixed valent iron in iron oxides[24], and, as iron is known to exist in a mixed valent state for Ca2exSrxFeMoO6ed[25], this provides a plausible explanation for
the observed metallic conductivity. Band structure calculations and Mossbauer spectroscopy could be utilised to further elucidate the conduction mechanism for these compounds, however this is outside the scope of this enquiry.
Whilst metallic conductivity is observed for pure calcium mo-lybdenum ferrites over the entire temperature range, a region of semiconductivity, as was observed for SrCaFe1þxMo1exO6ed
(x ¼0.2, 0.4, 0.6), has been observed previously for barium and strontium molybdenum ferrites[7]. Previous reports have attrib-uted the initial region of semiconductivity observed for all com-pounds to either disorder of the iron and molybdenum or the presence of oxygen vacancies, causing Anderson localisation
[21,26,27]. Anderson localisation is used to account for the absence of wave diffusion in a disordered medium and can account for electron localisation in materials when lattice disorder is suffi -ciently large. Under these conditions the mobility edge, the highest energy at which states are localised, occurs at a higher energy than the Fermi level, resulting in electron localisation. The transition to metallic conductivity could then be rationalised through a gradual increase of the Fermi level to a higher energy than the mobility edge, due to a reduction in the lattice disorder with increasing temperature[21].
[image:5.595.52.288.512.718.2]Oxidation of these compounds at 700C significantly reduced the conductivity, to <0.1 Scm1, for all compounds, Fig. 7(aec).
Fig. 5.XRD patterns of SrCaFe1þxMo1exO6ed(x¼0.2, 0.4 and 0.6) after reduction in 5% H2/Ar at 1200C.
Compound oxidation of these materials favours the formation of Fe3þ and Mo6þ, which reduces double exchange conduction through the reduction in mixed valence cations. The transition to
semiconducting behaviour upon oxidation observed for these materials has been previously exhibited in Sr2FeMoO6ed[21].
[image:6.595.35.557.84.386.2]Reduction of the previously oxidised compounds at 700C in 5%
Table 1
Rietveld refinement and lattice parameters from GSAS refinement of SrCaFe1þxMo1exO6ed(x¼0.2, 0.4, 0.6) after reduction at 1200C in 5% H2/Ar.
SrCaFe1.2Mo0.8O6ed SrCaFe1.4Mo0.6O6ed SrCaFe1.6Mo0.4O6ed
c2 1.924 5.111 3.851
Rp (%) 8.24 7.82 6.75
wRp (%) 6.27 5.38 4.89
Space Group Fm-3m Fm-3m Fm-3m
a (Å) 7.850(2) 7.849(1) 7.863(1)
V (Å3) 483.8(5) 483.6(2) 486.1(2)
Fe (%) 7.8 2.4 1.7
Space Group Im-3m Im-3m Im-3m
a (Å) 2.864(1) 2.866(1) 2.866(1)
Ca2Fe2O5(%) e e 24
Space Group e e Pcmn
a (Å) e e 5.618(1)
b (Å) e e 14.905(3)
c (Å) e e 5.437(1)
Sr/Ca x 0.5 0.5 0.25
y 0.5 0.5 0.25
z 0.5 0.5 0.25
Uiso 0.007(2) 0.005(1) 0.002(1)
Fe x 0 0 0
y 0 0 0
z 0 0 0
Uiso 0.029(5) 0.034(2) 0.049(3)
Fe/Mo x 0.5 0.5 0.5
y 0.5 0.5 0.5
z 0.5 0.5 0.5
Uiso 0.038(3) 0.003(1) 0.002(1)
O x 0.243(2) 0.257(1) 0.266(1)
y 0 0 0
z 0.5 0.5 0
[image:6.595.57.527.111.665.2]Uiso 0.068(4) 0.062(2) 0.077(2)
H2/Ar did not attain the high conductivity observed after reduction
at 1200C, with both SrCaFe1.6Mo0.4O6edand SrCaFe1.4Mo0.6O6ed
retaining ~5% of the initial conductivity, whilst SrCaFe1.2Mo0.8O6ed
only retained 0.3%. Although the conductivity exhibited after re-reduction at 700C is lower than previously observed, the initial semiconduction with a higher temperature transition to metallic conduction is still observed for both SrCaFe1.6Mo0.4O6ed and
SrCaFe1.4Mo0.6O6ed. This suggests that the same conduction
mechanism occurs, however the magnitude of the conduction is
[image:7.595.62.279.58.569.2]reduced. As the ratio of both Fe3þ/Fe2þand Mo6þ/Mo5þis known to be highly dependent on the reducing atmosphere and temperature
[18,21], it is expected that the reduction in the conductivity is a result of a lower degree of mixed valency due to the lower reduc-tion temperature. The reducreduc-tion of Fe3þto Fe2þ, the outer orbital changes from 3 d5to 3 d6. The ions with high spin of 3 d5and low spin of 3 d6will not be conductive. The reduction of Mo6þ(4 d0) to Mo5þ(4 d1) will introduce an electron in the 4d orbital which can be an electron charge carrier thus makes the oxide conductive[3,4]. XRD of SrCaFe1þxMo1exO6ed (x ¼ 0.2, 0.4, 0.6) after redox
cycling,Fig. 8, exhibited differing impurity phases and phase frac-tions for all compounds. The SrMoO4ebased impurity phase (PDF:
01-085-0809) was noted for SrCaFe1.4Mo0.6O6ed, CaO (PDF:
01-075-0264, 43e1001) was observed for SrCaFe1.6Mo0.4O6ed, whilst
SrCaFe1.2Mo0.8O6ed exhibited a Ca2Fe2O5 (PDF: 01-071-2108,
38e408) impurity phase. GSAS analysis,Table 2, demonstrated a non-linear variation in lattice parameters likely due to the forma-tion of the various secondary phases. GSAS plots of SrCaFe1þxMo1exO6ed, x¼0.2, 0.4 and 0.6 after oxidation and
re-reduction of the samples reduced in 5% H2/Ar at 1200C as shown
inFig. 9. The lack of redox stability of these materials further re-duces any possible utility of these materials for SOFC application.
4. Conclusion
Introduction of calcium to Sr2Fe1þxMo1exO6ed(x¼0.2, 0.4, 0.6)
was not successful in simultaneously improving the conductivity and stability of these compounds, with a significant reduction in the formability observed with increasing calcium content. Potas-sium substitution into Sr2Fe1þxMo1exO6ed(x¼0.2, 0.4, 0.6) with
the intention of increasing the formability and ionic conductivity was also unsuccessful, with no notable formability improvements observed.
Redox cycling of SrCaFe1þxMo1exO6ed(x¼0.2, 0.4, 0.6)
dem-onstrates a strong dependence on high temperature reduction to achieve high conductivities, with re-reduction at lower tempera-tures attaining between 0.1% and 58.4% of the initial conductivity observed after high temperature reduction. The conductivity of SrCaFe1.2Mo0.8O6edin 5%H2/Ar between 300 C and 500C was
[image:7.595.316.558.522.718.2]around 73.5 Scm1. The reliance of these compounds on high
Fig. 7.Conductivity of SrCaFe1þxMo1exO6ed, x¼0.2 (a), x¼0.4 (b) and x¼0.6 (c), in 5% H2/Ar after reduction at 1200C in 5% H2/Ar (black), in air after re-oxidation of the sample reduced at 1200C in 5% H2/Ar (red) and in 5% H2/Ar using the re-oxidised sample (blue).
Fig. 8.XRD patterns of SrCaFe1þxMo1exO6ed(x¼0.2, 0.4 and 0.6) after re-oxidation and re-reduction of the samples reduced in 5% H2/Ar at 1200C.
temperature reduction is expected to limit their utility as SOFC anode materials, as the vulnerability to oxidation can have disas-trous consequence for fuel cell durability. As the redox stability of
[image:8.595.34.555.94.368.2]these materials was observed to increase with increasing iron content, further investigation into strontium ferrite materials was deemed to be a suitable avenue for further investigations.
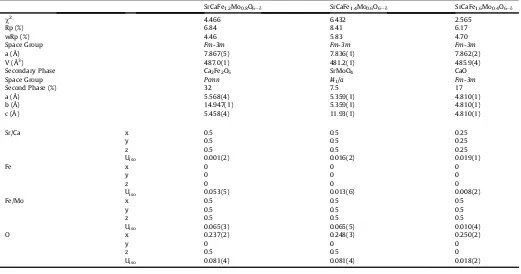
Table 2
Rietveld refinement and lattice parameters from GSAS refinement of SrCaFe1þxMo1exO6ed(x¼0.2, 0.4, 0.6) after re-oxidation and re-reduction at 700C in 5% H2/Ar of the compounds previously reduced at 1200C in 5% H2/Ar.
SrCaFe1.2Mo0.8O6ed SrCaFe1.4Mo0.6O6ed SrCaFe1.6Mo0.4O6ed
c2 4.466 6.432 2.565
Rp (%) 6.84 8.41 6.17
wRp (%) 4.46 5.83 4.70
Space Group Fm-3m Fm-3m Fm-3m
a (Å) 7.867(5) 7.836(1) 7.862(2)
V (Å3) 487.0(1) 481.2(1) 485.9(4)
Secondary Phase Ca2Fe2O5 SrMoO4 CaO
Space Group Pcmn I41/a Fm-3m
Second Phase (%) 32 7.5 17
a (Å) 5.568(4) 5.359(1) 4.810(1)
b (Å) 14.947(1) 5.359(1) 4.810(1)
c (Å) 5.458(4) 11.93(1) 4.810(1)
Sr/Ca x 0.5 0.5 0.25
y 0.5 0.5 0.25
z 0.5 0.5 0.25
Uiso 0.001(2) 0.016(2) 0.019(1)
Fe x 0 0 0
y 0 0 0
z 0 0 0
Uiso 0.053(5) 0.013(6) 0.008(2)
Fe/Mo x 0.5 0.5 0.5
y 0.5 0.5 0.5
z 0.5 0.5 0.5
Uiso 0.065(3) 0.065(5) 0.010(4)
O x 0.237(2) 0.248(3) 0.250(2)
y 0 0 0
z 0.5 0.5 0
[image:8.595.40.550.123.660.2]Uiso 0.081(4) 0.081(4) 0.018(2)
Acknowledgements
The authors thank EPSRC Flame SOFCs (EP/K021036/1), UKeIndia Biogas SOFCs (EP/I037016/1) and SuperGen Fuel Cells (EP/G030995/1) projects for funding. One of the authors (Cowin) thanks ScotChem SPIRIT scheme for support of his PhD study.
References
[1] Y.-H. Huang, R.I. Dass, Z.-L. Xing, J.B. Goodenough, Science 312 (2006) 254e257.
[2] Q. Liu, X.H. Dong, G.L. Xiao, F. Zhao, F.L. Chen, Adv. Mater. 22 (2010) 5478e5482.
[3] S.W. Tao, J. Canales-Vazquez, J.T.S. Irvine, Chem. Mater. 16 (2004) 2309e2316. [4] S.W. Tao, J.T.S. Irvine, J. Mater. Chem. 12 (2002) 2356e2360.
[5] S.W. Tao, J.T.S. Irvine, Nat. Mater. 2 (2003) 320e323.
[6] P. Zhang, Y.-H. Huang, J.-G. Cheng, Z.-Q. Mao, J.B. Goodenough, J. Power Sources 196 (2011) 1738e1743.
[7] L. Zhang, Q. Zhou, Q. He, T. He, J. Power Sources 195 (2010) 6356e6366. [8] S. Vasala, M. Lehtimaki, Y.H. Huang, H. Yamauchi, J.B. Goodenough,
M. Karppinen, J. Solid State Chem. 183 (2010) 1007e1012.
[9] A. Atkinson, S. Barnett, R.J. Gorte, J.T.S. Irvine, A.M. McEvoy, M. Mogensen, S.C. Singhal, J. Vohs, Nat. Mater. 3 (2004) 17e27.
[10] P.I. Cowin, C.T.G. Petit, R. Lan, J.T.S. Irvine, S.W. Tao, Adv. Energy Mater. 1 (2011) 314e332.
[11] G. Xiao, Q. Liu, X. Dong, K. Huang, F. Chen, J. Power Sources 195 (2010)
8071e8074.
[12] P.I. Cowin, R. Lan, C.T.G. Petit, S.W. Tao, Solid State Sci. 46 (2015) 62e70. [13] A.C. Larson, R.B.V. Dreele, General Structural Analysis System, Los Alamos
National Laboratory Report LAUR, 1994, p. 86.
[14] S.W. Tao, J.T.S. Irvine, J. Electrochem. Soc. 151 (2004) A252eA259. [15] C.T. Petit, R. Lan, P.I. Cowin, J.T. Irvine, S.W. Tao, J. Mater. Chem. 21 (2011)
8854e8861.
[16] C.T.G. Petit, R. Lan, P.I. Cowin, J.T.S. Irvine, S.W. Tao, J. Mater. Chem. 21 (2011) 525e531.
[17] P.I. Cowin, R. Lan, L. Zhang, C.T.G. Petit, A. Kraft, S.W. Tao, Mater. Chem. Phys. 126 (2011) 614e618.
[18] J.A. Alonso, M.T. Casais, M.J. MartAnez-Lope, J.L. MartAnez, P. Velasco, A. Muoz, M.T. FernAndez-Daaz, Chem. Mater. 12 (1999) 161e168.
[19] G.Y. Liu, G.H. Rao, X.M. Feng, H.F. Yang, Z.W. Ouyang, W.F. Liu, J.K. Liang, J. Alloys Compd. 353 (2003) 42e47.
[20] Q. Liu, G.L. Xiao, T. Howell, T.L. Reitz, F.L. Chen, ECS Trans. 35 (2011) 1357e1366.
[21] D. Niebieskikwiat, R.D. Sanchez, A. Caneiro, L. Morales, M. Vasquez-Mansilla, F. Rivadulla, L.E. Hueso, Phys. Rev. B 62 (2000) 3340e3345.
[22] R.S. Liu, T.S. Chan, S. Mylswamy, G.Y. Guo, J.M. Chen, J.P. Attfield, Curr. Appl. Phys. 8 (2008) 110e113.
[23] C. Zener, Phys. Rev. 82 (1951) 403e405. [24] A. Rosencwaig, Phys. Rev. 181 (1969) 946e948.
[25] Y. Yasukawa, J. Lindan, T.S. Chan, R.S. Liu, H. Yamauchi, M. Karppinen, J. Solid State Chem. 177 (2004) 2655e2662.
[26] P.W. Anderson, Phys. Rev. 109 (1958) 1492e1505. [27] R. Allub, B. Alascio, Phys. Rev. B 55 (1997) 14113e14116.