warwick.ac.uk/lib-publications
A Thesis Submitted for the Degree of PhD at the University of Warwick
Permanent WRAP URL:
http://wrap.warwick.ac.uk/96719
Copyright and reuse:
This thesis is made available online and is protected by original copyright. Please scroll down to view the document itself.
Please refer to the repository record for this item for information to help you to cite it. Our policy information is available from the repository home page.
Advancing the applicability of absolute implicit measures:
Using the Simple Implicit Procedure (SIP) to measure
responses to pathogen threats
.by
Brian O’Shea
B.A., National University of Ireland, Galway, 2010 M.Sc., London School of Economics and Political Science, 2012
A thesis submitted in partial fulfilment of the requirements for the degree of
Doctor of Philosophy in Psychology
University of Warwick, Department of Psychology
Table of Contents
Acknowledgements ... iv
Declaration ... vi
Inclusion of Published Work ... vii
Summary ... ix
Abbreviations ... x
Tables ... xi
Figures... xiii
Chapter 1: Introduction ... 1
Abstract ... 2
Origins of research into implicit social cognition ... 3
Unobtrusive and indirect research methods ... 5
Selective attention and implicit memory ... 6
The development of implicit measures ... 8
What is an implicit measure? ... 9
Limitations of existing implicit measures. ... 11
Implicit and explicit correlations and predicting behaviour ... 13
Theoretical basis of implicit measures ... 16
Overview of the thesis ... 18
Chapter 2: Disease rates are associated with racial prejudice across the US and the world .... 21
Abstract ... 22
Introduction ... 23
Parasite stress theory (PST) ... 23
Present study ... 28
Study 1 (US) and Study 2 (World) ... 29
Method ... 29
Results ... 33
Study 3 ... 38
Method ... 38
Results ... 41
Discussion ... 43
Chapter 3: Measuring implicit attitudes: A positive framing bias flaw in the Implicit Relational Assessment Procedure (IRAP) ... 46
Abstract ... 47
Introduction ... 48
Framing effects and language biases ... 53
Present study ... 55
Method ... 56
Results ... 62
Discussion ... 70
Chapter 4: The Simple Implicit Procedure (SIP): A new method for measuring implicit cognition ... 78
Abstract ... 79
Associative versus propositional measures of implicit cognition ... 81
Limitations of the IRAP ... 84
The Simple Implicit Procedure: SIP ... 87
Overview of studies ... 91
Study 1 ... 91
Method ... 94
Results ... 100
Discussion ... 114
Study 2 ... 116
Method ... 117
Results ... 120
Discussion ... 128
Study 3 ... 129
Method ... 131
Results ... 133
Discussion ... 137
General discussion ... 137
Chapter 5: Some words are more like pictures: Word type response biases in reaction time tasks... 144
Abstract ... 145
Introduction ... 146
Overview ... 147
Study 1 ... 148
Method ... 149
Results ... 150
Discussion ... 152
Study 2 ... 152
Results ... 156
Discussion ... 158
Study 3 ... 158
Method ... 158
Results ... 159
Discussion ... 161
General discussion ... 161
Chapter 6: Disgust versus fear: Using the SIP to measure racial prejudice... 164
Abstract ... 165
Introduction ... 166
Present study ... 169
Method ... 170
Results ... 177
Discussion ... 185
Chapter 7: Concluding remarks and future directions ... 191
References ... 202
Appendix 1: Chapter 2 ... 241
Appendix 2: Chapter 3 ... 257
Appendix 3: Chapter 4 ... 267
Appendix 4: Chapter 5 ... 274
Acknowledgements
My ideas, experimental rigour, coding abilities and cogency have been nurtured and constantly pushed to new heights I never thought I could attain, by my two wonderful supervisors, Gordon and Derrick. I am forever indebted to you for imparting so much of your wisdom. Thank you.
This PhD thesis would not have been possible without the generous support from the Psychology Department at the University of Warwick. I must also acknowledge the Experimental Psychological Society, the European Association of Social Psychologists, the Society for the Psychological Study of Social Issues, the Society for Personality and Social Psychology, the British Psychological Society and the Psychology Postgraduate Affairs Group for funding to support data collection, study visits or disseminating my research at international conferences.
I would like to extend my gratitude to the Learning and Implicit Processes Lab at the University of Ghent, especially to Jan De Houwer for giving me a place to work and the excellent advice given. Maarten De Schryver also greatly assisted me with scraping data from online repositories. Kate Ratliff, Colin Smith and all their lab members at the University of Florida provided me with three months of great memories and valuable intellectual contributions to this thesis. GO GATORS.
participants who volunteered to take part in my research, especially those who had to repeat an implicit measure a number of times.
Declaration
Inclusion of Published Work
All the following publications and manuscripts under review were submitted during the period of my PhD registration. The copyright of the published papers resides with the publishers but the reproduction of the papers in this thesis is permitted under the terms of the Copyright agreement.
Sections of Chapters 2 and 6 were published in:
O’Shea, B. (2016). Parasites and their implications for social and cultural psychology.
PSYPAG Quarterly, 99, 30-34.
Chapter 2 is expected to be submitted for publication by mid-May:
O’Shea, B., Watson, D.G., Brown, G. D.A., & Fincher, C. L. (in preparation). Disease rates are associated with racial prejudice across the U.S. and the world.
Chapter 3 was published as:
O’Shea, B., Watson, D. G., & Brown, G. D. A. (2016). Measuring implicit attitudes: A positive framing bias flaw in the Implicit Relational Assessment Procedure (IRAP). Psychological Assessment, 28, 158-170.
Chapter 4 is expected to be submitted for publication before the end of the year.
O’Shea, B., Brown, G. D. A., De Houwer, J., & Watson D. G. (in preparation). The Simple Implicit Procedure (SIP): A new method of measuring implicit cognition.
Chapter 5 is expected to be submitted for publication before the end of August:
O’Shea, B., Watson D. G, & Brown, G. D. A. (in preparation). Some words are more like pictures: Word type response biases in reaction time tasks
Ideas from the following manuscripts also appear throughout the thesis:
O’Shea, B. (2015). Capitalism versus a new economic model: Implicit and explicit attitudes of protesters and bankers. Social Movement Studies, 14, 311-330.
with the Implicit Relational Assessment Procedure (IRAP).
Conway, J. G., Pogge, G., Redford, L., O’Shea, B., Klein, R. A., Ratliff, K. A. (under review).
Can carelessness be captured? Assessing careless responding in attitudes toward novel
Summary
In all areas of psychological research, particularly in the area of implicit cognition, investigations depend on the tools of measurement. A central aim of the work presented in this thesis was to improve the accuracy and usability of tools that measure implicit cognition. This development was situated in the context of parasite-stress theory (PST) and racial prejudice.
Chapter 1 explains the origins of research on implicit cognition and what makes a measure implicit. Chapter 2 introduces PST, which predicts that increased exposure to infectious diseases will lead to avoidance of, or disdain towards, out-groups because such avoidance will reduce the likelihood of contracting an illness. This prediction was confirmed for both implicit and explicit attitudes, using complementary correlational and experimental methodologies.
The findings reported in Chapter 3 indicate that participants remember positive statements better than they remember negative statements and hence display a Positive Framing Bias (PFB) in the Implicit Relational Assessment Procedure (IRAP). Chapter 4 introduces the Simple Implicit Procedure (SIP) which is user-friendly and is not subject to the PFB. Estimates of implicit attitudes obtained from the SIP correlate with explicit measures, provide increased specificity of where an individual’s implicit biases lie, have acceptable reliability and are not limited by practice/experience effects. The SIP can assist researchers in devising strategies aimed at understanding and ameliorating the precise mechanisms driving prejudice.
Chapter 5 describes how using nouns, verbs or adjectives in implicit measures can affect outcomes. In Chapter 6, the SIP was used to show that females’ racial biases remain stable over time, even when primed with diseases. Males appear to be particularly susceptible to expressing increased prejudice when primed with disease images.
In summary, this thesis identifies various response biases that can greatly influence the results obtained from measures of implicit attitudes. Recommendations for overcoming these biases are described.
Abbreviations
BF Bayes Factor
BIAT Brief Implicit Association Test BIS Behavioural Immune System GNAT Go/No-Go Association Task IAT Implicit Association Test
IRAP Implicit Relational Assessment Procedure NHST Null Hypothesis Significance Testing PFB Positive Framing Bias
PST Parasite Stress Theory SIP Simple Implicit Procedure
SC-IAT Single Category Implicit Association Test SPFT Sorting Paired Features Task
ST-IAT Single Target Implicit Association Test RRT Relational Responding Task
RT Reaction Time
Tables
Table 2.1 ... 26
Table 2.2 ... 34
Table 2.3 ... 35
Table 2.4 ... 37
Table 4.1 ... 95
Table 4.1 ... 132
Table 4.3 ... 134
Table 4.4 ... 136
Table 5.1 ... 150
Table 5.2 ... 154
Table 5.3 ... 155
Table 6.1 ... 172
Table 6.2 ... 184
Table S2.1 ... 244
Table S2.2 ... 245
Table S2.3 ... 246
Table S2.4 ... 247
Table S2.5 ... 248
Table S2.6 ... 249
Table S2.7 ... 250
Table S2.8 ... 251
Table S2.9 ... 252
Table S2.10 ... 254
Figures
Figure 2.1 ... 42
Figure 3.1 ... 51
Figure 3.2 ... 66
Figure 3.3 ... 68
Figure 3.4 ... 69
Figure 4.1 ... 83
Figure 4.2 ... 89
Figure 4.3 ... 90
Figure 4.4 ... 105
Figure 4.6 ... 109
Figure 4.7 ... 112
Figure 4.8 ... 122
Figure 4.9 ... 123
Figure 4.10 ... 125
Figure 4.11 ... 127
Figure 4.12 ... 135
Figure 5.1 ... 151
Figure 5.2 ... 157
Figure 5.3 ... 160
Figure 6.1 ... 174
Figure 6.2 ... 177
Figure 6.3 ... 180
Figure 6.4 ... 181
Figure S2.1 ... 255
Figure S2.2 ... 256
Figure S3.1 ... 266
Abstract
Origins of research into implicit social cognition
Most psychologists agree that to gain a comprehensive understanding of an individual’s behaviour one needs knowledge not only of the external contexts in which an individual is situated but also of their internal psychological attributes (i.e., attitudes, stereotypes and personality traits). The cognitive revolution of the 1960s and 70s challenged behaviourism’s grip on psychology and restored the scientific respectability of the study of internal psychological processes (Miller, 2003). Without this impetus, the study of implicit1 cognition and investigations into the importance of unconscious/unexpressed biases influencing behaviour could have been further delayed.
The prominence in social psychology of the study of individuals’ attitudes was apparent as far back as the 1930s, when George Allport (1935), described attitudes as the “most distinctive and indispensable concept” in the discipline. In the 1940s the behaviourist Leonard Doob (1947, p.136) defined an attitude as “an implicit, drive-producing response considered socially significant in the individual's society”. It was generally accepted, albeit implicitly, that attitudes were influenced by unconscious mechanisms (see Greenwald & Banaji, 1995). This (implicit) acceptance was likely due to psychoanalytic theory according to which attitudes could be influenced by unconscious processes. Although psychologists often want to dissociate
1 The term “implicit” is often used as a synonym for other labels such as “unconscious”,
themselves from Sigmund Freud’s controversial and often unfalsifiable ideas, he was one of the first individuals to bring the idea of the unconscious to the mainstream (Freud, 1915, 2005).
Researchers aimed to measure attitudes using more objective methods such as questionnaires. Nevertheless, the near-universal use of self-report questionnaires throughout social psychology’s past has led to numerous problems. One of the major problems was construct validity weaknesses, as seen by the lack of correspondence between attitudes and behaviour (Greenwald, 1990, see also Nisbett & Wilson, 1977). For example, LaPiere (1934) reported that when he visited 251 accommodation venues with a Chinese couple, only one venue refused them admission. Following these visits, letters were sent to all 251 venues asking for a response to the question “Will you accept members of the Chinese race as guests in your establishment?” and over 90% responded that they would not. Regardless of the limitations of the study, (e.g., the Chinese couple was accompanied by an individual in a high-status profession; the person rejecting the letter request may have been different from the person who accepted their face to face request), LaPiere’s study emphasises the values of using unobtrusive/indirect2 research methods instead of confining oneself to explicit self-reports (direct measures). Sheeran (2002) provides a more recent review of the relationship between attitudes (intentions) and behaviour.
2 The terms “indirect” and “direct” are often used to describe the procedural characteristics of
a measurement procedure, while the terms “implicit” and “explicit” are often used to describe the psychological features or attributes assessed by measurement procedures. These
Unobtrusive and indirect research methods
“Unobtrusive” refers to methods in which participants are generally unaware that their behavioural responses are under investigation, while the term “indirect” refers to when participants are aware their responses are being monitored but it is unclear exactly which aspect of their behaviour is being assessed (Banaji & Greenwald, 2016). In the 1970’s, two social forces made unobtrusive research methods both more appealing and more popular: (1) The rise in the scientific study of prejudice across the US due to racial tensions, and (2) the growing realisations that participants often respond in a socially desirable manner when making explicit self-reports (Banaji & Greenwald, 2016; Jones & Sigall, 1971). The first two successful uses of unobtrusive methods relating to racial prejudice showed that when a black or white individual using a telephone called looking for help, white callers were more likely to receive assistance, and when an open unsent student application with a portrait photograph attached was left at an airport telephone booth, participants we more likely to voluntarily submit applications for the white students (Benson, Karabenick, & Lerner, 1976; Gaertner & Bickman, 1971; for a review of unobtrusive methods see Crosby, Bromley, & Saxe, 1980 and for a recent example of the unobtrusive technique showing that white people offer less help to black relative to white individuals in an emergency situation, see Kunstman & Plant, 2008).
measure individual differences because asking participants to fill out questionnaires or demographic information would rouse suspicions. Indirect measures, such as implicit measures, were developed to overcome the limitation of unobtrusive methods not assessing individual differences.
Selective attention and implicit memory
Research relating to both selective attention and implicit memory greatly influenced the development of research into implicit social cognition (Payne & Gawronski, 2010). With respect to selective attention, a key distinction was one between controlled and automatic/involuntary modes of information processing (e.g., Shiffrin & Schneider, 1977). For example, our attention will be instantly drawn if we detect words of importance originating from unattended sources, such as hearing one’s name (Moray, 1959). The development of sequential priming techniques (e.g., Devine, 1989; Dovidio, Evans, & Tyler, 1986; Fazio, Jackson, Dunton, & Williams, 1995; Gaertner & McLaughlin, 1983) was strongly influenced by the selective attention literature (i.e., weakly learned associations need cognitive effort to retrieve but strong associations will be activated automatically)3. These sequential priming measures did however suffer from low reliability and produced small effect sizes (Payne & Gawronski, 2010), and the existence of these weaknesses could explain the popularity of other implicit measures (see below).
Research on implicit memory pioneered by Jacoby and colleagues (e.g. Jacoby, Toth, Lindsay, & Debner, 1992) (for review see Schacter, Chiu, & Ochsner, 1993) strongly
3 Since the focus of this thesis is not related to priming measures to estimate an individual’s
influenced Greenwald and Banaji's (1995) seminal paper on implicit cognition (see also Banaji, 2001). Essentially, studies of implicit memory showed that participants found it easier to perceive stimuli that they had previously seen (perceptual fluency) but attributed this ease to characteristics of the stimulus, rather than to the recent past encounter. These ideas led Greenwald and Banaji (1995) to coin the term “implicit cognition” and define it as “An implicit
C is the introspectively unidentified (or inaccurately identified) trace of past-experience that mediates R. In this template, C is the label for a construct (such as attitudes), and R names the category of responses (such as object evaluative judgements) assumed to be influenced by that construct” (p. 5). Their review focused on how implicit cognition was specifically related to attitudes, stereotypes and the self, and this relationship is also a major focus of this thesis.
The development of implicit measures
Greenwald and Banaji (1995) asserted that the measurement of individual differences in implicit cognition is likely to be possible and described judgement latency (i.e., reaction time (RT)) measures as a potentially fruitful avenue to pursue this goal. They predicted that “when such measures become available, there should follow the rapid development of a new industry of research on implicit cognitive aspects of personality and social behaviour” (p. 20). Within three years, the same authors developed and published the first and still most popular RT task that aims to measure implicit attitudes, stereotypes and self-concept at the individual level. The measure was called the Implicit Association Test (IAT; Greenwald, McGhee, & Schwartz, 1998) and precisely as they predicted, this task led to an acceleration in research into implicit cognition, with the area being described as “one of the liveliest and most active research areas in social psychology” (Payne & Gawronski, 2010, p. 9). The initial IAT publication has to date (July 2017) been cited almost 9,000 times. Development of the IAT to run online through Project Implicit (https://implicit.harvard.edu/implicit/), the world’s largest online virtual laboratory greatly accelerated the speed at which the IAT could be validated (e.g., Greenwald, Nosek, & Banaji, 2003; Greenwald & Nosek, 2001; Nosek et al., 2007; Nosek, Banaji, & Greenwald, 2002; Nosek, Greenwald, & Banaji, 2007) .
negatively valenced words4, and must sort the items using the correct keypress. In one of the
two critical blocks, participants should press the “E” key on a computer keyboard if a positive word or a picture of a young person appears and press the “I” key if a negative word or a picture of an old person appears (congruent block). In the other critical block, participants should press “E” if a positive word or a picture of an old person is shown and they must press the “I” key for a negative word or a picture of a young person (incongruent block).
This task aims to measure biases participants have in associating concepts (old and young) with valenced words. The stronger the association, the more natural the sorting task will feel and hence, result in faster responses (congruent block), while weaker associations will result in a slowing down of processing, due to the need to make use of unaccustomed pairings in memory (incongruent block; Greenwald et al., 2002). Rather than using positive and negative valenced words to measure attitudes, stereotypical words could be used instead (e.g., healthy, lively, frail, slow, etc.) to measure stereotypes that individuals have.
What is an implicit measure?
Currently, the term ‘implicit social cognition’ is generally used to refer to research in social psychology that uses computerised RT measurement instruments to infer an individual’s psychological attributes (i.e., attitudes, stereotypes, self-esteem, etc.) without asking an individual to report their psychological attributes directly (Hahn & Gawronski, 2015). Implicit measures have been defined as “the outcome of a measurement procedure that results from automatic processes by which the to-be-measured attribute causally determines the outcome”
4 Throughout the thesis, “positively valenced words” will be used interchangeably with
“positive words”. Examples of positive words include, happy, joy, love. Likewise,
(De Houwer, Teige-Mocigemba, Spruyt, & Moors, 2009, p. 347). Automaticity has been argued to be one of the core features of an implicit measure and occurs when the impact of the “to be measured” attribute on an individual’s responses is uninfluenced by certain goals, substantial cognitive resources, awareness or substantial time (Bargh, 1994; De Houwer, 2006; De Houwer & Moors, 2012). Therefore, quick and accurate reactions to stimuli are necessary to limit an individual’s ability to exercise strategic control over their responses. This automaticity aspect or feature distinguishes implicit measures from traditional instruments that rely on explicit self-reports (Gawronski & De Houwer, 2014). Consequently, the speed or accuracy with which an individual responds to or associates stimuli in implicit measures is used to infer their psychological attributes (De Houwer, 2009; De Houwer, 2003; Nosek & Banaji, 2001). With implicit measures (and also explicit measures), an inference must inevitably be used because it is not possible to directly observe psychological attributes.
(e.g., Nosek & Smyth, 2007). Correlational analysis will be mainly used to validate the new implicit measure introduced in this thesis.
Limitations of existing implicit measures.
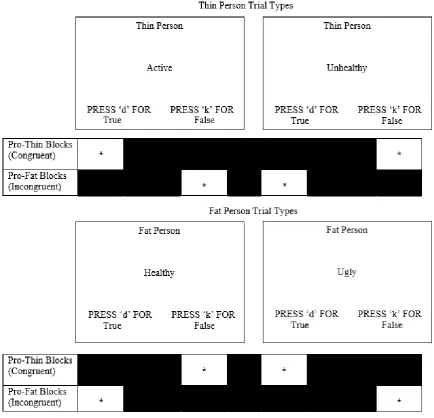
The period following the IAT’s first publication has been described as the “age of measurement” in social psychology, due to the development of various implicit measures each of which aimed to measure psychological attributes accurately (Nosek, Hawkins, & Frazier, 2011). New implicit measures were developed mainly because of limitations in the IAT. But these new measures were further challenged by the need to preserve the strong psychometric properties that the IAT achieves. The brief IAT (BIAT) was developed to give researchers a tool that could be used to measure implicit bias in a shorter amount of time. However, like the IAT, the BIAT only measures implicit biases relatively (e.g., attitudes to fat people relative to attitudes to thin people). It is therefore impossible to determine using these IATs whether this bias is the result of a strong/weak pro-thin bias, a strong/weak anti-fat bias, or some combination of the two (see Blanton & Jaccard, 2006; Roddy, Stewart, & Barnes-Holmes, 2010, 2011). Likewise, the IAT cannot be used to determine how interventions that aim to increase or reduce implicit biases have their effect (e.g., a difference in implicit attitudes could be reduced by acting on the “Thin Person” category, the “Fat Person” category, or both; see Lai et al., 2014).
To address these problems, RT tools that attempt to measure absolute attitudes and do not require a relative comparison to another group have been developed. For example, the go/no-go (Nosek & Banaji, 2001) and the extrinsic affective Simon task (De Houwer, 2003b) both claim to measure implicit attitudes non-relatively/absolutely. However, both suffer from problems ranging from a high level of task difficulty to low reliability (Bar-Anan & Nosek, 2014; De Houwer & De Bruycker, 2007). Variations of the IAT that could be described as single concept IATs, such as the Single Target/Category IAT (e.g., Bluemke & Friese, 2008; Karpinski & Steinman, 2006) have, however, shown promise for measuring absolute implicit attitudes. The Implicit Relational Assessment Procedure (IRAP: Barnes-Holmes et al., (2006)) is another absolute implicit measures, but see Chapter 3 for limitations of the IRAP’s assessment of absolute implicit attitudes.
The Single-Block IAT (Sarah Teige-Mocigemba, Klauer, & Rothermund, 2008), the Recoding Free IAT (Klaus, Rothermund, Teige-Mocigemba, Gast, & Wentura, 2009) and the Sorting Paired Features Task (Bar-Anan, Nosek, & Vianello, 2009) were developed to overcome the problem of block structure influencing the accurate measurement of implicit biases. For example, the order in which a participant completes the compatible and incompatible blocks can influence IAT score (see Nosek, et al., 2007; Teige-Mocigemba, Klauer, & Sherman, 2010). Efforts have been made to reduce the order effect in the IAT (Nosek, Greenwald, & Banaji, 2005) but it is nevertheless difficult to determine the magnitude of order effects at the individual level and hence it is not possible to fully remove effects of this confound (De Houwer et al., 2009). Another reason for removing the block structure in the IAT was that the salience of the items within a block, not the associations between the items, can lead to an IAT effect (see Rothermund & Wentura, 2001, 2004).
magnitude of IAT effects. If IAT effects can be caused by processes other than just mental associations in memory, and if it is not clear which processes influence the IAT effect, then the meaning of the effect becomes ambiguous (see Fiedler, Messner, & Bluemke, 2006).There is increasing evidence that findings relating to implicit measures can reflect several processes, such as salience of the stimuli (e.g., Houben & Wiers, 2006; Klaus Rothermund, Wentura, & De Houwer, 2005), similarity between the stimuli (De Houwer, Geldof, & De Bruycker, 2005) and cognitive ability of participants (e.g., Back, Schmukle, & Egloff, 2005; McFarland & Crouch, 2002). Greenwald et al.'s (2003) D-algorithm has greatly reduced the problem relating to cognitive ability because it accounts for an individual’s variation in responding across the IAT. More research is needed to explain the relative impact that salience and similarity can have on IAT scores (De Houwer et al., 2009, see Conrey, Sherman, Gawronski, Hugenberg, & Groom, 2005, and Klauer, Voss, Schmitz, & Teige-Mocigemba, 2007, for methods that can account for the influence of these various processes). IAT researchers have acknowledged these problems, emphasising that no measure is perfect but yet the measure can still be useful (Greenwald & Sriram, 2010): see Fazio and Olson (2003), Gawronski (2009), Gawronski and De Houwer (2014), and Nosek et al. (2011), for reviews and lists of other implicit measures that have received less attention.
Implicit and explicit correlations and predicting behaviour
been shown to be higher for affective responses (emotions and feelings about the attitude object) on explicit measures compared to more cognitive responses (thoughts and beliefs about the attitude object) on explicit measures (Smith & Nosek, 2011, for a review see Spence & Townsend, 2008).
Reducing the time allocated for a participant to think about their response on the explicit measures produces higher correlations between implicit and explicit measures (Ranganath, Smith, & Nosek, 2008). Another crucial aspect to consider is that implicit and explicit correlations will be stronger for attitudes that are more familiar or beliefs that are important or well elaborated in memory, as opposed to ones that are rarely thought about or believed to be irrelevant (Nosek, 2007). Conceptual correspondence and structural fit between implicit and explicit measures increases the correlations between these two measures. Additionally, due to averaging out noise and the inclusion of more trials, relative scores (e.g., IAT scores) rather than absolute scores (e.g., SC-IAT scores) show stronger implicit and explicit correlations (Hofmann, Gawronski, Gschwendner, Le, & Schmitt, 2005; Payne, Burkley, & Stokes, 2008).
Lack of a perfect correlation between implicit and explicit measures has been cited as evidence for the distinct constructs that these measures assess (Greenwald & Nosek, 2008; Nosek & Smyth, 2007). Yet the divergence could also be due to a number of other factors (e.g., awareness, need for cognition, structural features, for a review see Hofmann, Gschwendner, Nosek, & Schmitt, 2005). Importantly, much research demonstrates the practical value of implicit measures for predicting human behaviour (Perugini, Richetin, & Zogmaister, 2010), especially spontaneous behaviours (for review see Friese, Hofmann, & Schmitt, 2009) and shows that implicit measures can provide information that is distinct from explicit measures (Nosek et al., 2011).
separate patterns with implicit measures, but not explicit measures uniquely predicting behaviour (2) additive patterns in which both implicit and explicit measures contribute to predicting behaviour, (3) double dislocation patterns where both measures uniquely predict different types of behaviour (4) moderation patterns where both measures predict behaviour under different conditions, (5) multiplicative patterns where both measures interactively predict behaviour. All these patterns have been shown in the literature. However, the boundary conditions specifying when each will occur are not thoroughly understood, making it difficult to make a priori predictions (Gawronski & De Houwer, 2014).
The most thorough evidence emphasising the value of implicit measures was provided by a meta-analysis of studies using the IAT, which showed it to predict stereotyping or racially prejudicial behaviour better (average r = .236) than did explicit self-report measures (average
r = .118; Greenwald, Poehlman, Uhlmann, & Banaji, 2009; see also Cameron, Brown-Iannuzzi, & Payne, 2012, relating to sequential priming). However, see Oswald, Mitchell, Blanton, Jaccard, and Tetlock (2013), for a more critical view of the predictive validity of the IAT. They showed that that IAT only weakly predicted racial attitudes and stereotypes (r = .148) and stated that “the IAT provides little insight into who will discriminate against whom” (p. 188). For a recent defence of the IAT's predictive abilities see Greenwald, Banaji, and Nosek (2015).
while explicit measures are better for those with a preference for rational thinking styles (e.g., Richetin, Perugini, Adjali, & Hurling, 2007).
Other examples of the usefulness of implicit measures for predicting behaviour include: (1) countries with stronger implicit biases of associating males rather than females with science and maths, predict larger performance gaps between males and females in these disciplines (Nosek et al., 2009), (2) those with low self-esteem on implicit measures exhibit various defensive behaviours (Jordan, Spencer, Zanna, Hoshino-Browne, & Correll, 2003) (3) more strongly associating the self with death prospectively predicted suicide ideation as well as suicide attempts (Nock et al., 2010; Nock & Banaji, 2007) and (4) higher implicit racial biases predicted increased job interview invitations to racial in-group members (Rooth, 2010). Importantly, neither implicit and explicit measures can be described as a “truer” measure of one’s beliefs, because both predict unique aspects of behaviour (Banaji, Nosek, & Greenwald, 2004). To clarify, explicit measures are generally better at predicting political preferences (Friese, Smith, Koever, & Bluemke, 2016) and consumer behaviour (Friese, Wänke, & Plessner, 2006), while implicit measures are particularly suited when addressing intergroup attitudes/interactions (Greenwald et al., 2009). The next section aims to explain why this may be the case.
Theoretical basis of implicit measures
explaining implicit and explicit correlations in the MODE model. In the APE model, however, cognitive consistency (i.e., rejecting affective racial biases in favour of more explicit egalitarian values) is an important factor in explaining implicit and explicit correlations (Brochu, Gawronski, & Esses, 2011; Gawronski, Peters, Brochu, & Strack, 2008).
The MODE model assumes that the same underlying representations are measured using direct and indirect methods, while the APE model assumes they are part of a distinct but mutually reinforcing processes (i.e., associative and propositional processes). The MODE model also assumes that deliberate processing reduces implicit and explicit correlations, while in the APE model deliberating on information that is consistent with an activated association (i.e., implicit bias) will increase implicit and explicit correlations (e.g., Galdi, Gawronski, Arcuri, & Friese, 2012; Peters & Gawronski, 2011). For a full review of the numerous dual process theories of human cognition see Chaiken and Trope (1999) and Strack and Deutsch (2004).
Early theorising around implicit attitude measures assumed that they provide direct access to stable evaluative representations that have their roots in long-term socialisation experiences (see Greenwald & Banaji, 1995). However, new evidence has shown that
causally influenced by extra-personal views (De Houwer et al., 2009).The term “implicit” has often been used synonymously with “unconscious” but one must ask the question: Are implicit measures uncovering unconscious representations? The available evidence challenges the notion that implicit measures offer a window into people’s unconscious processes (e.g., Gawronski, Hofmann, & Wilbur, 2006; Hahn & Gawronski, 2014). To clarify, the majority of participants in Monteith, Voils, and Ashburn-Nardo's (2001) study expressed that they found the incongruent block on the Race IAT (Black-Positive) more challenging, and they felt guilty about it to the extent that they attributed the bias to racial prejudice. Therefore, individuals appear to have much greater introspective access to their mental representation than was originally assumed (Payne & Gawronski, 2010). For example, across five different social groups, participants were surprisingly accurate when predicting their implicit biases (Hahn, Judd, Hirsh, & Blair, 2014), emphasising that participants can have introspective awareness of their implicit bias.
Of note, the mental processes that result in conscious experience for introspection to occur are largely a mystery, and similarly, our knowledge of what implicit measures measure is less mature than our knowledge about what implicit measures do (Nosek et al., 2011).
In summary, this introduction has highlighted some of the most relevant information related to implicit cognition because it is the central theme of this thesis. Almost every intellectual question in social psychology, and some outside it, have been shaped in some way by the methods and theories related to implicit social cognition (Payne & Gawronski, 2010).
Overview of the thesis
prejudice towards a racial out-group. The first two studies use Race IAT data and explicit self-reports made available through Project Implicit (secondary data), while the final study uses an experimental design to determine whether diseases are an important factor for increasing racial prejudice. These studies were limited in that the IAT can only report relative biases.
Chapter 3 presented the use of a recently developed implicit measure (IRAP) that aims to measure implicit biases towards separate categories (absolute biases) allowing the author to overcome the relative limitation of the IAT. However, further studies using the IRAP to measure racial biases after being primed with diseases had to be abandoned, because during testing a major flaw was discovered (a Positive Framing Bias: PFB) in the IRAP. This chapter explains why the PFB occurs and describes a comprehensive study of experimentally manipulating the PFB bias through framing techniques. The findings show that the IRAP overinflates positivity towards items and that experimenters could also inadvertently influence the estimates of implicit attitudes.
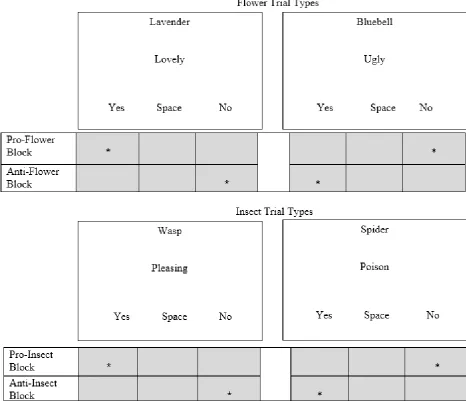
Chapter 4 introduces the Simple Implicit Procedure (SIP) which is a new measure designed to overcome the PFB limitation in the IRAP. This chapter presents three studies covering attitudes, stereotypes and self-concept with the aim of validating the SIP. A potential flaw in the SIP was detected and it occurs because participants were generally faster to press the affirming (“Yes”) than the negating (“No”) response key. A functional method to remove this affirming bias is developed and discussed.
Chapter 5 explains across three studies why an affirming bias occurs in the SIP. Also, this chapter identifies other response biases participants can have when completing implicit measures. Specifically, the impact of using nouns, verbs and adjectives on response times in RT tasks is addressed.
sampling limitations, sufficient data were collected only from white females. Biases remained stable over time and were explained in terms of tending and befriending responses and sexual strategies.
Chapter 2: Disease rates are associated
with racial prejudice across the US and
Abstract
What factors increase or decrease racial tensions? According to the contact hypothesis
Introduction
Facebook’s Mark Zuckerberg has recently pledged to give 99% of his wealth to charity (Goel & Wingfield, 2015). One of the primary uses of this money will be for curing diseases, which is a goal similar to that of the Bill and Melinda Gates Foundation (see
http://www.gatesfoundation.org/). One major reason for these investments is that infectious diseases have been the leading cause of death worldwide (Jones et al., 2008) throughout much of history. Because of this immense impact on human survival, it is likely that humans have developed strategies/mechanisms to minimise pathogen threat throughout evolution. One such strategy is an immunological response to salient threats. The immune system triggers a physiological response that is activated when a pathogen is detected (reactive response). Other strategies, such as hypervigilance towards out-groups and/or the strengthening of in-group ties (Brown, Fincher, & Walasek, 2016; Diamond, 1999; Reicher, Templeton, Neville, Ferrari, & Drury, 2016) reflect the operation of the behavioural immune system (BIS; proactive response)
which evolved to protect an individual from exposure to infectious diseases and potentially threatening stimuli (e.g., avoidance of decaying food or infected individuals, Murray & Schaller, 2016).
Parasite stress theory (PST)
Type 1 errors such as incorrectly identifying and responding to non-existent threats (Error Management Theory; Haselton & Nettle, 2006) especially for infection diseases signals because it could increase their chances of survival.
PST also predicts that when diseases are made more salient (e.g., by priming with pictures) people will express increase prejudice towards groups that are strongly associated with diseases (Duncan & Schaller, 2009; Park, Faulkner, & Schaller, 2003; Park, Schaller, & Crandall, 2007). Such predictions have been confirmed. For example, participants in a disease priming condition showed increased prejudice (often on implicit measures such as the IAT) towards the elderly, people with physical disabilities and those who are obese compared to a control slideshow (for a review see Murray & Schaller, 2016).
In addition, PST predicts that people will avoid, and express more negative attitudes towards, dissimilar others, such as people with foreign accents (Reid et al., 2012) or from distant regions (Faulkner, Schaller, Park, & Duncan, 2004; Navarrete & Fessler, 2006). These responses are based on the fact that people who look different (i.e., skin colour), sound different (i.e., accent, language) or have different cultural values (i.e., religion) are more likely to be from a different region and hence might have been exposed to novel diseases. Therefore, foreigners are likely to have increased immunity to some diseases that local people can become infected by and local people can also infect foreigners with diseases they themselves are immune to.
why do some people develop conservative belief systems while others develop values that are more liberal? Researchers have shown that differences in personality, moral foundations, genetic factors, family upbringing and motivated cognition, such as a need for certainty, can lead to different ideological beliefs. Unfortunately, none of these research themes point towards why individual differences exist in the first place (e.g., origins of genetic or personality differences associated with ideological differences; Brown, Walasek, & Mullett, 2016). Describing the ultimate causal factors explaining why overarching belief systems develop in the first place is a core goal of PST.
Table 2.1: Differences between Collectivistic and Individualistic countries taken from Thornhill & Fincher, 2014.
Collectivistic Individualistic
Developing countries
More conservative
Developed countries More liberal
More infectious disease Less infectious disease
More homicide Less homicide
In-group goals paramount Personal autonomy and self-fulfilment paramount Low cognitive ability (IQ) High cognitive ability (IQ)
More religious Less religious
Autocratic governance Democratic governance Stronger family ties Weaker family ties Low rate of innovation High rate of innovation
High conformity to tradition and norms Low conformity to tradition and norms Low socioeconomic status High socioeconomic status
Restricted/conservative female sexuality Unrestricted/liberated female sexuality
Greater distinctions between in and out-groups Fewer distinctions between in- and out-groups More out-group avoidance and racism (xenophobia) Less out-group avoidance and racism
High disgust sensitivity Low disgust sensitivity
Low openness to new experiences High openness to new experiences Closed-minded and unimaginative Creative and curious
Perceptions of a threatening and dangerous world Perceptions of a more secure world Intolerance of ambiguity Tolerance of ambiguity
Using epidemiological data and worldwide cross-national surveys of
individualism/collectivism, Fincher, Thornhill, Murray, and Schaller (2008) were the first to
find support for PST. They found that greater regional prevalence of pathogens strongly
correlated with cultural indicators of collectivism and negatively correlated with individualism.
Further evidence has shown that increased pathogen prevalence predicts regional variation
(both internationally and across U.S. states) of indicators of collectivism such as stronger
family ties, increased ethnocentrism as well as greater religious belief (Fincher & Thornhill, 2012). A potential reason for religious beliefs increasing under high pathogen stress is that they ensure strict adherence to behavioural norms that would reduce disease transmissions (e.g., no
premarital sex and not eating certain types of food). Premature death of loved ones, especially
children, is more likely in high parasite stress areas and religion has the potential to reduce
some of the torment this situation will induce.
Correlational evidence also shows that, across countries as well as U.S states, regions
with higher disease prevalence are associated with lower intelligence (Eppig, Fincher, & Thornhill, 2010; Eppig et al., 2011). The potential cause of this correlation is that during development the body has to distribute energy in the most effective way to ensure survival;
under high parasite stress, people are more likely to get exposed to an infection and
consequently energy would have to be devoted to driving the immune system response, which
would in turn reduce the energy available for other areas of development (i.e., cognitive
development).
Individualism has often been linked to increased economic growth and Gross Domestic
country’s GDP and economic growth. Importantly, mediation analysis revealed that the link between low disease rates and innovation was mediated by reductions in conforming behaviours. In collectivistic cultures (high parasite), deviating from the norm is greatly disapproved of and this conformity is believed to reduce creativity and innovation. Because social norms (e.g., hygiene and food preparation techniques; Murray & Schaller, 2016) help to reduce the transmission of infections, conforming to social norm likely had evolutionary advantages (Murray & Schaller, 2012).
Both correlational and experimental methods have shown that increased exposure to diseases leads to increases in conformity (e.g., Murray & Schaller, 2012). Furthermore, greater parasite prevalence leads to autocratic governance (Murray, Schaller, & Suedfeld, 2013) and increases (social) conservatism (for a review see Terrizzi, Clay, & Shook, 2014). Higher disease rates have also been shown to be associated with higher number of languages as well as the amount of distinct religions in regions (Fincher & Thornhill, 2008a, 2008b) which is believed to be due to groups’ unwillingness to engage with outsiders. Finally, parasites are believed to have an influence on personality and sexuality, resulting in more inhibitory behaviours (e.g., introversion, reduced openness and casual sex), as these decrease the potential for becoming infected with diseases (Schaller & Murray, 2008). Importantly, the correlational results reported above remain significant when controlling for potential confounding variables (e.g., human freedom, economic development, educational attainment, etc.).
Present study
out-groups. An advantage of examining implicit as well as explicit attitudes is that participants may behave in a socially desirable manner when reporting attitudes explicitly, which is especially problematic when socially sensitive topics are concerned (Greenwald et al., 2009). This study aimed to understand why being exposed to more black people increases white respondents’ anti-black/pro-white biases (Putnam, 2007; Rae et al., 2015; Taylor, 1998). We first created an exposure-to-whites index for each state. This index was the log of the ratio of number of white people to number of black people in the state, multiplied by an integration index.
In Study 2, we examined whether higher disease rates are associated with higher implicit and explicit anti-out-group/pro-in-group biases across 76 countries. We analysed only data from white participants because data were available from few black respondents. Estimates of average skin colour were used as a proxy for exposure to black people. In Study 3, we used an experimental design to test the hypothesised causal link between diseases and prejudice.
Study 1 (US) and Study 2 (World)
On the basis of PST (Thornhill & Fincher, 2014), we hypothesised that people living in regions with higher disease rates will express greater anti-out-group/pro-in-group biases even after exposure to out-groups is controlled for. In addition, we tested the prediction of the contact hypothesis (Pettigrew & Tropp, 2006) that white individuals exposed to people in countries with darker skin tone will show decreased implicit and explicit prejudice towards black people when holding disease rates constant.
Method
cross-country analysis was limited to white participants (N > 787,000) with a further restriction that at least 30 usable IAT scores and explicit responses were available within each country. These restrictions resulted in 76 countries included in the final analysis. The sample used data collected between 2006 and 2013.
We used standard IAT analytic procedures to remove inappropriate IAT scores (Greenwald et al., 2003). The algorithm removed participants who made errors on > 30% of trials and had reaction times of <300ms and/or >10,000ms on >10% of trials (approximately 2%). To facilitate reporting, we performed separate analysis on white (N > 702,000) and black respondents (N > 149,000) within the US (see Appendix 2 for a full description of demographics). The dataset we used is available for public use (https://osf.io/y9hiq/; Xu, Nosek, & Greenwald, 2014)
Materials
Implicit bias: All participants completed the Race IAT with “African American” and “European American” as the category labels and “Good” and “Bad” as the valence labels. These labels appeared at the top of the screen. The stimuli used included greyscale pictures of black and white individuals as well as positive (Glorious, Wonderful, Joy, Love, Peace, Pleasure, Laughter, Happy) and negative (Terrible, Evil, Horrible, Agony, Nasty, Awful, Failure, Hurt) words. These stimuli were presented successively to participants at the centre of their screen and on each trial participants were required to sort the stimulus into the appropriate category using the correct key press. If a correct response was given, the stimulus disappeared and a new stimulus appeared after 400ms. If an incorrect response was given, a red “X” appeared directly below the stimulus and both remained until the correct response was given.
if a “good” word or a picture of a black person was shown and pressed I key for a “bad” word or a picture of a white person. The order of the sorting task (i.e. black-good and white-bad first vs. black-bad and white-good first) was randomised across participants. The basic idea underlying the IAT is that participants will make faster and more accurate responses when those responses are congruent with their current beliefs than when they are not. Participants’ implicit biases were measured using IAT D scores(Greenwald et al., 2003). Positive D scores indicate an anti-black/pro-white attitude and negative D scores indicate an anti-white/pro-black attitude.
Bipolar Explicit bias: Participants used a 7 point Likert scale to respond to the question “Which statement best describes you?”: (1) I strongly prefer African Americans to European Americans – (4) I like European Americans and African Americans Equally – (7) I strongly prefer European Americans to African Americans.
Disease rates across US states and the world: Fincher & Thornhill, (2012) developed a measure of disease rates across the 50 US states. This measure aggregates all infectious diseases reported by the US Centers for Disease Control (CDC; available at www.cdc.gov) for the years 1993 to 2007 for each state, divides the number of diseases by state population, and transforms the result into a z-score. For the cross-country measure of disease rates, the World Health Organization’s (WHO), Infectious Disease DALY (Disability Adjusted Life Years) and non-zoonotic parasite prevalence (human-specific and multi-host disease transmission) within each country were standardised and then summed, producing a combined disease rates measure – see Fincher & Thornhill, (2012) for details and validation.
completion of high school, 1 = any educational accreditation after high school). For the US analysis, the state level controls included median income (logged), state inequality (Gini: higher scores = greater inequality), land population density per square mile, race exposure (high scores indicate greater white exposure, lower scores indicate greater black exposure) and whether a state was previously part of the Confederacy. Median income, inequality, population density and race exposure used the American Community Survey 5 year estimates (2008-2012). Based on previous methods of analysis (Alba, Rumbaut, & Marotz, 2005; Rae et al., 2015), we used the logged ratio of white people living in a state relative to black people. This ratio was then multiplied by 1-(state segregation/100) to create the race exposure estimate. State segregation scores ranged from 0 (complete integration) to 100 (complete segregation) where the value indicates the percentage of black people that would need to move for them to be distributed exactly like white people (Frey & Myers, 2005).
only 76 countries because the control variables did not have a value for every country in the analysis.
Analysis: Multilevel analysis was used due to the large sample size available and the many benefits it has over multiple regression (Pollet, Tybur, Frankenhuis, & Rickard, 2014). Multilevel analysis groups individual responses, which provides a much finer analysis because individuals’ variability in responding within a region is considered. Furthermore, demographic variables can act as individual level controls rather than having to use only state or country level controls. Participants were grouped by US state or country of residence depending on the analysis being conducted. The SPSS linear mixed model function was used and the model included a random intercept term at the US state level or the country level.
Results
Study 1 – Disease rates across US states
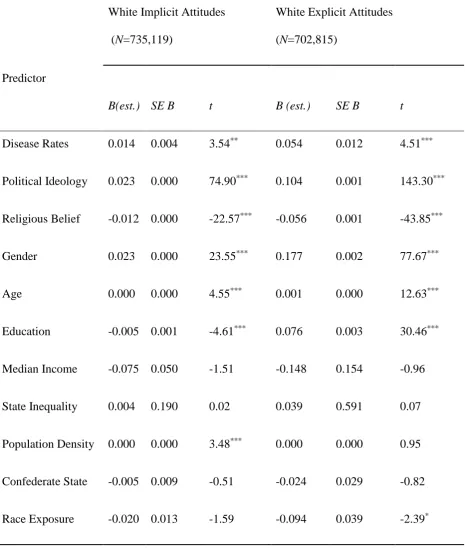
Table 2.2: Summary of Multilevel Analysis for Variables Predicting US State Level Implicit/Explicit Scores.
White Implicit Attitudes (N=735,119)
White Explicit Attitudes (N=702,815)
Predictor
B(est.) SE B t B (est.) SE B t
Disease Rates 0.014 0.004 3.54** 0.054 0.012 4.51*** Political Ideology 0.023 0.000 74.90*** 0.104 0.001 143.30*** Religious Belief -0.012 0.000 -22.57*** -0.056 0.001 -43.85*** Gender 0.023 0.000 23.55*** 0.177 0.002 77.67*** Age 0.000 0.000 4.55*** 0.001 0.000 12.63*** Education -0.005 0.001 -4.61*** 0.076 0.003 30.46*** Median Income -0.075 0.050 -1.51 -0.148 0.154 -0.96 State Inequality 0.004 0.190 0.02 0.039 0.591 0.07 Population Density 0.000 0.000 3.48*** 0.000 0.000 0.95 Confederate State -0.005 0.009 -0.51 -0.024 0.029 -0.82 Race Exposure -0.020 0.013 -1.59 -0.094 0.039 -2.39*
Table 2.3: Summary of Multilevel Analysis for Variables Predicting US State Level Implicit/Explicit Scores.
Note: Scores were coded such that higher numbers indicate a greater anti-black/pro-white bias. †p<.10, *p<.05, **p<.01, ***p<.001
Black Implicit Attitudes (N=155,038)
Black Explicit Attitudes (N=149,551)
Predictor
B (est.) SE B t B (est.) SE B t
Disease Rates -0.017 0.004 -3.93*** -0.050 0.012 -4.27*** Political Ideology -0.002 0.000 -2.43* 0.048 0.002 20.30***
This held for both implicit (t = -3.93, p < .001) and explicit attitudes (t = -4.27, p < .001). In contrast to what would be predicted by the contact hypothesis, white participants living in states where exposure to blacks is higher showed higher explicit anti-black/pro-white biases (t = -2.39, p = .022). Yet consistent with the contact hypothesis, black participants living in states where exposure to whites is higher showed weaker anti-white/pro-black biases (t = 2.66, p = .015). In Appendix 2, we present alternative analyses using different methods to estimate out-group exposure which largely support parasite-stress theory. In Appendix 2, we also discuss effects of the individual-level controls.
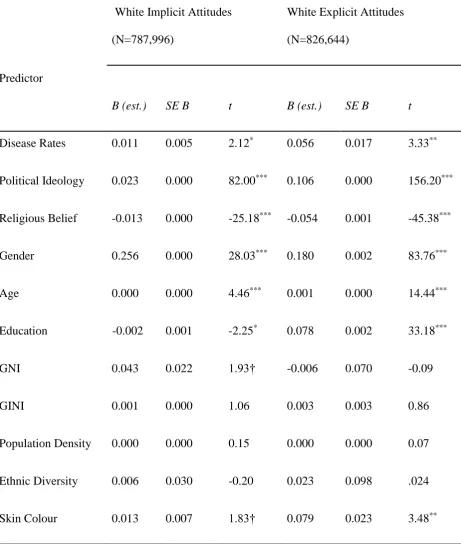
Study 2 – Disease rates across 76 countries
Table 2.4: Summary of Multilevel Analysis for Variables Predicting Country Level Implicit/Explicit Scores.
White Implicit Attitudes (N=787,996)
White Explicit Attitudes (N=826,644)
Predictor
B (est.) SE B t B (est.) SE B t
Disease Rates 0.011 0.005 2.12* 0.056 0.017 3.33** Political Ideology 0.023 0.000 82.00*** 0.106 0.000 156.20***
Religious Belief -0.013 0.000 -25.18*** -0.054 0.001 -45.38*** Gender 0.256 0.000 28.03*** 0.180 0.002 83.76*** Age 0.000 0.000 4.46*** 0.001 0.000 14.44*** Education -0.002 0.001 -2.25* 0.078 0.002 33.18*** GNI 0.043 0.022 1.93† -0.006 0.070 -0.09 GINI 0.001 0.000 1.06 0.003 0.003 0.86 Population Density 0.000 0.000 0.15 0.000 0.000 0.07 Ethnic Diversity 0.006 0.030 -0.20 0.023 0.098 .024 Skin Colour 0.013 0.007 1.83† 0.079 0.023 3.48**
Study 3
We hypothesised that white participants primed with disease images would show increased anti-black/pro-white bias compared to controls (participants primed with furniture and buildings). A terror threat priming condition was also included because previous research has shown that such priming can increase prejudice and conservative worldviews (Van de Vyver, Houston, Abrams, & Vasiljevic, 2016). This extra condition acted as a comparison to the disease condition and allowed us to test whether any threat to a person’s life increased prejudice or if the effect (if present) is specific to disease threats. Rather than using a full 15 item scale to measure participants’ perceived vulnerability to disease (PVD scale; Duncan, Schaller, & Park, 2009) we instead used a 5 item Private Body Conscious (PBC) scale. The (PBC) scale has previously been shown to moderate the effects of disgust (e.g., Petrescu & Parkinson, 2014; Schnall, Haidt, Clore, & Jordan, 2008).
Method
Participants were recruited through a social media platform dedicated to performing online surveys or experiments (see https://www.reddit.com/r/SampleSize/). All participation was voluntary, but each participant could view their implicit bias score at the end of the experiment which acted as an incentive. Data were gathered for slightly over a month (between 3rd March and 6th April, 2016). Overall, 525 participants completed the experiment. However,
74 were removed from the final analysis because “White” was not selected as their race. A further 57 were removed because either they did not respond correctly to the memory question (N=7), they had already previously completed the experiment (N=34), they selected “other” as their gender (N=12), their accuracy on the IAT was below 70% (N=2), or they responded faster than 300ms and/or slower than 10,000ms on >10% of the IAT trials (N=2).
threat condition (126 participants). 231 participants from the US completed the experiment; the remaining participants were mainly from large Western countries such as Canada, Australia and the UK. The mean age of the sample was 24.3 years (SD = 6.29), and 338 participants had at least a college diploma. The sample was mainly non-religious/slightly religious (M = 1.39,
SD = .81) and liberal (M = 2.54, SD = 1.48).
Materials
Demographic information: Participants’ gender, age, race, country of residence, state of residence if in the US, educational level, political ideology (1= Strongly Liberal to 7= Strongly Conservative) and religious belief (1= not at all religious to 4= strongly religious) were collected via an online questionnaire.
Private Body Conscious (PBC) scale (Miller, Murphy, & Buss, 1981) is a 5-item measure addressing participants’ awareness of internal physical sensations. Items included “I'm very aware of changes in my body temperature” and “I know immediately when my mouth or throat gets dry”. Each item was rated on a 6-point Likert scale ranging from 1 (strongly disagree) to 6 (strongly agree). The internal reliability of this scale was .62.
Disease, terror and control images: The disease images consisted of 30 images of mould, faeces and people with infections. 20 of the images were sourced from previous research that used pathogen primes (Schaller, Miller, Gervais, Yager, & Chen, 2010; Wu & Chang, 2012). 10 of these images had white individuals with chicken pox, cuts or who were coughing or sneezing etc. 10 images of black individuals with infections/diseases were added and closely matched the 10 images of white people5. For the control condition, 15 images of
buildings and 15 images of single furniture items against a white background were used. For the terror threat condition, 30 images of terrorist attacks (e.g., 9/11, Madrid’s ETA bombings) were used and were matched for the proportion of black and white individuals across the set. For the three conditions, the order of the images was the same for each participant, and this order was maintained for the two-time points when images were shown.
A one-way Analysis of Variance (ANOVA) on scores of how unpleasant or disturbing participants found the images revealed a significant difference across the 3 prime conditions (control: M = 1.11, SD = .47, terror: M = 4.99, SD = 1.21, disease: M = 5.04, SD = 1.05), F(2, 389) = 705.69, p < .001, ηp2= .78. LSD tests showed that both disease and terrorism images
were reported as being significantly more disturbing/unpleasant then the control images, ts > 32.02, ps < .001, d > 35.45. No significant difference was found between the disease and terrorism conditions, t(262) = .43, p = .71. Therefore, both threat conditions induced similar aversive reactions, albeit, likely different emotional reactions (e.g., fear vs. disgust).
Procedure: The design included a between-subject variable called prime type which had three levels: control, disease threat and the terror threat. To begin the online experiment,
5 A pilot study was carried out that did not include the extra 10 images of black people. Due
participants had to click a box which confirmed they were 18 years of age or older and were happy to participate in the experiment based on the information that they had been provided. Next, they completed demographic information and were randomly allocated to one of the three priming conditions. Participants scrolled through their respective images for as long as they wanted but a minimum of 30 seconds elapsed before participants could continue to the explicit questions.
Following these questions, participants viewed the same images previously shown for at least another 30 seconds and were asked if “The images were disturbing and unpleasant?” below all the images. The Race-IAT was then completed. Next, participants responded to a memory question to ensure they viewed the images, as well as a question asking if they had previously completed the experiment. An item asking how recently they have had a cold or flu was included, and they then completed the PBC scale. Finally, they were thanked and debriefed. The full experiment can be viewed at https://brianpsychexperiments.warwick.ac.uk/tdc.html
Results
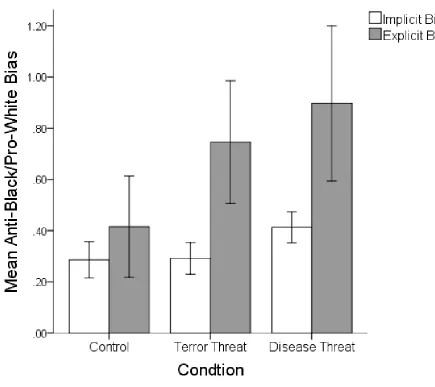
There was a significant effect of prime type (control, terrorism, disease) on IAT D-score, F(2, 391) = 5.43, p < .01, ηp2 = .03). Consistent with PST, Fisher’s LSD test showed
significantly higher anti-black/pro-white bias with the disease prime (M = .42, SD = .35), compared to the control (M = .29, SD = .41, t(266) = 2.90, p < .01, d = .34). Similarly, the disease prime showed significantly higher anti-black/pro-white bias compared to the terrorism prime (M = .29, SD = .35, t(254) = 2.76, p < .01, d = .37). There was no significant difference between the control and terrorism prime conditions, t(262) = .12, p > .25 (see Figure 2.1).
There was also a significant difference between priming conditions for the explicit measure, F(2, 379) = 3.57, p = .029, ηp2 = .02. LSD tests showed that there was a significantly
prime (M = 4.37, SD = .64, t(245.83) = 2.62, p = .009, d = .34 ). Significantly higher anti-black/pro-white biases were also shown with the terror prime (M = 4.52, SD = .81) compared to the control prime, t(255.81) = 2.17, p = .031, d = .29). The disease and terror threat conditions did not differ, t(259) = .19, p > .25 (see Figure 2.1). For correlational analysis of the variables used in Study 3 and analysis addressing gender differences, please see Appendix 2.
Discussion
Across three studies, our findings are consistent with the hypothesis that living in regions with higher disease rates and being primed with diseases increases anti-out-group/pro-in-group biases. Across the US states, we observed that residents in states with higher disease rates displayed stronger anti-out-group/pro-in-group biases at the implicit and explicit level for both white and black respondents. In many respects, these findings were replicated in our cross-country analysis. Importantly, all the effects reported across the US and the world were robust when controlling for several important individual and state level factors often used to explain prejudice. For example, conflict over limited resources (Baumeister & Bushman, 2010) and greater diversity (Putnam, 2007) have previously been used to explain racial prejudice in the US. However, when we considered median income, inequality (proxy for limited resources) and race exposure (proxy for diversity), disease rates were the best predictor of prejudice.
At the cross-country level when disease rates were held constant, we found that white respondents living in countries that had an average darker skin tone exhibited a reduction in explicit anti-black/pro-white biases. This result also survived the inclusion of numerous control factors. At the implicit level, comparable results (albeit marginally significant results) were observed across the world after the control factors were added to the model. These findings are consistent with our prediction, based on the contact hypothesis, that contact with out-groups is a crucial factor in reducing prejudice particularly at the explicit level.