Original citation:
Mukherjee, Ratnajit, Debattista, Kurt, Bashford-Rogers, Thomas, Waterfield, Brian and
Chalmers, Alan. (2016) A study on user preference of high dynamic range over low dynamic
range video. The Visual Computer, 32 (6). pp. 825-834.
Permanent WRAP URL:
http://wrap.warwick.ac.uk/78719
Copyright and reuse:
The Warwick Research Archive Portal (WRAP) makes this work of researchers of the
University of Warwick available open access under the following conditions.
This article is made available under the Creative Commons Attribution 4.0 International
license (CC BY 4.0) and may be reused according to the conditions of the license. For more
details see: http://creativecommons.org/licenses/by/4.0/
A note on versions:
The version presented in WRAP is the published version, or, version of record, and may be
cited as it appears here.
Vis Comput (2016) 32:825–834 DOI 10.1007/s00371-016-1239-7
O R I G I NA L A RT I C L E
A study on user preference of high dynamic range over low
dynamic range video
Ratnajit Mukherjee1 · Kurt Debattista1 · Thomas Bashford-Rogers1 · Brian Waterfield2 · Alan Chalmers1
Published online: 13 May 2016
© The Author(s) 2016. This article is published with open access at Springerlink.com
Abstract The increased interest in high dynamic range (HDR) video over existing low dynamic range (LDR) video during the past decade or so was primarily due to its inher-ent capability to capture, store and display the full range of real-world lighting visible to the human eye with increased precision. This has led to an inherent assumption that HDR video would be preferable by the end-user over LDR video due to the more immersive and realistic visual experience provided by HDR. This assumption has led to a considerable body of research into efficient capture, processing, storage and display of HDR video. Although this is beneficial for sci-entific research and industrial purposes, very little research has been conducted to test the veracity of this assumption. In this paper, we conduct two subjective studies by means of a ranking and a rating-based experiment where 60 partici-pants in total, 30 in each experiment, were tasked to rank and rate several reference HDR video scenes along with three mapped LDR versions of each scene on an HDR display, in order of their viewing preference. Results suggest that given the option, end-users prefer the HDR representation of the scene over its LDR counterpart.
Keywords HDR video·Subjective experiment·Ranking· Rating
B
Ratnajit Mukherjee1 WMG, University of Warwick, Coventry, UK
2 Jaguar Land Rover Automotive PLC, Coventry, UK
1 Introduction
High dynamic range (HDR) video is able to capture, process, store and display the full range of real-world lighting con-ditions visible to the human visual system (HVS) [2]. This, when compared to a fraction of the dynamic range displayed by existing low dynamic range (LDR) video promises to provide a more immersive and realistic viewing experience. Based on this assumption, a large body of research has been conducted to process and deliver HDR data by means of tone-mapping and compression techniques. Although this assumption is true for most of the scientific and indus-trial applications since HDR data provide higher precision than existing 8-bit LDR data, very little has been done to test the veracity of this assumption from an end-users’ perspective.
In this paper, we investigate whether HDR video is pre-ferred over LDR video, purely from a viewer’s perspective. To that end, we selected six HDR scenes, used three separate HDR to LDR mapping techniques such that each represents a different class of mapping technique, in order to create three LDR versions of each scene. The resultant videos were displayed on an HDR screen where thereferenceHDR rep-resentation is absolute luminance graded from 10−4to 4000 cd/m2and the corresponding LDR versions are graded from 10−4 to 350 cd/m2. This is done to simulate the display capabilities of the HDR display and typical high-end LDR displays, respectively. Subsequently, we conducted two sub-jective studies by means of a ranking- and a rating-based experiment, to verify the viewing preference of end-users.
The following are the primary contributions of this work:
2. Results indicate that the ranking and rating experiments provide similar outcomes which exhibits the preference of HDR over the LDR versions.
2 Related work
During the past decade or so, a considerably large body of research has been conducted on tone-mapping techniques to map static HDR images and video sequences to their corre-sponding LDR versions in order to store and display them using legacy image/video infrastructure. The tone-mapping operators (TMOs), proposed to date, can broadly be classi-fied as global or local TMOs. In addition, they can also be classified as non-temporally coherent TMOs or temporally coherent TMOs suitable for video tone-mapping applica-tions. Furthermore, the availability of a multitude of TMOs has in turn led to the considerable body of research con-ducted in order to evaluate the TMOs, most of which were conducted by means of subjective experiments in controlled environments using a number of evaluation techniques such as rating, ranking and pairwise comparison.
Drago et al. [6] was one of the first to conduct a subjec-tive evaluation of TMOs wherein four different HDR scenes were tone-mapped using seven different TMOs and were evaluated by 11 participants by means of a pairwise com-parison technique without the HDRreference. Ledda et al. [17] conducted the first TMO evaluation using an HDR ref-erence. 18 participants evaluated six different TMOs applied to 23 images using pair of LDR displays along with the HDR display. Several other TMO evaluations along similar lines have been conducted such as the ones conducted by Kuang et al. [16], ˘Cadik et al. [3], etc. More recently, Eilertsen et al. [9] conducted a subjective evaluation where several temporally coherent TMOs were evaluated by means of a pairwise comparison technique. Results demonstrated that several TMOs introduced video artefacts such as flickering, ghosting and redundant saturation. Furthermore, it suggests that relatively less complex global TMOs can outperform complex local TMOs for video application. The work is of particular interest to us since it evaluates several TMOs for video applications out which one of the temporally coher-ent TMOs, proposed by Mantiuk et al. [18] has been used in this work. Furthermore, several other TMO evaluations have been conducted by Narwaria et al. [21], Urbano et al. [26] and Melo et al. [19]. However, it is to be noted that the above mentioned TMO evaluations were conducted with the basic assumption that although static HDR images or HDR video sequences are preferred over a tone-mapped LDR version, they are not compatible with legacy infrastructure. There-fore, the alternative is to evaluate a plethora of TMOs to identify which TMOs are capable of maximal scene repro-duction.
The veracity of such an assumption was first tested by Akyüz et al. [1] where the authors conducted a series of sub-jective experiments to determine the best technique to display LDR images on state-of-the-art HDR displays and to iden-tify which stages of the HDR pipeline are perceptually most critical. The first experiment conducted as a part of this study used ten different static HDR images and generated several LDR versions of each. The HDR image was subsequently displayed on aBrightside DR-37-P[25] HDR display with a peak luminance value of 3000 cd/m2and the LDR images were displayed on a commercially availableDell UltraSharp 2007FP. Results suggest that although the basic assump-tion that the HDR image representaassump-tion would be preferred over LDR holds, it might not necessarily be the case since tone-mapped images have been ranked second to the original HDR representation. Furthermore, the study also determines that although tone-mapped images preserve more details and visibility in general, compared to a single exposure represen-tation of the scene, it might lead to visual unnaturalness in the process as viewers are used to seeing over and under exposed areas in single exposure images. This might lead to a result where tone-mapped images have no statistically significant difference with that of single exposures.
Although the primary research question has been answered in this work, the authors focused on static HDR images only. Furthermore, several advanced perceptually motivated TMOs have been proposed since. Therefore, it is important to evaluate whether the findings by Akyüz et al. [1] hold for HDR video sequences given the current scenario where several perceptual TMOs are available. To the best of our knowledge, no such body of work exists for HDR video and a study to test the veracity of the basic assumption was the primary motivation of the work presented here.
3 HDR to LDR mapping techniques
Three HDR to LDR mapping techniques were chosen for this work such that each represents a different class of HDR to LDR mapping technique.
3.1 Display adaptive tone mapping (mantiuk)
A study on user preference of high dynamic range over low dynamic range video 827
the HDR luminance to its corresponding LDR luminance. Given a particular display device’s characteristics, the TMO produces the least distorted image in terms of visible contrast distortions which when weighed by an HVS model accounts for luminance masking, spatial contrast sensitivity and con-trast masking.
The mapping technique employs image enhancement techniques to enhance the contrast of thereference image by 15 %. It uses a display model to account for the limita-tions of the target display and an HVS model based on Daly’s contrast sensitivity function (CSF) [4] to derive a piecewise tone-curve which maps thereference HDR luminance to a just noticeable difference (JND) space such that the visi-ble distortions due to the luminance mapping are minimised. Furthermore, the authors use the techniques introduced by Schlick [23] to preserve the chroma information. The pro-posed TMO also accounts for temporal coherence when tone mapping an HDR video sequence. Further details are avail-able in [18].
The primary reason for choosing this HDR to LDR map-ping technique is because it endeavours to reproduce the
referenceHDR scene with minimal visible distortion and also accounts for temporal coherence (for HDR video sequences), ambient lighting and target display. In our case the target dis-play was set tolcd-bright to exploit the capabilities of the SIM2 HDR display. Also, this TMO in particular performs very well in comparison tests amongst other operators [19].
3.2 Optimal exposure (optimal)
Debattista et al. [5] proposed a two-stream based backward compatible HDR video compression algorithm which uses an exposure extraction technique [13] to create an 8-bit base stream. However, this exposure extraction can also be used as an alternative to tone-mapping HDR images or video frames wherein a single exposure extracts the maximum possible luminance information from the original HDR data that be can fitted within the allowable bit-depth of legacy imaging infrastructure which is typically 8 bits/pixel/channel.
The luminance information of the HDR data is calculated using the REC. 709 primaries along with the dynamic range of the image/video frame. The number of bins required to construct the histogram of the LDR image is then calcu-lated using Freedman–Diaconis rule [12]. Subsequently, the largest contiguous area of the histogram is then chosen to fit within the required bit depth. This suffices to identify the optimal exposure which endeavours to preserve the maxi-mum luminance information that can be extracted from the HDR image to create an LDR image.
For HDR video applications, the exposure extraction takes place in dual-loop fashion where the optimal exposure per frame is calculated into an array and the filtered information is used to extract the data from HDR frames on the second
loop to create the optimally extracted LDR frames. This, in turn, helps to preserve temporal coherence across successive frames of the video. Further details are available in [5].
The primary motivation behind selecting this mapping technique is that it provides an alternative technique to extract the HDR luminance range into a single optimally calculated exposure and maps the exposure into an 8 bit LDR range analogous to an optimally metered 8 bit/pixel/channel image from a camera under varying lighting conditions.
3.3 ICAM06: image appearance model (iCAM)
Kuang et al. [15] proposed a new image appearance model, designated iCAM06, designed specifically for HDR image rendering. Based on the iCAM framework [20], the new model incorporates the spatial processing models in the HVS for contrast enhancement and photo-receptor light adaptation functions that enhance local details in highlights and shad-ows.
The original HDR image is first converted to the CIE-XYZ colour space and subsequently decomposed into a base and a detail layer wherein the base layer is obtained using an edge-preserving bilateral filter [7] and the detail layer is obtained by subtracting the base layer from the original image.
The base layer first undergoes chromatic adaptation which is achieved by converting the CIE-XYZ image to a spectrally sharpened RGB image using the MCAT02 transformation
matrix [20]. The incomplete adaptation factor is computed as a function of adaptation luminance and the surround factor. Subsequently, the spectrally sharpened RGB image is converted from the CAT02 space to the Hunt–Pointer– Estevez fundamentals which is where the resultant RGB signal undergoes a linear tone compression using a non-linear response function for both rods and cones derived from the Hunt Model [11]. The tone-compressed RGB image is then converted to the perceptually uniform colour oppo-nent space IPT [8], which is desired for image attribute adjustments without affecting other attributes. To preserve the naturalness of the rendered tone-compressed image, the detail layer is enhanced to predict the Stevens effect and the P&T channels of the base layer is enhanced to predict the Hunt effect [11]. Finally, the enhanced base and detail layers are combined to produce an enhanced perceptually uniform output image. This is displayed on the target device by converting the IPT image to an RGB signal followed by an inverse chromatic adaptation.
Fig. 1 An schematic diagram of the overall work flow
4 Overview of the psychophysical studies
In this section, we provide a brief overview of the work flow required to prepare the materials common to both the ranking and rating based experiments. A visual description of the overall work flow is given in Fig.1. Also, a brief description of the scenes used for both the experiments is given in Table1.
4.1 Motivation
The three most commonly used techniques to conduct a sub-jective study are by means of ranking, rating and pairwise comparison. In this work, we have conducted two such stud-ies by means of a ranking and a rating based experiment. The primary motivations behind choosing the techniques are (a) to investigate whether the assumed preference of HDR over LDR holds when using two different experiment designs (for
additional verification) with mutually exclusive groups of participants and (b) both rating and ranking can be relatively straightforward to conduct and are of a shorter duration than a full pairwise comparison.
4.2 Preparation of materials
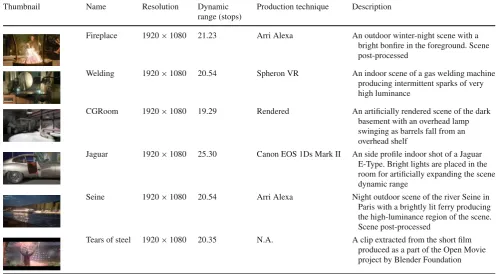
[image:5.595.53.545.52.144.2]We outline the common procedure involved to prepare the HDR video content used for both the experiments. Six HDR video scenes (HDRVs), comprising of 150 frames each, were chosen such that the selected HDRVs represent a wide vari-ety of production techniques and a large variation in dynamic range. All scenes used in this work have a resolution of 1920×1080 and were graded (in absolute luminance terms) such that the pixel values are in the range of 10−4to 4000 cd/m2. Subsequently, using the HDR to LDR mapping tech-niques described earlier, three corresponding LDR video
Table 1 Overview of the scenes used for the ranking- and rating-based psychophysical experiment
Thumbnail Name Resolution Dynamic range (stops)
Production technique Description
Fireplace 1920×1080 21.23 Arri Alexa An outdoor winter-night scene with a bright bonfire in the foreground. Scene post-processed
Welding 1920×1080 20.54 Spheron VR An indoor scene of a gas welding machine producing intermittent sparks of very high luminance
CGRoom 1920×1080 19.29 Rendered An artificially rendered scene of the dark basement with an overhead lamp swinging as barrels fall from an overhead shelf
Jaguar 1920×1080 25.30 Canon EOS 1Ds Mark II An side profile indoor shot of a Jaguar E-Type. Bright lights are placed in the room for artificially expanding the scene dynamic range
Seine 1920×1080 20.54 Arri Alexa Night outdoor scene of the river Seine in Paris with a brightly lit ferry producing the high-luminance region of the scene. Scene post-processed
[image:5.595.48.549.437.711.2]A study on user preference of high dynamic range over low dynamic range video 829
sequences (LDRVs) were created for each of six scenes. The output HDRVs and LDRVs (6 HDRVs+18 LDRVs=24 in total) produced were in.hdr format and in linear RGB colour space. This was necessary since both the HDRVs and LDRVs were subsequently converted to a SIM2 [24] HDR display suitable mode.
Since both the HDRVs and LDRVs were being displayed on the HDR display, the luminance rating of the HDRV and LDRV frames was verified using the SpectroDuo PR-680 photo-spectrometer [22], and it was ensured that the maxi-mum luminance rating of the HDRVs was within 4000 cd/m2 while the luminance rating of the LDRVs was within 350 cd/m2.
4.3 Footage
Table1provides a brief description of each scene along with a tone-mapped frame, overall dynamic range and production technique.
4.4 Materials
Software resources used for both the ranking- and the rating-based experiment included the 24 video sequences. Hardware resources included a 47 SIM2 HDR display with a 1920×1080 native resolution, a peak luminance of 4000 cd/m2 and a contrast ratio of >106:1 [24]. The
LDR display used in the experiments was an Alienware 23” IPS display, also with a 1920×1080 resolution, a peak luminance of 350 cd/m2and a maximum contrast ratio of 8×10⁵:1.
5 Experiment 1: ranking
In this section, we provide a brief overview of the ranking-based subjective experiment which includes a brief discus-sion about the design of the experiment, materials used, environment of experiment set-up, participant recruitment and the procedure followed to conduct the experiment.
5.1 Design
The motivation of this experiment was to rank and identify the order of viewing preference of each version (HDR/LDR), across the selected scenes. Based on their judgment of the displayed video quality (overall contrast, brightness, clar-ity and sharpness), the participants were tasked to rank four versions, which included the hiddenreference, for each of the selected scenes, one at a time. For each sequence they had to view HDRVs/LDRVs at least once. The sequences per scene belonging to each of four versions were randomly presented in order to avoid bias. While ranking the scenes,
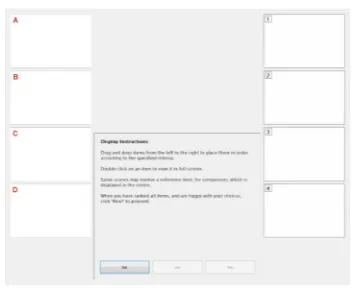
Fig. 2 Custom GUI used for the ranking experiment
participants were allowed to view the sequences as many times as required.
The independent variables in this experiment were the selected scenes and the four versions of each scene. The dependent variable in this experiment were the ranks assigned to the four versions for the selected scenes. A within-participants design was employed such that every participant viewed all the scenes.
5.2 Materials
For the purpose of the ranking experiment only five scenes were used as one scene was reserved as a demo scene, results of which would further be discarded from the final ranking results. Also, a custom graphical user interface (GUI), as shown in Fig. 2, was specifically built such that it presents four thumbnails each linked to either an HDRV (hidden reference) or an LDRV on the left side of the screen. Each thumbnail, whendouble-clicked, plays the linked HDRV/LDRV. Participants are tasked to view each of the videos and drag the corresponding thumbnail to the right side of the screen in order of their viewing preference. The instructions for carrying out the experiment are clearly described in the text box in the middle.
5.3 Participants
A total of 30 participants with an age range of 25–50 years and from various academic and corporate backgrounds took part in this experiment. All participants had normal or corrected-to-normal vision.
5.4 Environment
[image:6.595.336.514.53.198.2]Fig. 3 Schematic diagram of the ranking experiment setup
between the HDR display and the participant was set to approximately 3.2 times the height of the HDR display; at a distance of≈189 cm with an LCD monitor placed at an angle of 45◦(see Fig.3). In order to minimise glaring, the bright-ness and contrast of the LCD monitor was reduced to 25 %.
5.5 Procedure
The participants were first introduced to the objectives of the experiment which was to judge the overall quality of a video footage (HDRV/LDRV). Along with the verbal intro-duction, the participants were given a consent form and an information leaflet. Initially, the participants were given a demonstration of the experiment using the demo sequence, the results of which were subsequently discarded from the main results. Upon completion of the demonstration, the par-ticipants were asked to proceed with ranking the remaining scenes. Based on their judgement of the displayed video qual-ity, the participants positioned the corresponding thumbnails (labelled [A–D]) to any of the blank positions (labelled [1–4]) by means of the GUI.
6 Experiment 2: rating
This section provides a brief overview of the rating-based subjective experiment which includes a brief overview of the design of the experiment, materials used, experiment set up, participant recruitment and the procedure followed, respec-tively.
6.1 Design
[image:7.595.70.259.52.193.2]The independent variables are the six scenes and four ver-sions of each scene. The dependent variable in this case are the scores on a scale of [0–10] given to each of the video sequences by the participants. The participants were tasked to rate four versions for each of the selected scenes. A within-participants design was used and all the within-participants viewed
Table 2 Detailed breakup of the five groups
Group number Number of participants
1 8
2 6
3 6
4 5
5 5
all possible combinations of scenes and versions. In order to facilitate the experiment, participants were presented the stimuli in groups of five to eight participants at a time.
6.2 Materials
For the purpose of the rating experiment, interactive batch files were created for each group of the participants (see Sect.
6.3) such that the total 24 videos are ordered in a pseudo-random manner to be played sequentially for each group of participants. Furthermore, due to the creation of individual batch files for each group of participants, it was ensured that the ordering of videos for each batch file is also randomised.
6.3 Participants
A total of 30 participants, divided into five groups (see Table2), with an age range of 20–40 years and from various academic backgrounds, took part in the rating experiment. All participants had normal or corrected-to-normal vision.
6.4 Environment
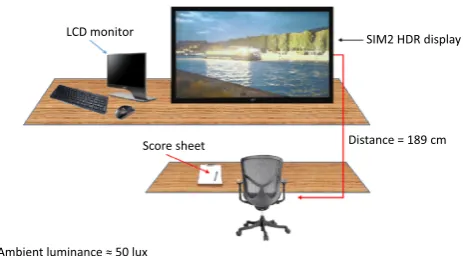
Unlike the ranking experiment, the rating experiment was conducted in a marginally brighter room. The ambient light-ing in the room was below 50 lux, within the recommended luminance levels for a typical dark-dim environment [10]. Also, unlike the ranking experiment, where the participant controlled the ranking GUI, the conductor of the experi-ment controlled the interactive batch files for this experiexperi-ment. Also, the LCD monitor was turned away from the participants during the experiment. A visual description of the rating envi-ronment setup is given in Fig.4.
6.5 Procedure
[image:7.595.308.545.72.160.2]A study on user preference of high dynamic range over low dynamic range video 831
SIM2 HDR display
Distance = 189 cm LCD monitor
Ambient luminance ≈ 50 lux Score sheet
Fig. 4 Schematic diagram of the rating experiment setup
were also instructed to look for artefacts such as colour shift (common to tone-mapping techniques) and flickering (com-mon to non-temporally coherent tone-mapping/compression techniques). The rating was performed on a hard copy score sheet which was later digitised for further analysis.
7 Results
In this section, we present an overview of the results obtained from the ranking- and the rating-based experiments and analyse the same.
7.1 Ranking results
Let the null hypothesis H0 be that there are no significant
differences between thereferenceHDR content and its cor-responding LDR versions. The alternate hypothesisH1states
that there are significant differences between the HDR and LDR versions. The statistical level for analysing the obtained results is assumed to be 0.05 and the sample size (total num-ber of participants) was 30. Furthermore, ifH1is true, then
the Kendall’s coefficient of concordance W (the degree of mutual agreement amongst participants) can be determined as
W = N2Σ
2
t 2
−1 whereΣ=
i=j
αi j
2
. (1)
The significance ofW can be analysed using chi-squared statistics such that
χ2= t(t−1)(1+W(N−1))
2 . (2)
χ2is asymptotically distributed with t(t−1)
2 degrees of
free-dom, wheret =4 represents the number of operators (HDR
+3 LDR), andN =30 represents the number of participants. A significance between scores suggests that the perceived image quality of two operators, when compared with each other, are different although no conclusions can be drawn for cases of similarity.
The data obtained from the ranking experiment need to be tested for homogeneity and any outliers must be removed before further analysis can be performed. To that extent, the data obtained from the ranking experiment are folded across all scenes to obtain a grand average. We tested for out-liers by means of ahistogramplot andstem-and-leaf display
method. The outliers are then identified using a box-and-whisker plot and are subsequently removed from the raw data. This ensures that the grand average has normally dis-tributed data points.
Following the above mentioned technique, three outliers were identified in the raw ranking data which were sub-sequently removed, thus reducing the sample size to 27. The resultant data were further analysed using statistical non-parametric tests, such as Kendall’s, of concordance for
K-related samples.
The overall ranking scores demonstrate a significance of
p < 0.05. Therefore, H0 is rejected and H1 is accepted.
This means that the ranking results averaged over the sample size of 27 exhibit significant differences between the four operators (versions) for each of the five scenes as well as the grand average of the five scenes. Before the result of the full pairwise comparison on the four operators (on the grand average) is presented, we present the mean ranking scores assigned to each operator per sequence as well as the derived average scores (folded across five scenes) along with their variation denoted by 95 % confidence intervals in Fig.5.
Next, we present the result of the full pairwise compari-son on the grand average data in Table3which demonstrates significant differences between the operators. However, oper-ators within the same group exhibit no statistically significant differences with each other.
7.2 Rating results
Analogous to the process mentioned in Sect.7.1, the com-bined results obtained from the rating-based subjective experiment were folded across the six scenes and the grand average was tested for outliers. Based on thebox-and-whisker
plot, two outliers were identified and removed from the raw data set thus reducing the sample size to 28. Using the resul-tant data, we present the mean rating scores for each of the four operators per sequence and for the derived grand average in Fig.6.
Subsequently, the null hypothesisH0was tested using the
[image:8.595.55.287.53.181.2]Fig. 5 Overall ranking scores—per sequence (averaged over 27 participants) and averaged ranks across five scenes (lower is better)
Table 3 Mean ranks with KendallW, averaged across five scenes and 27 participants (lower is better)
Fig. 6 Overall rating
scores—per sequence (averaged over 28 participants) and average scores across all six scenes and 28 participants (higher is better)
Table 4 Mean rating scores with KendallW, averaged across six scenes and 28 participants (higher is better)
groups into which the operators can be assigned and the Kendall’s coefficient of concordance which denotes the degree of agreement amongst the participants as shown in Table4.
8 Discussion
The results from both experiments are overall fairly similar. They indicate a preference for HDR and less of a
prefer-ence for the LDR mapping methods. There is a distinction between the preference of the mapping methods, however, although for the most part no significant difference between the mapping methods was encountered apart from theicam
being preferred in the rating experiment.
[image:9.595.47.544.239.567.2]A study on user preference of high dynamic range over low dynamic range video 833
LDR versions are less significant. Analysis of the ranking scores, averaged across the five scenes, also exhibits the same characteristics wherein thereferenceHDR videos exhibit sta-tistically significant difference with that of the LDR versions
mantiuk, icamandoptimalas shown in Table 4. However, there are no statistically significant differences in between the three LDR versions. Furthermore, it is to be noted that the Kendall’s coefficient of concordance for the grand aver-age ranks, as shown in Table3, exhibits a low concordance value which also indicates a degree of ambivalence amongst the participants.
Similarly, the mean rating scores as shown in Fig.6exhibit a significant difference between thereferenceHDR and the corresponding three LDR versions for each of the six scenes as well as the grand average. Furthermore, the results of the pairwise comparison from the repeated measures ANOVA demonstrate that thereference HDR is significantly differ-ent thanicamwhich in itself exhibits statistically significant difference withmantiukandoptimal.
Although the results presented in this work involve HDR video sequences, they bear similarity with the findings of the previous study by Akyuz et al. [1] which used static HDR and tone-mapped images. Both studies demonstrate a sta-tistically significant difference between thereferenceHDR images/videos and the corresponding tone-mapped versions of the same. Even though many advanced tone-mapping tech-niques have been proposed since the previous work which endeavour to replicate the overall scene contrast to a higher degree than previous TMOs, some of which has been used in this work, there is evidence that given the correct view-ing conditions and properly prepared materials, HDR video supersedes LDR video. However, there are limitations in this study. Only six HDR scenes were used in this work out of which five were used for the ranking-based experiments. Results might vary if the number of scenes and HDR to LDR mapping techniques are increased. Furthermore, the viewers were presented with independent visual stimuli which are not a part of any contextual narrative upon which the results might also vary.
9 Conclusion
In this work, we asked a fundamental question as to whether HDR video is indeed preferred over legacy LDR video, purely from the viewers perspective. The technical advan-tages of HDR video over LDR video and the multitude of TMOs, some of which reproduce a more artistic representa-tion of the original scene, were not considered in this work. Therefore, we used three HDR to LDR mapping techniques such that they are able to reproduce the originalreference
to the extent possible and conducted two subjective experi-ments with 60 participants in total, 30 in each group (mutually
exclusive), both of which demonstrate that there exists a statistically significant difference between the HDR (more realistic) representation of a scene and its LDR counterparts where the former is preferred by the end-users.
Acknowledgments We would like to thank Technicolor SA for the “Seine” footage and all the participants of the experiments. This work is funded by EPSRC EP/K014056/1 with Jaguar Land Rover: “PSi Theme 7: Visualisation and Virtual Experience”. Chalmers and Debattista are Royal Society Industrial Fellows, for whose support we are most grate-ful.
Open Access This article is distributed under the terms of the Creative Commons Attribution 4.0 International License (http://creativecomm ons.org/licenses/by/4.0/), which permits unrestricted use, distribution, and reproduction in any medium, provided you give appropriate credit to the original author(s) and the source, provide a link to the Creative Commons license, and indicate if changes were made.
References
1. Akyüz, A.O., Fleming, R., Riecke, B.E., Reinhard, E., Bülthoff, H.H.: Do hdr displays support ldr content? A psychophysical eval-uation. In: ACM SIGGRAPH 2007 Papers, SIGGRAPH’07. ACM, New York (2007). doi:10.1145/1275808.1276425
2. Banterle, F., Artusi, A., Debattista, K., Chalmers, A.: Advanced High Dynamic Range Imaging: Theory and Practice. CRC Press, Boca Raton (2011)
3. ˇCadík, M., Wimmer, M., Neumann, L., Artusi, A.: Evalua-tion of HDR tone mapping methods using essential perceptual attributes. Comput. Graph.32(3), 330–349 (2008). doi:10.1016/ j.cag.2008.04.003. http://www.sciencedirect.com/science/article/ pii/S0097849308000460
4. Daly, S.J.: Visible differences predictor: an algorithm for the assess-ment of image fidelity (1992). doi:10.1117/12.135952
5. Debattista, K., Bashford-Rogers, T., Selmanovi´c, E., Mukherjee, R., Chalmers, A.: Optimal exposure compression for high dynamic range content. Vis. Comput.31(6–8), 1089–1099 (2015) 6. Drago, F., Martens, W.L., Myszkowski, K., Seidel, H.P.: Perceptual
evaluation of tone mapping operators. In: ACM SIGGRAPH 2003 Sketches and Applications, SIGGRAPH’03, pp. 1–1. ACM, New York (2003). doi:10.1145/965400.965487
7. Durand, F., Dorsey, J.: Fast bilateral filtering for the display of high-dynamic-range images. In: Proceedings of the 29th Annual Conference on Computer Graphics and Interactive Techniques, SIGGRAPH’02, pp. 257–266. ACM, New York (2002). doi:10. 1145/566570.566574
8. Ebner, F., Fairchild, M.D.: Development and testing of a color space (ipt) with improved hue uniformity. Color Imaging Conf. 1998(1), 8–13 (1998). http://www.ingentaconnect.com/content/ ist/cic/1998/00001998/00000001/art00003
9. Eilertsen, G., Wanat, R., Mantiuk, R.K., Unger, J.: Evaluation of tone mapping operators for HDR-video. Comput. Graph. Forum 32(7), 275–284 (2013). doi:10.1111/cgf.12235
10. Engineering toolbox: illuminance—recommended light levels. http://www.engineeringtoolbox.com/light-level-rooms-d_708. html
11. Fairchild, M.D.: Color Appearance Models. Wiley, New York (2013)
12. Freedman, D., Diaconis, P.: On the histogram as a density estimator: L 2 theory. Probab. Theory Relat. Fields57(4), 453–476 (1981) 13. Hirakawa, K., Wolfe, P.: Optimal exposure control for high
Confer-ence on Image Processing (ICIP), pp. 3137–3140 (2010). doi:10. 1109/ICIP.2010.5654059
14. ITU: Recommendation itu-r bt.500-13: Methodology for the subjective assessment of the quality of television pictures. Tech. rep., International Telecommunication Union (2012).http://www. itu.int/dms_pubrec/itu-r/rec/bt/R-REC-BT.500-13-201201-I!! PDF-E.pdf
15. Kuang, J., Johnson, G.M., Fairchild, M.D.: icam06: a refined image appearance model for HDR image rendering. J. Vis. Com-mun. Image Represent. 18(5), 406–414 (2007). doi:10.1016/j. jvcir.2007.06.003. http://www.sciencedirect.com/science/article/ pii/S1047320307000533. (Special issue on High Dynamic Range Imaging)
16. Kuang, J., Yamaguchi, H., Liu, C., Johnson, G.M., Fairchild, M.D.: Evaluating hdr rendering algorithms. ACM Trans. Appl. Percept. 4(2) (2007). doi:10.1145/1265957.1265958
17. Ledda, P., Chalmers, A., Troscianko, T., Seetzen, H.: Evaluation of tone mapping operators using a high dynamic range display. In: ACM SIGGRAPH 2005 Papers, SIGGRAPH’05, pp. 640–648. ACM, New York (2005). doi:10.1145/1186822.1073242 18. Mantiuk, R., Daly, S., Kerofsky, L.: Display adaptive tone mapping.
In: ACM SIGGRAPH 2008 Papers, SIGGRAPH’08, pp. 68:1– 68:10. ACM, New York (2008). doi:10.1145/1399504.1360667 19. Melo, M., Bessa, M., Debattista, K., Chalmers, A.: Evaluation of
tone-mapping operators for HDR video under different ambient luminance levels. Comput. Graph. Forum34(8), 38–49 (2015). doi:10.1111/cgf.12606
20. Moroney, N., Fairchild, M.D., Hunt, R.W., Li, C., Luo, M.R., New-man, T.: The ciecam02 color appearance model. In: Color and Imaging Conference, vol. 2002, pp. 23–27. Society for Imaging Science and Technology (2002)
21. Narwaria, M., Da Silva, M., Le Callet, P., Pepion, R.: Single expo-sure vs tone mapped high dynamic range images: a study based on quality of experience. In: 2014 Proceedings of the 22nd European Signal Processing Conference (EUSIPCO), pp. 2140–2144 (2014) 22. Photo Research Inc.: PR-655, PR-670, PR-680 and PR-680L Spec-traScan Spectroradiometers.http://www.photoresearch.com/sites/ default/files/PR-6%20Series%20%20Brochure_1.pdf
23. Schlick, C.: Quantization techniques for visualization of high dynamic range pictures. In: Photorealistic Rendering Techniques, pp. 7–20. Springer, New York (1995)
24. SIM2 Multimedia: SIM2 HDR47. http://www.sim2hdr.com/ hdrdisplay/hdr47e_s_4k
25. Technologies, B.: Brightside dr-37-p. http://www.bit-tech.net/ hardware/2005/10/04/brightside_hdr_edr/8
26. Urbano, C., Magalhes, L., Moura, J., Bessa, M., Marcos, A., Chalmers, A.: Tone mapping operators on small screen devices: an evaluation study. Comput. Graph. Forum29(8), 2469–2478 (2010). doi:10.1111/j.1467-8659.2010.01758.x
Ratnajit Mukherjeeis a Ph.D. student in Visualisation Group at the University of Warwick. His research interests include HDR, video compression, sig-nal and image processing. He completed his Bachelor of Tech-nology degree, with honours in Information Technology from West Bengal University of Tech-nology, WB, India, and con-ducted research and development of Embedded Assistive Technol-ogy devices at the Indian Institute of Technology, Kharagpur, India.
Kurt Debattista is an Asso-ciate Professor at the University of Warwick. He has a Ph.D. from the University of Bris-tol, an M.Sc. in Psychology, an M.Sc. in Computer Science and a B.Sc. in Mathematics and Computer Science. His research interests include HDR imaging, high-fidelity computer graphics, serious games and parallel com-puting.
Thomas Bashford-Rogers has
a degree in Computer Science from the University of Bristol and a doctorate in Computer Graphics from the University of Warwick. His research interests include global illumination, ray-tracing and Monte Carlo meth-ods. He is currently a Research Fellow at the University of War-wick.
Brian Waterfieldis the Virtual Reality and High-end Visualisa-tion Technical Lead at Jaguar Land Rover. He has an M.Sc. with distinction from Salford University in Virtual Reality and Gaming Technology, and has headed up the introduction of vir-tual reality into JLR. In 2008 he developed the VRCentre that has evolved into the Virtual Innova-tion Centre at JLR, he is now working at the very forefront of research into sensory immer-sion both in process and product within the Vehicle design and development process.