warwick.ac.uk/lib-publications
A Thesis Submitted for the Degree of PhD at the University of Warwick
Permanent WRAP URL:
http://wrap.warwick.ac.uk/80049
Copyright and reuse:
This thesis is made available online and is protected by original copyright. Please scroll down to view the document itself.
Please refer to the repository record for this item for information to help you to cite it. Our policy information is available from the repository home page.
SHAPE VARIATION MODELLING, ANALYSIS AND
STATISTICAL CONTROL FOR ASSEMBLY SYSTEM
WITH COMPLIANT PARTS
By
Abhishek Das
A thesis submitted in partial fulfilment of the requirements for the degree of
Doctor of Philosophy in Engineering
Warwick Manufacturing Group, University of Warwick,
United Kingdom, CV4 7AL
-ii-
TABLE OF CONTENTS
TABLE OF CONTENTS... ii
DEDICATION ... vii
ACKNOWLEDGEMENTS... viii
DECLARATION ... ix
LIST OF TABLES ... x
LIST OF FIGURES ... xi
LIST OF PUBLICATIONS ... xvii
ABSTRACT ... xviii
LIST OF SYMBOLS AND ACRONYMS ... xx
INTRODUCTION ... 1
CHAPTER 1 1.1 Motivation ... 1
1.2 Current Limitations and the Proposed Research Framework for Shape Variation Modelling, Analysis and Statistical Control ... 7
1.2.1 Current Limitations for Shape Variation Modelling, Analysis and Statistical Control ... 8
1.2.2 Proposed Research Framework for Shape Variation Modelling, Analysis and Statistical Control ... 11
1.3 Research Contributions ... 18
1.4 Organisation of the Thesis ... 21
BACKGROUND ... 23
CHAPTER 2 2.1 Assembly Station with Compliant Parts ... 23
2.1.1 Assembly Key Characteristics ... 24
2.1.2 Input: Compliant Parts ... 25
2.1.3 Assembly Process Fixturing ... 27
-iii-
2.2 Measurement of Compliant Parts ... 33
2.2.1 Measurement Data for Quality Inspection and Reverse Engineering of Compliant Parts ... 36
2.2.2 Measurement Data for Monitoring and Control of Compliant Parts ... 38
2.2.3 Part and Assembly Measurement to Demonstrate Case Studies ... 42
2.3 Summary ... 43
LITERATURE REVIEW ... 45
CHAPTER 3 3.1 Introduction ... 45
3.2 Related Work on Shape Error Modelling of Compliant Part ... 47
3.2.1 Shape Error Representation ... 51
3.2.2 Shape Error Decomposition ... 53
3.3 Related Work on Shape Variation Modelling of Compliant Parts ... 59
3.4 Related Work on Shape Variation Monitoring and Control of Compliant Parts ... 65
3.5 Related Work on Assembly Fixture Layout Optimisation Considering Production Batch ... 71
3.6 Summary ... 75
SHAPE ERROR MODELLING OF COMPLIANT PART .... 78
CHAPTER 4 4.1 Introduction ... 78
4.2 Limitations of Current Decomposition Approaches ... 82
4.3 Geometric Modal Analysis (GMA) Methodology ... 85
4.3.1 Data Pre-processing ... 88
4.3.2 GMA-based Shape Error Decomposition ... 88
4.3.2.1 Voxelisation of Mesh Nodes ... 88
4.3.2.2 Voxel Smoothing by Laplace Interpolation ... 90
4.3.2.3 3D DCT Decomposition ... 91
-iv-
4.3.3.1 Modes Selection or Truncation Criteria ... 92
4.3.3.2 Modes Magnitude Correction ... 94
4.4 Results of GMA with Industrial Case Studies ... 97
4.4.1 GMA Based Mode Decomposition ... 97
4.4.2 Comparison with Other Models ... 104
4.4.2.1 Comparison with SMA Model ... 104
4.4.2.2 Comparison with Natural Mode Decomposition ... 105
4.5 Summary ... 108
SHAPE VARIATION MODELLING OF BATCH OF CHAPTER 5 COMPLIANT PARTS ... 110
5.1 Introduction ... 110
5.2 Limitations of Current Approaches ... 113
5.3 Statistical Geometric Modal Analysis (SGMA) Methodology ... 115
5.3.1 GMA Based Modal Matrix ... 116
5.3.2 Variational Virtual Parts ... 119
5.3.2.1 Statistical Characterisation of Preserved Modes ... 119
5.3.2.2 Generation of Virtual Batch of Parts ... 122
5.3.3 Synthesis of Composite Parts ... 124
5.3.3.1 Energy Compaction Criteria (ECC) for Composite Part ... 125
5.3.3.2 Root Sum of Squares (RSS) Criterion for Composite Part .. 126
5.4 Results of SGMA with Industrial Case Study ... 128
5.4.1 Variational Virtual Door Inner Panel Generation ... 130
5.4.2 Synthesis of Composite Parts ... 131
5.5 Summary ... 134
CONTROL CHARTS TO MONITOR PROCESS AND CHAPTER 6 PRODUCT QUALITY SHAPES ... 137
6.1 Introduction ... 137
-v-
6.3 Shape Monitoring Methodology ... 141
6.3.1 Determine T2 and Q Statistics using GMA ... 142
6.3.1.1 T2 Statistic ... 145
6.3.1.2 Q Statistic ... 145
6.3.1.3 Orthogonality of T2 and Q Statistics ... 145
6.3.1.4 Estimate Confidence Region of GMA based T2-Q Integrated Statistics... 148
6.3.1.5 GMA based T2-Q Control Chart for Shape Monitoring ... 149
6.4 Industrial Case Study ... 151
6.4.1 GMA-based T2-Q Control Chart Development ... 152
6.4.2 Detection of Faulty Conditions ... 154
6.4.3 Comparative Analysis of GMA-Based T2-Q Control Chart vs. PCA-Based T2-Q Control Chart ... 159
6.4.3.1 In-Control Mean Shift and Variance Change Detection ... 160
6.4.3.2 Average Run Length (ARL) Comparison ... 162
6.5 Summary ... 163
FIXTURE LAYOUT OPTIMISATION CONSIDERING CHAPTER 7 PRODUCTION BATCH ... 166
7.1 Introduction ... 166
7.2 Problem Formulation ... 170
7.3 Fixture Layout Optimisation Methodology ... 172
7.3.1 SGMA based Composite Assembly Selection ... 175
7.3.1.1 Correlation Criteria Based Clustering ... 177
7.3.1.2 Entropy Based Assembly Selection ... 178
7.3.2 SGMA Based Optimisation Strategy Formulation ... 180
7.4 Results of Fixture Layout Optimisation with Industrial Case Study ... 181
7.4.1 SGMA based Composite Assembly Selection ... 182
-vi-
7.4.1.2 Entropy Based Assembly Selection ... 188
7.4.2 SGMA Based Optimisation ... 189
7.5 Summary ... 195
CONCLUSIONS, CRITICAL REVIEW AND FUTURE CHAPTER 8 SCOPE ... 197
8.1 Conclusions ... 197
8.2 Critical Review ... 209
8.2.1 Advantages of Proposed Methodologies ... 209
8.2.2 Limitations of Proposed Methodologies ... 212
8.3 Future Scope ... 213
8.4 Broader Impact ... 215
-vii-
DEDICATION
-viii-
ACKNOWLEDGEMENTS
I would like to express my earnest gratitude to Professor Dariusz Ceglarek, for providing the opportunity to work with him for my doctoral studies. His guidance and mentoring to the right pathway of conducting research have played a significant role in my graduate life.
I would like to thank Dr. Pasquale Franciosa for his unconditional support for both technical and personal along with sharing his unbounded experience in numerous areas throughout my doctoral work. My gratitude also goes to all the past and current members of the Digital Lifecycle Management (DLM) lab of Warwick Manufacturing Group (WMG), University of Warwick, who made my stay at the DLM lab an enjoyable one.
I would like to acknowledge the support received from the European Commission funded research project ─ EU-FP7 FoF-ICT-2011.7.4: “Remote Laser Welding System Navigator for Eco &Resilient Automotive Factories” (grant agreement number 285051). I would like to thank all RLW navigator project partners for their valuable information about industrial trend and suggestions to carry out my research. I convey my sincere thanks to Mr. Charles Marine at Stadco Automotive Ltd., Mr. Anil Mistry at Jaguar & Land Rover and Mr. David Moseley at EnginSoft UK for supporting with industrial case studies, measurement data and suggestions. In addition, the co-operation and support from Mr. Selim Yilmazer, Mr. David Williams, Dr. Sumit Hazra and Dr. Iain Masters for arranging software, fixturing elements and measurement equipment, deserve special mention. I acknowledge the supports received from WMG, University of Warwick to carry out my doctoral research.
I express my warm gratitude for the care and concern, during my doctoral studies, of Arnab, Anup, Debajyoti, Debasmita, Nilanjan, Paranjayee, Supratik, Nisia, Hillol, Bramha & Manoj and for making my stay at UK delightful.
-ix-
DECLARATION
-x-
LIST OF TABLES
Table 3.1 Literature review of part shape error modelling approaches with identified research gap ... 50
Table 3.2 Major shape error decomposition approaches with applications and limitations ... 58
Table 3.3 Literature review of shape variation modelling approaches with identified research gap ... 61
Table 3.4 Multivariate statistical process monitoring approaches and research gap for shape error related defects monitoring ... 68
Table 3.5 Literature review of fixture layout optimisation approaches with identified research gap ... 72
Table 4.1 Comparison of SMA method and proposed GMA method ... 83
Table 4.2 Diversified application of 2.5D DCT vs. proposed GMA (based on 3D DCT) application ... 84
Table 5.1 Current shape variation modelling approaches with their applications and limitations... 114
Table 5.2 Comparative analysis between the generated composite parts and original part deviation by quantifying the average residue surface ... 134
-xi-
LIST OF FIGURES
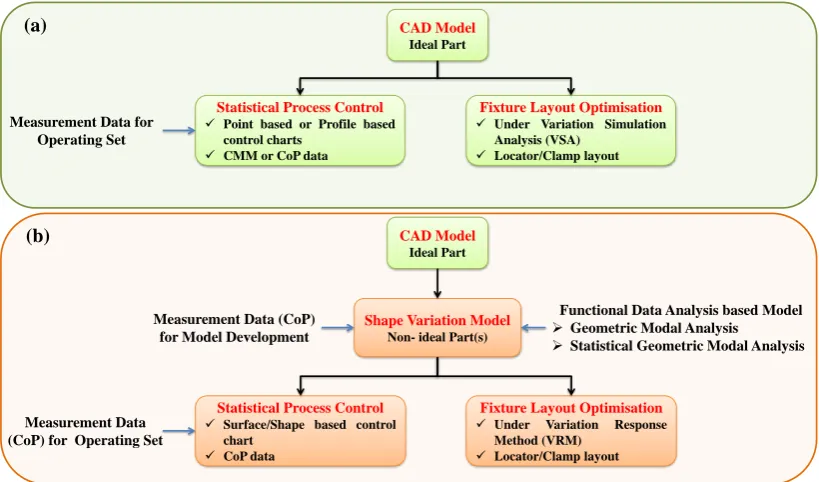
Figure 1.1 Shape variation modelling, analysis and statistical control: (a) ideal CAD model based current approach, and (b) shape variation model (non-ideal parts) based proposed research framework ... 12
Figure 1.2 Pictorial representation of modelling and application requirements for shape variation modelling, analysis and statistical control ... 17
Figure 1.3 Organisation of this thesis and research areas ... 21
Figure 2.1 Variation propagation from KCC to KPC in an assembly process by Ding et al. (2002) ... 25
Figure 2.2 Automotive sheet metal assembly locator types (Shiu et al., 1996) ... 30
Figure 2.3 ‘N-2-1’ (N=4) locating scheme for sheet metal parts (Camelio and Hu, 2004) ... 30
Figure 2.4 RLW requirements for tight part-to-part gap control (Ceglarek, 2011) ... 32
Figure 2.5 Compliant part measurement (a) using CMM at few specific sampled points, and (b) using 3D non-contact optical scanners to capture entire product surface information (i.e. CoP data) ... 34
Figure 2.6 Current applications vs proposed applications of CoP measurement data ... 35
Figure 2.7 Use of CoPs measurement data for shape error modelling, shape variation modelling and statistical process control ... 40
Figure 3.1 Current PCA- or PLS-based approaches vs. the proposed GMA-based decomposition approach ... 67
Figure 4.1 Normal deviation calculations from nominal features to CoP... 86
-xii-
Figure 4.3 Voxelisation process: (a) nominal mesh model and deviation calculation at mesh node, and (b) bounding box computation and voxel grid mapping (L×M×N) ... 89
Figure 4.4 GMA-based shape error modelling steps using top hat part: (a) data pre-processing, (b) pictorial representation, and (c) actual representation ... 96
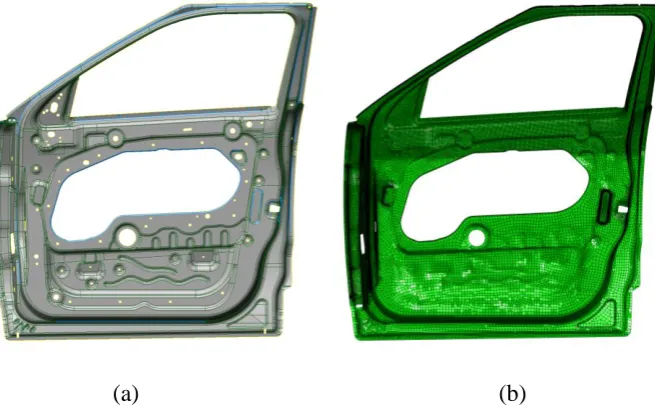
Figure 4.5 Automotive door components hinge reinforcement and door inner panel as in assembly configuration ... 97
Figure 4.6 Voxel grid size selection ... 99
Figure 4.7 Hinge reinforcement part: (a) mesh model of hinge reinforcement (b) measured shape error from CoP, (c) voxelisation of error data (Voxel grid size = 20×20×40, used for visualization only), and (d) voxel elements containing error data only (Voxel grid size = 60×60×100) ... 99
Figure 4.8 GMA decomposed major shape error modes of the hinge reinforcement part ... 100
Figure 4.9 Shape error (i.e. deviation plot) of the hinge reinforcement: (a) original shape error plot, (b) GMA reconstructed shape error plot, and (c) error plot between original shape error and GMA reconstructed shape error. ... 101
Figure 4.10 Door inner panel of automotive door: (a) nominal door part, and (b) mesh model of the part ... 102
Figure 4.11 GMA decomposition of door inner panel into significant shape error modes ... 102
Figure 4.12 Few main shape error modes with their interpretation ... 103
-xiii-
Figure 4.14 Hinge surface deviation: (a) Original shape error, (b) Rebuild shape error using natural mode decomposition (200 modes), and (c) Rebuild shape error using GMA decomposition (200 modes) ... 106
Figure 4.15 Comparison of natural modes and GMA modes: (a) root sum of squares of the shape error of residue surface, and (b) standard deviation of the shape errors of residue surface ... 107
Figure 5.1 Overview of Statistical Geometric Modal Analysis (SGMA) method for shape variation modelling ... 116
Figure 5.2 GMA based modal matrix creation by using a batch of top hat parts ... 119
Figure 5.3 Statistical characterisation of modal parameters using top hat parts ... 121
Figure 5.4 Statistical characterisation of modal parameters using KDE ... 122
Figure 5.5 Generation of variational virtual parts based on statistical characterisation of modal parameters ... 122
Figure 5.6 Synthesis of maximum and minimum energy compacted composite parts based on top hat parts ... 126
Figure 5.7 Door inner panel of automotive door: (a) nominal CAD model, and (b) mesh model of the part ... 128
Figure 5.8 Main shape error modes identification of a batch of parts using GMA decomposition ... 129
Figure 5.9 Statistical characterisation of modal parameters of door inner panel by determining the probability density function (PDF) using KDE ... 130
Figure 5.10 Silhouettes graph plot for (a) 2 clusters; (b) 3 clusters; (c) 4 clusters; and (d) 5 clusters ... 131
-xiv-
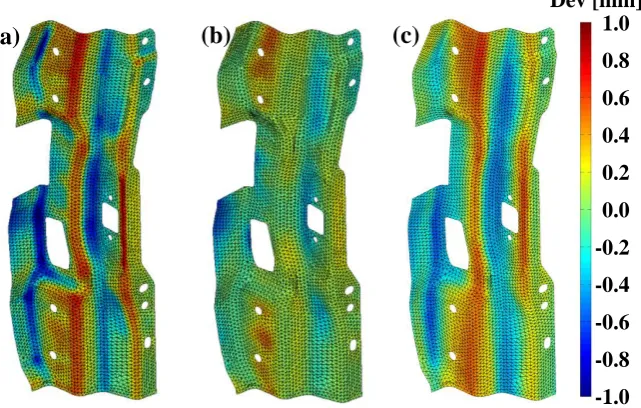
Figure 5.12 Average residue surface plot by using maximum, minimum and RSS based composite parts(deviation in mm) ... 133
Figure 6.1 Overview of shape monitoring methodology driven by GMA method ... 142
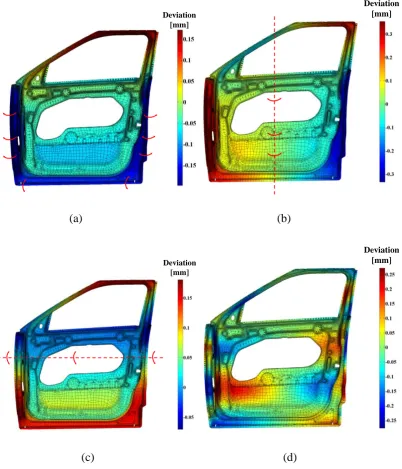
Figure 6.2 Increased sensitivity of control chart by joint T2- Q statistics ... 150
Figure 6.3 Hinge reinforcement part of automotive door: (a) original shape error computed from CoP, and (b) decomposed shape error modes (LVs) ... 152
Figure 6.4 Joint probability density function (PDF) of integrated T2-Q statistics for hinge reinforcement part ... 153
Figure 6.5 2D plot of confidence regions estimation with 95% and 99% confidence intervals of integrated T2-Q statistics ... 153
Figure 6.6 Control chart operating characteristics behaviour with changing global mean shift ... 155
Figure 6.7 Product data with global mean shifts of (a) 0.1 mm, and (b) 0.15 mm at 95% and 99% confidence interval ... 156
Figure 6.8 Univariate chart (log scale) on joint analysis of T2 and Q statistics for global mean shift of hinge reinforcement parts ... 157
Figure 6.9 Product shape error with localised part deformation by 1.0 mm ... 158
Figure 6.10 T2-Q control chart for locally deformed hinge reinforcement parts .... 158
Figure 6.11 Univariate chart (log scale) on joint analysis of T2 - Q statistics for locally deformed hinge reinforcement parts ... 159
Figure 6.12 GMA-based T2-Q control chart plot considering mean shift and variance induced data sets ... 161
-xv-
Figure 6.14 ARL comparison between PCA-based and GMA-based T2-Q control chart: (a) global mean shift, and (b) local deformation ... 162
Figure 7.1 Schematic representation of the KPC and KCC locations: (a) the KCC (clamp) movement from start to end point in the design space, (b) cross sectional view of part-to-part interactions along with KPC and KCC, and (c) KPC lengthwise part-to-part gap distribution with upper specification limit to satisfy the KPC quality criteria ... 172
Figure 7.2 Overview of fixture design optimisation considering production batch of sheet metal parts ... 174
Figure 7.3 Overview of optimisation framework with objective function... 181
Figure 7.4 Door inner panel and hinge reinforcement assembly configuration .... 182
Figure 7.5 Synthesis of composite parts (deviation in mm) for hinge reinforcement component using SGMA methodology ... 183
Figure 7.6 Map Index (MI) for composite parts of hinge cluster 2 and individual hinge parts belong to the cluster assembled with nominal door inner component ... 184
Figure 7.7 Synthesis of composite parts (deviation in mm) for door inner component using SGMA methodology ... 185
Figure 7.8 Map Index (MI) for composite parts of door inner cluster 1 and individual door inner parts belong to the cluster assembled with nominal hinge component... 186
Figure 7.9 Map Index (MI) for composite assemblies of inner cluster 1 and hinge cluster 2 with 30 randomly generated variation hinge-inner assemblies ... 186
Figure 7.10 Probability of joining feasibility index plot (surrogate model) for selected composite assemblies (a) with respect to KCC1 and KCC2,
-xvi-
Figure 7.11 Hinge reinforcement and door inner panel composite assembly: (a) initial clamp layout, (b) optimised clamp layout, (c) clamp movement, and (d) optimised clamp location values ... 192
Figure 7.12 Map Index (MI) at optimised clamp location for selected composite assemblies (SCA) ... 193
-xvii-
LIST OF PUBLICATIONS
1. Das, A., Franciosa, P., Prakash, P.K.S., Ceglarek, D., 2014, “Transfer Function of Assembly Process with Compliant Non-ideal Parts”, Procedia CIRP, 21, 177-182.
2. Franciosa, P., Das, A., Ceglarek, D., Bolognese, L., Marine, C., Mistry, A., 2014, “Design Synthesis Methodology for Dimensional Management of Assembly Process with Compliant non-Ideal Parts”, 2014 International Joint Conference on Mechanical, Design Engineering & Advanced Manufacturing, June 18-20, Toulouse, France.
This paper received BEST PAPER AWARD at the 2014 International Joint Conference on Mechanical, Design Engineering and Advanced Manufacturing held in Toulouse, France. A total of 95 papers were presented during the conference.
The Best Student Poster award at the 2013 British Computer Society (BCS) University Challenge for poster titled: “RLW Navigator: Software Architecture and Multidisciplinary Optimisation for Embedding New Production Processes.”
3. Das, A., Franciosa, P., & Ceglarek, D., 2016, “Geometric Modal Analysis (GMA) for Shape Error Modeling and Analysis in Manufacturing”, to be submitted to IEEE Transaction on Industrial Informatics.
4. Das, A., Franciosa, P., & Ceglarek, D., 2016, “Statistical Geometric Modal Analysis (SGMA) for Shape Variation Modeling and Analysis in Manufacturing”, to be submitted to IEEE Transaction on Industrial Informatics.
5. Das, A., Franciosa, P., & Ceglarek, D., 2016, “Using Control Charts to Monitor Process and Product Quality Shapes”, to be submitted to IEEE Transaction on Industrial Informatics.
6. Das, A., Franciosa, P., & Ceglarek, D., 2015, “Fixture Layout Optimisation Considering Production Batch of Compliant Non-Ideal Sheet Metal Parts”, Procedia Manufacturing, 1, 157-168.
-xviii-
ABSTRACT
Modern competitive market demands frequent change in product variety, increased production volume and shorten product/process change over time. These market requirements point towards development of key enabling technologies (KETs) to shorten product and process development cycle, improved production quality and reduced time-to-launch. One of the critical prerequisite to develop the aforementioned KETs is efficient and accurate modelling of product and process dimensional errors. It is especially critical for assembly processes with compliant parts as used in automotive body, appliance or wing and fuselage assemblies. Currently, the assembly process is designed under the assumption of ideal (nominal) products and then check by using variation simulation analysis (VSA). However, the VSA simulations are oversimplified as they are unable to accurately model or predict the effects of geometric and dimensional variations of compliant parts, as well as variations of key characteristics related to fixturing and joining process.
This results in product failures and/or reduced quality due to un-modelled interactions in assembly process. Therefore, modelling and prediction of the geometric shape errors of complex sheet metal parts are of tremendous importance for many industrial applications. Further, as production yield and product quality are determined for production volume of real parts, thus not only shape errors but also shape variation model is required for robust assembly system development. Currently, parts shape variation can be measured during production by using recently introduced non-contact gauges which are fast, in-line and can capture entire part surface information. However, current applications of non-contact scanners are limited to single part inspection or reverse engineering applications and cannot be used for monitoring and statistical process control of shape variation. Further, the product shape variation can be reduced through appropriate assembly fixture design. Current approaches for assembly fixture design seldom consider shape variation of production parts during assembly process which result in poor quality and yield. To address the aforementioned challenges, this thesis proposes the following two enablers focused on modelling of shape errors and shape variation of compliant parts applicable during assembly process design phase as well as production phase: (i) modelling and characterisation of shape errors of individual compliant part with capabilities to quantify fabrication errors at part level; and (ii) modelling and characterisation of shape variation of a batch of compliant parts with capabilities to quantify the shape variation at production level.
-xix-
modes from the fabricated part measurement data. This model is used to decompose shape errors of 3D sheet metal part into orthogonal shape error modes which can be used for product and process interactions. Further, the enabler can be used for statistical process control to monitor shape quality; fabrication process mapping and diagnosis; geometric dimensioning and tolerancing simulation with free form shape errors; or compact storage of shape information.
The second enabler aims to model and characterise shape variation of a batch of compliant parts by extending the GMA approach. The developed functional model called Statistical Geometric Modal Analysis (SGMA) represents the statistical shape variation through modal characteristics and quantifies shape variation of a batch of sheet metal parts a single or a few composite parts. The composite part(s) represent major error modes induced by the production process. The SGMA model, further, can be utilised for assembly fixture optimisation, tolerance analysis and synthesis. Further, these two enablers can be applied for monitoring and reduction of shape variation from assembly process by developing: (a) efficient statistical process control technique (based on enabler ‘i’) to monitor part shape variation utilising the surface information captured using non-contact scanners; and (b) efficient assembly fixture layout optimisation technique (based on enabler ‘ii’) to obtain improved quality products considering shape variation of production parts. Therefore, this thesis proposes the following two applications:
The first application focuses on statistical process control of part shape variation using surface data captured by in-process or off-line scanners as Cloud-of-Points (CoPs). The methodology involves obtaining reduced set of statistically uncorrelated and independent variables from CoPs (utilising GMA method) which are then used to develop integrated single bivariate T2-Q monitoring chart. The joint probability density estimation using non-parametric Kernel Density Estimator (KDE) has enhanced sensitivity to detect part shape variation. The control chart helps speedy detection of part shape errors including global or local shape defects.
The second application determines optimal fixture layout considering production batch of compliant sheet metal parts. Fixtures control the position and orientation of parts in an assembly process and thus significantly contribute to process capability that determines production yield and product quality. A new approach is proposed to improve the probability of joining feasibility index by determining an N-2-1 fixture layout optimised for a production batch. The SGMA method has been utilised for fixture layout optimisation considering a batch of compliant sheet metal parts.
-xx-
LIST OF SYMBOLS AND ACRONYMS
GD&T Geometric Dimensioning and Tolerancing CAD Computer-Aided Design
CoP Cloud-of-Points
KPCs Key Product Characteristics KCCs Key Control Characteristics RLW Remote Laser Welding FEM Finite Element Method GMA Geometric Modal Analysis
SGMA Statistical Geometric Modal Analysis
3D DCT Three-Dimensional Discrete Cosine Transform
3D IDCT Three-Dimensional Inverse Discrete Cosine Transform SMA Statistical Modal Analysis
FEA Finite Element Analysis RSS Root Sum of Squares SD Standard Deviation
SPC Statistical Process Control KDE Kernel Density Estimator PDF Probability Density Function CMM Coordinate Measuring Machine RE Reverse Engineering
LVs Latent Variables
PCA Principal Component Analysis ARL Average Run Length
-xxi-
𝑓(𝑥, 𝑦, 𝑧) Deviation at a coordinate of (x,y,z) 𝑔(𝑥, 𝑦, 𝑧, 𝑢, 𝑣, 𝑤) A forward transformation kernel ℎ(𝑥, 𝑦, 𝑧, 𝑢, 𝑣, 𝑤) An inverse transformation kernel 𝑇(𝑢, 𝑣, 𝑤) A transformation coefficient
Nn Number of mesh node coordinates (x,y,z)
Dn Deviation vector at mesh node Nn
L × M × N Voxel grid size
f(i,j,k) Voxel element deviation in voxel space at (i,j,k) 𝐶(𝑢, 𝑣, 𝑤) 3D DCT coefficient vector
E Energy compaction threshold
e Coefficient index set after energy compaction
q
Correlation coefficient of qth coefficient
q
T Mesh node deviations associated with qth coefficient
α Threshold for correlation criteria based coefficient selection c Coefficient index set after correlation threshold
Truncated coefficient index set
q
wt Least squares based weightage associated with qth coefficient 𝜀 Residue error vector
𝐶̃(𝑢, 𝑣, 𝑤) Truncated coefficient vector
𝑓̃(𝑖, 𝑗, 𝑘) Deviation after reconstruction of surface
-xxii- p Number of preserved modes wt Weightage vector for modes Nv Number of virtual parts generated
K Kernel function
) , ~ ( ˆ C h
F Kernel density estimator function
h Bandwidth or smoothing parameter of KDE 𝑅 Number of cluster
p C
E~ Energy compaction index
max ~ ) (
p C
E Maximum energy compaction index
min ~ ) (
p C
E Minimum energy compaction index
max
Modal parameters set for maximum energy compacted part
min
Modal parameters set for minimum energy compacted part
𝐷𝑅𝑆𝑆 Optimal mesh node deviation after root sum of squares error
LS
Modal parameters set for RSS criteria based composite part
q Number of modes selected per part 2
k
T T2 statistic for kth instance
k
Q Residual statistic for kth instance
L
C ,CM,CN Cosine basis transform matrices
L
,M,N Matrix product operator
N Number of primary datum plane locators 𝑁𝑠𝑡 Number of stitches (i.e. KPCs)
p Probability of joining feasibility index
-xxiii-
𝐶𝑃𝑇𝑚,𝑚𝑎𝑥 Maximum energy compacted composite part of part id m
𝐶𝑃𝑇𝑚,𝑚𝑖𝑛 Minimum energy compacted composite part of part id m
𝐶𝑃𝑇𝑚,𝑎𝑣𝑔 Average energy compacted composite part of part id m
𝐶𝑃𝑇𝑀𝐴𝑋 Set of maximum composite parts in the assembly 𝐶𝑃𝑇𝑀𝐼𝑁 Set of minimum composite parts in the assembly 𝐶𝑃𝑇𝐴𝑉𝐺 Set of average composite parts in the assembly
𝐶𝐴 Set of Composite Assembly
𝑀𝐼𝑖,𝑗 Map Index of ith KPC of jth composite assembly
𝑇𝑀𝐼𝑗 Total Map Index of jth composite assembly
𝜌𝑗,𝑘 Correlation coefficient between jth and kth assemblies
𝑁𝑐𝑙 Number of clusters of composite assemblies
𝐼𝑖,𝑗 Information (I) contained on the 𝑖𝑡ℎ MI of 𝑗𝑡ℎ assembly
𝑝𝑖,𝑗 Probability of satisfying the joining requirements of 𝑀𝐼𝑖,𝑗
𝐻𝑗 Entropy of 𝑗𝑡ℎ complete assembly
-1-
INTRODUCTION
CHAPTER 1
1.1
M
OTIVATION-2-
Three dimensional compliant sheet metal parts [also under the category of ‘freeform shaped parts’ (Savio et al., 2007)] are extensively used for many industrial applications such as automotive body, aerospace wing /fuselage or home appliances. One of the key challenges to deal with compliant sheet metal parts is conforming to the dimensional and geometric quality as defined by geometric dimensioning and tolerancing (GD&T) during design phase. Further, dimensional and geometric/shape variations of sheet metal assemblies play a vital role to achieve final product quality. Previous studies have reported that the presence of shape variation in sheet metal parts contributes up to two third of the engineering changes in automotive body and aircraft fuselage assembly (Ceglarek and Shi, 1995; Shalon et al., 1992). Therefore, part shape management and shape variation control through modelling are inevitable prerequisite for assembly process simulation with compliant parts. The assembly process simulation with shape variation reduces the occurrence of defects during manufacturing and product usage. Therefore, shape variation modelling, analysis and control could be the key enabling technologies (KETs) to put manufacturer at the forefront of the competitive market by improving product quality, shortening product development time and detecting failures at early stage of assembly process.
-3-
ideal part assumption. Therefore, there is an urgent need for geometric shape errors modelling of compliant sheet metal parts for many industrial applications. Further, a batch of sheet metal parts, produced by forming processes (such as stamping), are not geometrically and dimensionally identical. As a result, their characteristics also vary during fixturing or joining processes and produce lower quality product and reduced production yield. Therefore, for robust assembly system development with compliant sheet metal parts, not only shape error modelling is important but also shape variation modelling is equally important. Thus, modelling and characterisation of shape variation help to identify the process behaviours for better production quality and yield.
However, traditional assembly process simulation exhibits shortcomings to address the aforementioned shape errors and shape variation modelling requirements in the following way:
i. Shape errors modelling of real part (real part also called in this thesis as
-4-
embedded compliant sheet metal modelling is necessary to reveal the un-modelled interactions with fixture and joining processes during assembly for more accurate assembly process simulation. Hence, many industrial applications have tremendous need for efficient modelling of shape errors of 3D freeform shaped part.
ii. Shape variation modelling of a batch of real parts (batch of real parts also
called in this thesis as non-ideal production parts): Sheet metal parts, produced by plastic deformation during forming processes such as stamping, consist of shape errors which are varying from part-to-part (i.e. production parts consist of shape variation). The main causes of shape variation are due to variation in fabrication process, tooling and material. For example, sheet metal stamping process shows variation of key control characteristics such as press tonnage, shut height, press parallelism (Zhou and Cao, 1994) as well as spring back problem, tool wear, material thickness variation, uneven load distribution or variation caused by part handling, etc. (Ceglarek et al., 2001). Further, a batch of sheet metal parts consists of various shape error patterns with changing magnitude of those shape error patterns. Subsequently, modelling and prediction of shape errors associated with individual non-ideal part is not sufficient to meet current industrial needs. It emphasises to quantify the shape variation engraved within a batch of parts. Therefore, shape variation modelling of batch of parts is required to quantify accurately the non-ideal production parts during assembly process simulation.
-5-
performance and functionality, but also for manufacturability and ease of assembly. Shape variation also directly impacts on the perceived product quality, and is a critical quality measure of the final product. Further, these two enablers can be utilised for shape variation monitoring and reduction from the assembly process by developing: (a) statistical process control chart (based on enabler ‘i’) to monitor part shape variation and detect part shape errors related faults from the assembly process; and (b) efficient assembly fixture layout optimisation technique (based on enabler ‘ii’) to obtain improved quality products considering shape variation of production
parts. However, traditional statistical process control charts and assembly process simulation with batch of non-ideal compliant parts exhibits shortcomings to address the aforementioned application requirements in the following way:
a. Statistical process control of part shape errors and detection of shape errors
-6-
use of the non-contact scanners is limited to: (a) part inspection, i.e. comparing the measured part with Computer Aided Design (CAD) model of the part (ideal part); or (b) reverse engineering applications, i.e. generating CAD model of a given part by using the measurement data (Son et al., 2002). However, recent advances in fast speed of capturing part surface data during off-line or in-line measurement expand the opportunities of surface scanner to be used for part surface quality monitoring and shape defects detection. To monitor the pre- and post- assembly product quality, there is a strong need for statistical process control method to efficiently and effectively monitor quality of non-linear shapes using CoP data.
b. Assembly process simulation for assembly fixture layout optimisation
-7-
1.2
C
URRENTL
IMITATIONS AND THEP
ROPOSEDR
ESEARCHF
RAMEWORK FORS
HAPEV
ARIATIONM
ODELLING,
A
NALYSISAND
S
TATISTICALC
ONTROLModelling, Analysis and statistical control of shape variation of compliant sheet metal parts are not trivial tasks as they involve freeform 3D shapes (i.e. 3D shapes having irregular contours, edges, holes, slots etc.), non-functional data (i.e. CoP measurement can be categorised as non-functional data as it cannot be used directly), extraction of shape error patterns from the CoP data (i.e. functional data analysis based approach is required to extract useful information from the CoP measurement). For efficient modelling and analysis of assembly system with compliant parts, compact and accurate functional data analysis based approaches are required to model and characterise (i) the shape errors of individual compliant part, and (ii) the shape variation of a batch of compliant parts. Further, these two enablers help to extend the current application of 3D non-contact scanners from (a) part inspection to statistical process control - to overcome the limitation associated with the use of 3D non-contact scanners for shape monitoring, and (b) reverse engineering to design optimisation - to extend the current practice of design optimisation from individual part shape errors based approach to production shape variation based approach. Therefore, modelling and characterisation of part shape errors and production shape variation as mentioned in (i) and (ii) are crucial to monitor process behaviour as in (a) and optimise the process with batch of compliant parts as in (b).
-8-
1.2.1 Current Limitations for Shape Variation Modelling, Analysis and
Statistical Control
Attempts have been made to model the shape error of compliant sheet metal part and shape variation of batch of compliant sheet metal parts. However, the current available techniques raise major limitations, to address the shape error and shape variation modelling requirements, and subsequently, shape variation monitoring by using statistical process control charts and shape variation reduction by assembly fixture layout optimisation, in the following way:
(i) Limitations to model shape error of compliant sheet metal part: Current shape error modelling approaches can be categorised into: (a) shape error representation – the measured CoP data is mapped with nominal CAD data to represent shape error by obtaining the deviation field (Gupta and Turner, 1993; Sorkine, 2006; Franciosa et al., 2011; Wagersten et al., 2014); and (b) shape error decomposition – to understand and establish the relationship between part shape error and the source of variation, the shape error is required to be decomposed into a series of independent shape error modes (Tonks, 2002; Huang and Ceglarek, 2002; Samper and Formosa, 2006; Huang et al., 2014). To address shape error modelling as an enabler for shape variation monitoring or shape variation reduction, the current available techniques have the following limitations:
─ To provide a generic model with capabilities to extract underlying
process information from measured CoP data.
─ To support assembly process simulation related tasks (such as design
-9-
provide a parametric relation between nominal data (i.e. CAD data) and measured data (i.e. CoP data).
─ To provide an approach to decompose shape error (measured CoP
data) of 3D freeform shaped part into orthogonal shape error modes.
Due to these limitations, a universal functional data analysis based model is required to express shape error of 3D freeform shaped part in a coherent manner by integrating nominal features (ideal/nominal shape information) with manufacturing variability (real shape information).
(ii) Limitations to model shape variation of batch of compliant sheet metal parts:
In assembly process, production shape variation plays significant role to achieve quality results. To address the production shape variation, current methods have following assumptions and limitations:
─ The extracted shape error modes based on shape error decomposition
approaches (Samper et al., 2009; Huang et al., 2014) are normally distributed. However, real complex process, such as sheet metal stamping, seldom adheres with it as stamping process exhibits variance shift or mean shift during within batch or batch-to-batch production.
─ Data-driven approach, such as Principle Component Analysis
(Camelio et al., 2004b), used for shape variation modelling ignores the underlying production behaviour of identifying process mean shift or variance shift in measured data set (Matuszyk et al., 2010).
─ These methods are limited to virtual generation of production parts
-10-
Due to the aforementioned assumptions and limitations, an effective shape variation characterisation and quantification technique is necessary.
(iii) Limitations to monitor part shape variation and fast detection of shape error
related faults: Available monitoring techniques are mainly limited to point feature based control (Chen et al., 2004; Antory, 2007; Phaladiganon et al., 2013) or profile feature based control (Jin and Shi, 2001; Woodall et al., 2004; Colosimo and Pacella, 2007) and they are not able to cope with high dimensional CoP data to monitor non-linear shapes. Current monitoring and statistical control techniques are mainly suffering from:
─ Monitoring of shape variation, as point feature or profile feature
based control charts do not reveal all types of shape related errors. ─ Extracting all the underlying shape error related information from the
captured CoP data as currently used data dimensionality reduction techniques, such as Principal Component Analysis (PCA) or Partial Least Squares (PLS) are not suitable for shape error characterisation. ─ Normality assumption of the measurement data which is a strong
assumption for real fabrication process and it might cause problem for fast detection of faults.
Due to the aforementioned limitations, a proactive shape monitoring technique is necessary which can detect shape related faults using CoP data.
(iv) Limitations to reduce product shape variation by using assembly fixture to
-11-
current assembly fixture design does not consider production shape variation during assembly process simulation and exhibits lack of capability to model Key Product Characteristics (KPCs- such as part-to-part gap, joining requirements) with respect to large number of KCCs. They are mainly lacking the following:
─ Assembly fixture layout optimisation considering production shape
variation to improve product quality and production yield.
─ Consideration of high dimensional design space, due to number of
parts to be assembled in an assembly station and large number of KCCs, to achieve required product quality.
─ Identifying the highly non-linear relationship between KPCs and
KCCs to improve fixture design.
Due to the aforementioned issues and limitations, an assembly fixture layout optimisation technique is required considering production shape variation in order to improve joining quality and eventually the production yield.
As evident from the abovementioned limitations presented in this section, new models and methods are required for modelling shape error and shape variation, and subsequently, statistical process control to monitor shape variation and process design to reduce shape variation.
1.2.2 Proposed Research Framework for Shape Variation Modelling,
Analysis and Statistical Control
-12-
[image:36.595.114.524.302.543.2]system. On the contrary, real fabricated parts are not ideal and their behaviour varies with the type of errors contained within it. Therefore, CAD based ideal part is not sufficient to represent the shape errors associated with the real parts (i.e. non-ideal parts). Figure 1.1(a) depicts the current approach for statistical process control and fixture analysis which are mainly based on the ideal CAD model. Further, ideal part based process control fails to monitor part shape variation and fast detection of shape errors related faults. Similarly, ideal part based variation simulation analysis has limited capability to reduce product shape variation during assembly operation.
Figure 1.1 Shape variation modelling, analysis and statistical control: (a) ideal CAD model based current approach, and (b) shape variation model (non-ideal parts) based proposed research framework
The proposed research framework for shape variation modelling, analysis and statistical control is shown in Figure 1.1(b) where, firstly, shape variation models are developed to represent non-ideal part(s), thereafter, statistical process control and fixture analysis are carried out to monitor and reduce shape variation from the assembly process.
CAD Model
Ideal Part
Statistical Process Control
Point based or Profile based
control charts
CMM or CoP data
Fixture Layout Optimisation
Under Variation Simulation
Analysis (VSA)
Locator/Clamp layout
CAD Model
Ideal Part
Statistical Process Control
Surface/Shape based control
chart
CoP data
Fixture Layout Optimisation
Under Variation Response
Method (VRM)
Locator/Clamp layout
Measurement Data (CoP) for Operating Set
Shape Variation Model
Non- ideal Part(s)
Measurement Data (CoP) for Model Development
Functional Data Analysis based Model Geometric Modal Analysis Statistical Geometric Modal Analysis Measurement Data for
Operating Set
(a)
-13-
In the context of shape variation modelling, analysis and statistical control, this thesis defines the following research objectives:
(i) To model and characterise shape errors of individual compliant part: a functional data analysis based shape error model which characterises and quantifies the measured 3D free-form shape error of sheet metal part by decomposing into significant shape error modes.
(ii) To model and characterise shape variation of a batch of compliant parts: an extension of the part shape error model, to characterise shape variation of a batch of parts by identifying the significant shape error modes [research objective (i)] and quantifying them by means of its identified magnitude. (iii)To detect the shape error related defects from assembly process: an
application based extension of shape error model [research objective (i)] to develop a Multivariate Statistical Process Control (MSPC) approach for detecting shape error related faults which has ability to process multi-dimensional CoP data for monitoring non-linear shapes.
(iv) To optimise assembly fixture layout considering production batch: an application based extension of shape variation model [research objective (ii)] to develop a robust fixture layout optimisation method considering shape variation which improves the product quality and production yield.
To meet the aforementioned research objectives, this thesis develops research methodologies for ‘Shape Variation Modelling, Analysis and Statistical Control’ to provide the following capabilities:
(i) Shape error characterisation and extraction of shape error modes from
-14-
measurement data (CoP as non-functional data), a novel functional data analysis based shape error decomposition method is proposed. The extracted shape error modes have mathematical representation which can be further used for: (a) design synthesis to identify the KCCs through optimisation and indicates towards the possible failure of the system through root cause analysis; (b) monitoring and diagnosis of assembly process to identify shape related defects; (c) statistical tolerance simulation with shape error for compliant sheet metal parts; and (d) storage of real part shape error information as historical data for future design and manufacturing.
The proposed shape error model, named Geometric Modal Analysis (GMA), aims to develop a universal functional model which expresses shape error in a coherent manner by integrating design features (CAD information) with manufacturing variability (CoP information). The GMA model is presented in Chapter 4.
(ii) Shape variation characterisation and quantification of batch of complaint
-15-
variation by synthesising ‘composite part’ which is composed of all major shape error modes associated with a batch of parts. The generated virtual parts and composite parts can be further used for: (a) assembly process optimisation considering batch of parts which is pointing towards the robust fixture layout optimisation, such as, jig and fixture design; (b) statistical characterisation of the production process to predict the process capability aiming to produce quality products; and, (c) statistical tolerance synthesis of assembly system with non-ideal compliant parts. The SGMA model is presented in Chapter 5.
(iii)Monitoring and detection of shape related faults of compliant parts: Current control charts cannot be used for shape-monitoring using high dimensional data (CoPs) captured by in-process or off-line sensors. To detect shape related faults and abnormal process behaviour, a novel control chart based monitoring approach has been developed using GMA model. The control chart has ability to: (a) detect global shape faults such as unwanted variance change or mean shift, a common occurrence for within batch or batch-to-batch production of stamping process; (b) detect local shape defects such as local shift or variance change; and, (c) classify the shape faults to predict manufacturing quality and yield. Chapter 6 develops the control chart to monitor and detect shape related faults of compliant part.
-16-
(iv) Assembly fixture layout optimisation considering production batch: To develop robust fixture invariant to shape variation, a fixture layout optimisation method has been proposed considering production batch of parts. It is an extension of current application of non-contact scanners from reverse engineering of a single part (obtaining CAD model from the measurement data) to design optimisation of assembly process with batch of compliant parts. It provides significant improvements which are reflected in (a) less fixture tuning quality loop and adjustments; (b) shorter product development time; and (c) enhanced product quality. Chapter 7 proposes the assembly fixture layout optimisation method by improving the fixture capability to produce quality product. This work has been disseminated as a conference paper (Das et al., 2015).
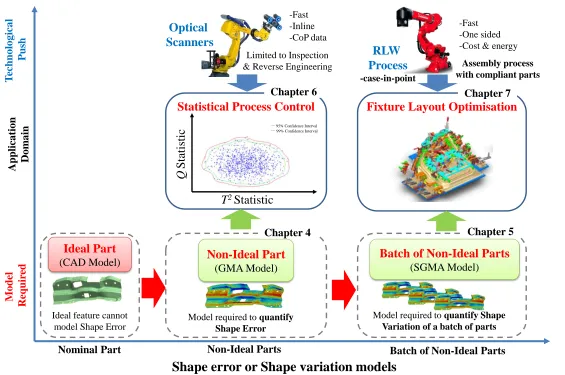
This section describes the methodologies required for shape variation modelling, analysis and control with their capabilities. Figure 1.2 shows the modelling and application requirements for shape variation modelling, analysis and statistical control with emerging technologies.
.
In this thesis, a GMA-based integrated bivariate monitoring chart is proposed for statistical process monitoring of non-linear shapes. The control chart uses high dimensional data (CoPs) captured by in-process or off-line sensors with ability to fast detection of shape error related defects.
-17-
Figure 1.2 Pictorial representation of modelling and application requirements for shape variation modelling, analysis and statistical control
Shape error or Shape variation models
M o del Requir ed Ideal Part (CAD Model)
Ideal feature cannot model Shape Error
Nominal Part T echno lo g ica l Push Applica tion Do m a in
Batch of Non-Ideal Parts
Batch of Non-Ideal Parts (SGMA Model)
Model required to quantify Shape Variation of a batch of parts
Non-Ideal Parts
Non-Ideal Part (GMA Model)
Model required to quantify Shape Error Optical Scanners -Fast -Inline -CoP data
Limited to Inspection & Reverse Engineering
Statistical Process Control
Q Sta
ti
stic
s
T2Statistics
__95% Confidence Interval
__99% Confidence Interval
Fixture Layout Optimisation
-Fast -One sided -Cost & energy RLW
Process
-case-in-point
Assembly process with compliant parts
T2Statistic
Q
Stat
isti
c
Chapter 4 Chapter 5
[image:41.842.144.709.114.489.2]-18-
1.3
R
ESEARCHC
ONTRIBUTIONSThis thesis proposes a research framework for ‘Shape Variation Modelling, Analysis and Statistical Control’. The proposed methodologies are motivated by the requirements of assembly system modelling with compliant sheet metal parts, especially for automotive and aerospace applications. The research contributions of the proposed methodologies are as follows:
(i) Modelling and characterisation of shape error -GMA Method
Development of a functional data model bridging design and manufacturing: The functional data analysis based approach helps to bridge the gap between design characteristics (CAD data) and manufacturing characteristics (CoP measured data) and identifies major shape error modes produced by the fabrication process.
Measurement data (CoPs) based shape error decomposition: The proposed GMA method extracts orthogonal shape error modes from measured CoP data (i.e. from real fabricated part). Further, GMA decomposes shape error of 3D freeform shaped part where the previous measured data decomposition methods are limited to 1D or 2D cases. Compact model representation: It is always preferable to develop a
tractable model with mathematical representation which can be utilised for further applications, such as design optimisation, tolerance analysis, statistical process control or storage of shape error information.
(ii)Modelling and characterisation of shape variation – SGMA Method
-19-
modes has been overcome by using Kernel Density Estimation (KDE). The statistical characterisation of shape error modes depicts real scenario of production parts by generating variational virtual parts.
Quantification of shape variation of a batch of parts by synthesising composite part(s): The quantification of shape variation of a batch of parts is not available in literature. The SGMA method develops a novel technique to quantify the shape variation into single or few composite part(s) which is composed of major shape error modes present in a batch of parts. The SGMA method acts as enabler to optimise the fixture design process considering not only the individual part but also a batch of parts.
(iii) Control charts to monitor process and product quality shapes –
GMA-based integrated bivariate monitoring chart
New direction to obtain the reduced variable set to synthesise multivariate statistics: a new direction of obtaining reduced set of statistically uncorrelated and independent process variables by decomposing the data set within a single sample (GMA decomposition) instead of PCA- or PLS-based decomposition which is done across the samples. This emphasises the enhanced granularity of decomposition which then leads towards enhanced shape fault detectability.
Use of high dimensional CoP data for shape monitoring: The control chart has the ability to process the high dimensional CoP data captured by modern 3D non-contact scanners. Therefore, the proposed control chart can be used for shape monitoring and defects detection using CoP data. Fast detection of shape error related defects: The control chart has the
-20-
metal stamping, variance change may be observed for within-batch production or mean shift may present for batch-to-batch production. The localised mean shift or variance change can also be detected using the proposed control chart. Further, the proposed GMA-based control chart has the ability to detect shape defects quickly as average run length reduces faster than the state-of-the-art PCA-based control chart.
(iv) Optimisation of assembly fixture layout considering production batch –
SGMA-based fixture layout optimisation
Part shape variation based fixture layout optimisation: The fixture layout optimisation considering shape variation significantly goes beyond the current state-of-the-art and practice as the fixture can be designed and optimised not only for individual part shape errors based but a batch of parts shape variation based. The composite parts based optimisation reduces the design space and it helps to eliminate thousands of variational assembly instances based Monte-Carlo simulation.
Assembled product quality improvement: As production yield and product quality are determined based on production volume of real parts, fixture simulation considering shape variation improves the product quality and production yield.
-21-
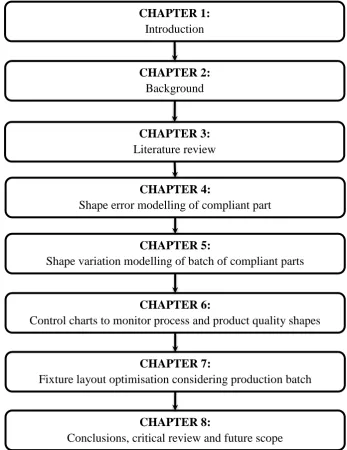
1.4
O
RGANISATION OF THET
HESIS [image:45.595.141.489.214.665.2]The organisation of this thesis is depicted in Figure 1.3 with addressed research areas for shape variation modelling, analysis and statistical control. This thesis is organised into eight chapters with introduction being the first.
Figure 1.3 Organisation of this thesis and research areas CHAPTER 1:
Introduction
CHAPTER 2: Background
CHAPTER 3: Literature review
CHAPTER 4:
Shape error modelling of compliant part
CHAPTER 5:
Shape variation modelling of batch of compliant parts
CHAPTER 6:
Control charts to monitor process and product quality shapes
CHAPTER 7:
Fixture layout optimisation considering production batch
CHAPTER 8:
-22-
Chapter 2 introduces the background knowledge about the major terminologies, basic concepts of assembly station and measurement station for compliant parts, and case-in-point used in this thesis.
Chapter 3 reviews the literature related to modelling and characterisation of shape error and shape variation. Further, it reviews the reported work on statistical process control and fixture design optimisation considering the non-ideal compliant parts.
Chapter 4 describes in details the methodology used for modelling and characterisation of shape error of individual compliant part. It also demonstrates the results with other state-of-the-art methods available in literature.
Chapter 5 details the methodology used for modelling and characterisation of shape variation of a batch compliant parts by using statistical characterisation and synthesising composite parts.
Chapter 6 develops a new methodology to detect shape related faults by introducing new multivariate statistical process control charts to take advantage from measured CoP data. The methodology developed in Chapter 4 has been used as base kernel to develop the control chart.
Chapter 7 uses the obtained results from Chapter 5 to demonstrate the usability of shape variation quantification model to conduct fixture layout optimisation. It optimises the key control characteristics to obtain satisfied key product characteristics.
-23-
BACKGROUND
CHAPTER 2
This chapter focuses on the background information related to the proposed work, with a brief introduction to the assembly process with compliant parts, measurement of compliant parts/subassemblies. As this thesis develops the research framework for ‘Shape variation modelling, analysis and statistical control’, where (i) shape error
model and (ii) shape variation model act as enablers to (a) monitor shape variation with capabilities to detect shape defects, and, (b) reduce shape variation with proper fixture design to improve product quality. The research framework involves compliant sheet metal parts which are assembled at assembly station and measured at measurement station to support many assembly related tasks and inspection checks. Starting with an overview of assembly station with compliant parts, special focus has been drawn on variation modelling of rigid ideal part modelling, compliant part modelling, and non-ideal (i.e. shape error) compliant part modelling for assembly system. Further, this chapter outlines the current industrial usage of 3D non-contact scanners based measurement data for quality inspection and reverse engineering followed by extended usage of these scanners for compliant part monitoring and shape defects detection. As case-in-point, this thesis uses Remote Laser Welding joining application for validation and verification of the developed methodologies.
2.1
A
SSEMBLYS
TATION WITHC
OMPLIANTP
ARTS-24-
techniques which result in sub-assembled or final assembled product (Camelio et al., 2003). The following subsections describe the basic concepts of assembly key characteristics to inspect product quality, management of assembly variation associated with compliant parts, assembly fixturing with complaint parts and assembly joining of sheet metal parts with emerging remote laser welding.
2.1.1 Assembly Key Characteristics
In an assembly operation, one of the most important challenges is to manage dimensional and geometric quality as it has direct impact on product functionality and performance (Camelio et al., 2003). In assembly process, dimensional and geometric qualities are defined with important dimensional and geometric relations which are referred as key characteristics (KC) (Whitney, 2004). A comprehensive definition of key characteristics is proposed by Thornton (1999) as ‘Key Characteristics are the product, subassembly, part, and process features that significantly impact the final cost, performance, or safety of a product when the KCs vary from nominal’. To obtain a good assembled product quality, KCs are to be
-25-
qualities of a product are determined through Key Product Characteristics (KPCs) and Key Control Characteristics (KCCs). KPCs are the identified crucial features which are needed to be controlled to achieve the functionality of the product and KCCs are the controlling elements such as position of fixture elements, clamps, pins and NC blocks (Ding et al., 2002). Ding et al. (2002) also mentioned that an assembly system can be broken into several layers corresponding to the process-KC, part-KC and product-KC where Figure 2.1 illustrates the variation propagation from KCC to KPC for assembly station with compliant parts.
Figure 2.1 Variation propagation from KCC to KPC in an assembly process by Ding et al. (2002)
2.1.2 Input: Compliant Parts
One of the major challenges associated with compliant sheet metal assembly is the proper characterisation of variation in the assembly process. Due to intrinsic flexible nature of compliant sheet metal parts, variation occurs during assembly process interactions among parts, holding fixtures or joining processes.
In general, variation in manufacturing and assembly can be defined as physical deviation from the nominal characteristics of a part due to manufacturing, fabrication or assembly process errors. To quantify, analyse and tolerate the amount of variation, tolerance analysis and synthesis is well known in literature. Internationally
KCC (Process-KC)
Part-KPC (Process-KC)
Product-KPC (Product-KC)
Variation propagation
-26-
recognised standards, such as ISO-Geometrical Product Specification (ISO-17450-1, 2011) or ANSI-GD&T (ASME, 2004), have been developed for tolerance specification which defines general terms for geometrical features of part. Many works related to variation modelling of part are directly linked with the tolerance analysis and synthesis. The variation modelling can be broadly classified into two categories: (i) rigid body modelling, and (ii) flexible/deformable body modelling. In the first category, parts are assumed to be rigid where no part deformation has been allowed. This is suitable for machined component modelling, jig or fixture components modelling. In later case, parts are deformed with additional force, assembly variation such as sheet metal parts. Similarly, depending on the presence of dimensional and geometric error components in the part model, it can be either ideal part model or non-ideal part model. In case of ideal part modelling, the part is modelled to its nominal geometry which consists of ideal features, ideal dimensions and ideally placed with ideal orientation. On the contrary, non-ideal part modelling considers the error components associated with different features in addition to the ideal features such as size and orientation errors, geometrical shape errors etc. As per the modelling trend observed in the literature, the compliant part modelling approaches can be divided into three categories: (i) ideal rigid part modelling, (ii) ideal compliant part modelling, and (iii) non-ideal compliant part modelling. Different approaches have been adapted in literature to model the aforementioned three categories.