warwick.ac.uk/lib-publications
Original citation:
Zubkov, Mikhail V. , Martin, Adrian P., Hartmann, Manuela, Grob, Carolina and Scanlan,
David J. . (2015) Dominant oceanic bacteria secure phosphate using a large extracellular
buffer. Nature Communications, 6. 7878.
Permanent WRAP URL:
http://wrap.warwick.ac.uk/69448
Copyright and reuse:
The Warwick Research Archive Portal (WRAP) makes this work of researchers of the
University of Warwick available open access under the following conditions.
This article is made available under the Creative Commons Attribution 4.0 International
license (CC BY 4.0) and may be reused according to the conditions of the license. For more
details see: http://creativecommons.org/licenses/by/4.0/
A note on versions:
The version presented in WRAP is the published version, or, version of record, and may be
cited as it appears here.
Received 13 May 2015|Accepted 19 Jun 2015|Published 22 Jul 2015
Dominant oceanic bacteria secure phosphate
using a large extracellular buffer
Mikhail V. Zubkov
1, Adrian P. Martin
1, Manuela Hartmann
1, Carolina Grob
2& David J. Scanlan
2The ubiquitous SAR11 and Prochlorococcus bacteria manage to maintain a sufficient supply of phosphate in phosphate-poor surface waters of the North Atlantic subtropical gyre. Furthermore, it seems that their phosphate uptake may counter-intuitively be lower in more productive tropical waters, as if their cellular demand for phosphate decreases there. By flow sorting33P-phosphate-pulsed32P-phosphate-chased cells, we demonstrate that both
Prochlorococcusand SAR11 cells exploit an extracellular buffer of labile phosphate up to 5–40 times larger than the amount of phosphate required to replicate their chromosomes. Mathematical modelling is shown to support this conclusion. The fuller the buffer the slower the cellular uptake of phosphate, to the point that in phosphate-replete tropical waters, cells can saturate their buffer and their phosphate uptake becomes marginal. Hence, buffer stocking is a generic, growth-securing adaptation for SAR11 and Prochlorococcus bacteria, which lack internal reserves to reduce their dependency on bioavailable ambient phosphate.
DOI: 10.1038/ncomms8878 OPEN
1National Oceanography Centre, Ocean Biogeochemistry & Ecosystems Research Group, European Way, Southampton SO14 3ZH, UK.2School of Life
P
hosphorus, a vital element for cellular energetics and growth as well as the ultimate controller of oceanicproductivity1, is acquired by oceanic bacterioplankton
primarily as phosphate2,3. Strongly stratified surface seawater
can be depleted in phosphate down to concentrations of a
few nanomoles per litre4–6. Despite this, the dominant
bacterioplankton7 of these low-phosphate regions, the SAR11
alphaproteobacteria8 and Prochlorococcus cyanobacteria9, are
almost as abundant and metabolically active as anywhere else
in the ocean10,11. Somehow these bacteria maintain a sufficient
supply of phosphate in apparently phosphate-poor waters. We show that the rates of phosphate uptake by SAR11 and
Prochlorococcus cells vary by an order of magnitude from
the temperate to the equatorial North Atlantic, whilst their amino-acid and ATP uptake rates, as well as CO2fixation rates by
Prochlorococcuscells, remain constant. Their phosphate uptake is
counter-intuitively lower in more productive tropical waters, as if cellular demand for phosphate decreases there. This contradiction
is resolved using a novel 33P-phosphate pulse 32P-phosphate
chase experimental approach. By flow sorting dual-labelled cells,
we demonstrate that both Prochlorococcus and SAR11 cells
possess an extracellular buffer of labile phosphate.
Results
Identification of bacterioplankton dominant groups. An experimental field study was carried out on the two Atlantic Meridional Transect (AMT) research cruises with similar tracks across the North Atlantic subtropical gyre in October–November 2010 and 2012 (Supplementary Fig. 1).
Microbial cells, flow sorted from the two main groups of bacterioplankton during the 2010 cruise, were taxonomically identified using fluorescencein situhybridization7. High-nucleic
acid-containing bacteria, based on DNA staining with
SYBR Green I that had virtually undetectable chlorophyll
autofluorescence12, were phylogenetically affiliated with
Prochlorococcus7, in agreement with our previously reported
results2. An average of 88±4% (n¼10) of flow-sorted,
DNA stained with 4,6-diamidino-2-phenylindole (DAPI) cells
conferred signals with theProchlorococcus-specific probe PRO405
(ref. 13). The majority of the flow-sorted cells with low nucleic acid content affiliated to the SAR11 clade7; 93±6% (n¼9) of DAPI-stained cells were positively identified using a set of probes that target different regions of the SAR11 rRNA improving
our earlier result2 and allowing us to refer to the low-nucleic
acid-containing bacteria as SAR11 alphaproteobacteria. On the basis of the molecular identification of the two bacterioplankton
populations, SAR11, followed by Prochlorococcus, numerically
dominate surface waters of the North Atlantic subtropical gyre (Supplementary Fig. 2).
Microbial uptake of bioavailable nutrients. We used the
modified Wright and Hobbie bioassay technique2,14to estimate
concentrations and microbial uptake rates of phosphate, amino acid—methionine (indication of microbial growth)—and ATP (indication of microbial organic phosphate acquisition; Supplementary Figs 3–5, see Methods for details). We flow sorted
radiotracer-labelled cells to quantify Prochlorococcusand SAR11
group-specific uptake rates. First, we compared cellular uptake rates of phosphate with cellular uptake rates of other molecules to ascertain the extent of misbalance of molecule acquisition (Fig. 1), that is, do the cellular uptake rates of other molecules like amino
acids or ATP or CO2 fixation (indication of phytoplankton
growth) also decrease in more productive equatorial waters?
Second, we carried out experiments using a33P-phosphate pulse
followed by a 32P-phosphate chase to determine the potential
role of extracellular buffer in phosphate acquisition by
Prochlorococcus and SAR11 (Supplementary Fig. 1, large and
medium yellow squares).
According to the isotope dilution bioassay and cell flow sorting results of the 2010 cruise, uptake rates of methionine and ATP by SAR11 cells are relatively constant, varying within an order of magnitude. The uptake rates of phosphate by SAR11 cells contrasted with their uptake rates of both ATP and methionine (Fig. 1a), in that there was a 15-fold drop in cellular phosphate uptake at the boundary between the gyre centre and more populous, productive and nutrient-rich tropical surface waters (Supplementary Figs 1–2,4–5). The drop in phosphate uptake of SAR11 cells was reproducible on the two cruises and coincided with an increase in ambient phosphate uptake time (turnover) to
410 h (Supplementary Fig. 4c).
Constancy of their methionine uptake rate indicates that SAR11 cells synthesize their proteins at comparable rates across the North Atlantic. However, they seem to need less phosphate for their growth in more productive waters. On the basis of the size of the representativePelagibacter ubiquegenome15, a SAR11 cell requires 2.6106molecules of phosphate for its chromosome replication. According to our results, a SAR11 cell could acquire
40
30
20
10
40
30
20
10 SAR11
Latitude (°N)
Latitude (°N)
Pro
Uptake (molecules per cell per hour) Uptake (molecules per cell per hour)
103 104 105 106 107 108 103 104 105 106 107 108
Met ATP Pi
P i 2012 CO
2
a
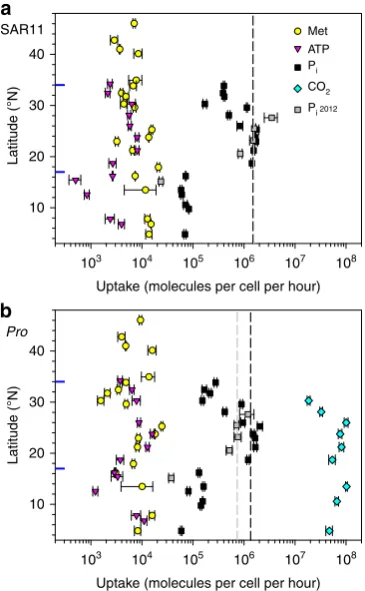
[image:3.595.337.520.52.348.2]b
Figure 1 | Latitudinal distribution of cellular nutrient uptake and CO2 fixation rates of the two dominant bacterioplankton groups.Latitudinal distribution of nutrient uptake rates of SAR11 (a) and of nutrient uptake and CO2fixation rates ofProchlorococcus(Pro) (b) cells in the North Atlantic subtropical gyre on the 2010 cruise. The nutrients were methionine (Met), ATP and inorganic phosphate (Pi). Only cellular uptake rates of inorganic phosphate (Pi2012) were measured on the 2012 cruise. Black and grey dashed lines indicate median rates of Piuptake in the phosphate-depleted centre of the gyre during the 2010 and 2012 cruises, respectively. Blue horizontal tick lines indicate boundaries of the central gyre. Error bars indicate propagated standard errors of combined measurements of microbial nutrient uptake rates, cell abundances and radiotracer concentrations in flow-sorted cells.
that amount of phosphate inB2.5 h in the gyre centre, whilst it would take one nearly 38 h to acquire the same amount of phosphate in tropical waters at the rates measured. If we assume that phosphate quota in DNA is about one-fourth of the amount of phosphate required for producing a daughter cell, then hypothetically SAR11 cells could divide twice per day in the gyre and every 6 days in the tropical waters. Hence, based on phosphate uptake data, SAR11 cells should grow slower in tropical waters than in the gyre centre. This is in contradiction to the results of their methionine uptake, according to which they should grow at a similar rate.
The second dominant bacterioplankton cells,Prochlorococcus
cyanobacteria, show similar reduction in the uptake of phosphate relative to their uptake rates of ATP and methionine as well as
relative to their CO2 fixation rates in tropical waters compared
with the gyre centre (Fig. 1b). Similar to SAR11 cells, the uptake
rate of phosphate byProchlorococcuscells decreased abruptly by
eight times. On the basis of the size of the Prochlorococcus
marinus genome16, a Prochlorococcus cell could acquire the
3.3106 molecules of phosphate required for chromosome
replication in B3.3 h in the gyre centre, whilst it would take a
Prochlorococcus cell 27 h to acquire the same amount of
phosphate in tropical waters. Making a similar assumption that there is about a quarter of cellular phosphate in DNA, then
hypothetically Prochlorococcus cells could divide twice a day in
the gyre and every 4—5 days in tropical waters, which is completely opposite to what we observed in the South Atlantic gyre17.
For Prochlorococcus, the corresponding molar ratio between
hourly CO2fixation and phosphate uptake would be 65 and 530
in the gyre centre and tropical waters, respectively. Taking into
account that these cyanobacteria can fix CO2 only during the
hours of daylight while they can take up phosphate 24 h a day, the first ratio is closer to the Redfield molar elemental ratio of 106 (refs 18,19). The second ratio of 530 (or double this allowing for the difference in periods of acquisition) is an order of magnitude different from the Redfield ratio, suggesting that normal growth
ofProchlorococcuscells in more productive tropical waters could
be impeded by a deficit in phosphorus. The latter conclusion would not explain the observed higher concentrations of
Prochlorococcuscells there (Supplementary Fig. 2). The consistent
drop in phosphate uptake rate by SAR11 and Prochlorococcus
cells in tropical waters is unlikely to be due to a decrease in their metabolic activity because the rates of uptake of the other molecules studied remained unchanged whilst the concentrations of cells increased. Furthermore, the concentration of bioavailable phosphate in surface tropical waters remained similar or increased but by no more than three times (Supplementary Fig. 4). Therefore, the drop in phosphate uptake rate by these microorganisms is not related to cell growth.
Assessing microbial extracellular phosphate buffer. A plausible explanation for the reduction in uptake of phosphate in tropical waters could be the existence of large extracellular phosphate
buffers, because SAR11 and Prochlorococcus do not store
phos-phate in cells20,21. To assess how significant such a microbial
extracellular phosphate buffer is, we first carried out experiments
using a 33P-phosphate pulse, chased with unlabelled phosphate
(Supplementary Fig. 6a). The results of these experiments
consistently show a slowing down of 33P-phosphate uptake
after addition of the chase at 1,000 times higher concentration compared with the pulse (Supplementary Fig. 6b). Nevertheless,
the uptake of 33P-phosphate pulse continued steadily during
Z8 h after the chase was added. The possibility of the effect being
due to the cells switching to a lower-affinity transport system during the chase is unlikely because such transporters have
not been found in Prochlorococcus and SAR11 genomes.
Furthermore, the amount of acquired phosphate (accounting
for chase dilution of the 33P tracer) during the chase would be
approximately equivalent to cellular biomass, which is unrealistic. The existence of a large extracellular phosphate buffer associated with bacterioplankton cells yet distinct from bioavailable phosphate dissolved in seawater explains the continued
uptake of 33P-phosphate from this buffer of phosphate tracer
accumulated during the pulse. For comparison, the cellular pools
of amino acids are exhausted within the first hour of chase22.
However, in the case of phosphate, there were no signs of pulse stabilization (Supplementary Fig. 6b).
To find out how cells maintain their phosphate buffers, we carried out more complex experiments in which the
33P-phosphate pulse was chased with higher concentrations
of phosphate, but this time the chase was labelled with a
32P-phosphate tracer (Fig. 2, top row). An example of our
approach is as follows: a seawater sample was pulsed with
0.8 nmol phosphate per l labelled with 33P-phosphate. After
incubation at in situ temperature in the dark for 1 h, a chase
labelled with32P-phosphate was added at a concentration of 80 or 800 nmol phosphate per l and the sample was incubated for a further 2 h. In control experiments, a sample pulsed with 0.8 nmol
phosphate per l labelled with 33P-phosphate was chased with
32P-phosphate tracer addition (o0.01 nmol phosphate per l).
Microbial uptake of33P and32P tracers was followed during the pulse and chase phases of the incubation.
In agreement with the isotope dilution bioassays
(Supplementary Fig. 3) similar uptake rates of the two tracers in the control chase incubations (Supplementary Fig. 7) con-firmed that bacterioplankton cells did not differentiate between
33P- and 32P-labelled phosphate. If there was no labile buffer of
phosphate associated with cells, then one would expect that uptake of the two phosphate tracers during the chase phase would be similar, with rate measurements close to the unity line (Supplementary Fig. 7). However, the uptake rates of the two tracers were markedly different, because the uptake of the
33P-phosphate pulse was not halted by the chase (Supplementary
Fig. 7). These consistent results confirmed the presence of an extensive buffer of labile phosphate associated with bacterio-plankton cells.
To further examine the hypothesis that phosphate, held in a buffer, is used by bacterioplankton cells a simple numerical model was developed to simulate uptake of phosphate by a population of cells (details in Methods section). Each cell takes up phosphate into its buffer at a rate controlled by the degree to which the buffer is full; uptake decreases as it fills and stops when the buffer is full. However, phosphate is transported from the buffer into the cell for macromolecule synthesis and energetics at constant rates reflecting cellular metabolism. Figure 2 shows that this simple model can nevertheless capture the main features of experiments at two contrasting sites (Supplementary Fig. 1, large yellow squares) simultaneously. The only model parameters allowed to vary between the two sites were the ambient phosphate concentration and the degree to which the buffer is full at the start of the experiments. Observations are used to set the initial number of cells (Supplementary Fig. 2a). Even though the predicted uptake is lower than observations, the model captures the persistently increasing 33P uptake when 32P-labelled chases are applied at 1 h. When the model did not account for a buffer,
no solution was found where the33P uptake did not decrease on
addition of the 32P chase. Although care must be exercised
2107 molecules. This estimate is not far from the experimen-tally determined buffer of a mean bacterioplankton cell
(3.2107 molecules), being 3.5 times smaller compared with
the buffer of SAR11 cells (7107molecules) and being 1.7 times
higher compared with the buffer of Prochlorococcus cells
(1.2107molecules) in the gyre centre (Fig. 3).
100 100
50 50
0
100
50
0
100
50
0
100
50
0
100
50
0 100
50
0
100
50
0
0
100
50
0
100
50
0
100
50
0
100
50
0
0 1 2 3
0 1 2 3
0 1 2 3
0 1 2 3 0 1 2 3 0 1 2 3 0 1 2 3 0 1 2 3 0 1 2 3
0 1 2 3 0 1 2 3 0 1 2 3 0 1 2 3 0 1 2 3
0 1 2 3 0 1 2 3 0 1 2 3 0 1 2 3 0 1 2 3
0 1 2 3 0 1 2 3 0 1 2 3 0 1 2 3 0 1 2 3
T
ropical w
a
ters
Gyre centre
33
Pi
uptak
e
,
% of max
33P
i
33
Pi uptak
e
,
% of max
33
Pi
32
Pi uptak
e
,
% of max
32
Pi
32P
i uptak
e
,
% of max
32P
i
Time (h) Time (h) Time (h) Time (h) Time (h)
Time (h)
Added 31P
i Ambient 31Pi Added 32Pi Added 33Pi
0.1
0.01
0.1
0.01
1:1,000 dil 1:100 dil
Control 1:1,000 dil
1:100 dil Control
1,000 1,000
100 100
10
1 10
1
1,000
100
10
1
0.1
0.01
0 1 2 3 0 1 2 3 0 1 2 3 0 1 2 3 0 1 2 3 0 1 2 3
Sum P
i
, nmol l
[image:5.595.52.550.50.618.2]–1
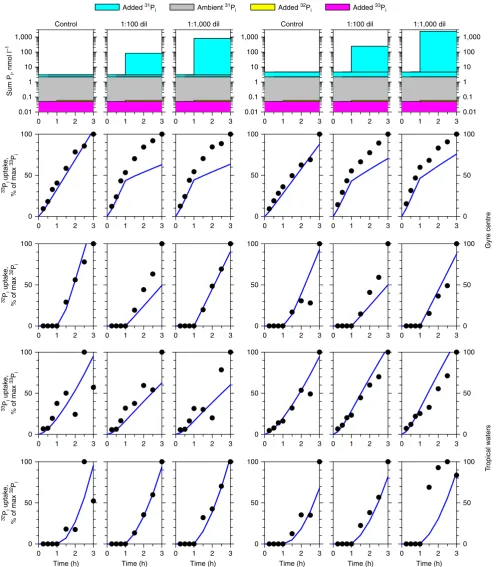
Figure 2 | Comparison of observations and model output of inorganic phosphate uptake during33P-phosphate pulse and32P-phosphate chase experiments.Observations (black circles) and model output (blue lines) of traced inorganic phosphate (33P
iand32Pi) in cells during six pulse–chase experiments (top row of plots) at two contrasting sites: least productive waters of the gyre centre and more productive tropical waters. Seawater samples with bioassayed ambient31Piwere pulsed with 0.8 or 2.4 nmol l1 31Pilabelled with 0.05 nmol l1 33Piand chased after 1 h incubation with 80 or 800 nmol l1and 240 or 2,400 nmol l1of31P
ilabelled with 0.01 nmol l1 32Pi. Note that observations and model output values are normalized to the maximum uptake measure (counts per minute per ml) in a time course in each experiment to lie between 0 and 100%. dil, dilution.
To assess whether the size of the buffer differs between bacterioplankton groups, total bacterioplankton, SAR11 and
Prochlorococcus cells were flow sorted from samples fixed at
different time points of the 33P-pulse 32P-chase experiments.
Cells were sorted from samples fixed at the end of the pulse and
at the end of the chase phases (Fig. 2). Uptake of 33P and 32P
tracers was compared between flow-sorted cells of SAR11,
Prochlorococcus and average bacterioplankton. The size of the
buffer was estimated based on the uptake results of both tracers, the key parameter being the ratio of33P to32P uptake during the chase phase (see Methods for details).
Uptake of32P-phosphate by sorted cells in chase experiments
could be determined only in experiments with the lowest dilution (1:100) because of detection limitations with one exception at the station in tropical waters (Supplementary Fig. 1, bottom large square), where uptake of phosphate was particularly low (Fig. 3).
Compared with the 32P tracer, the rate of 33P tracer uptake
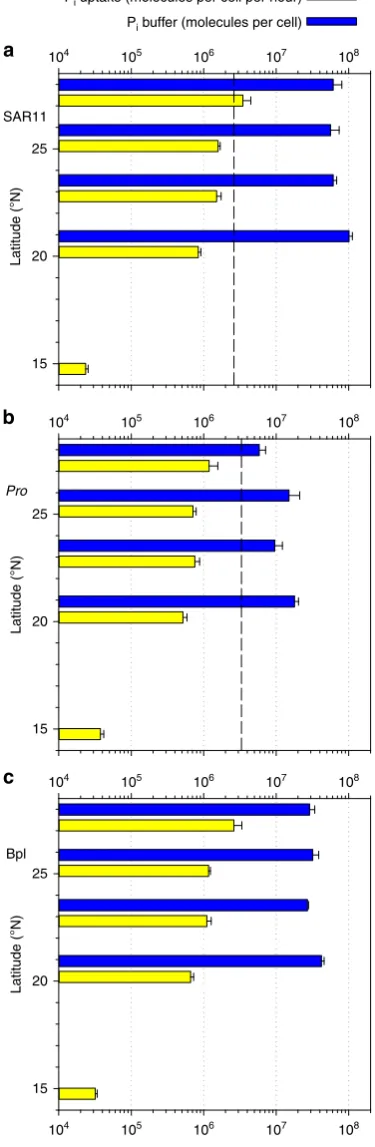
during the chase phase of both dilutions was measurable in sorted cells of all the groups at all stations and at all dilutions. This fact strongly indicates the presence of a buffer of phosphate associated with all the cells. The estimated size of the buffer exceeded the hourly amount of phosphate uptake by SAR11 and
Prochlorococcus by on average of 53 and 18 times, respectively
(Fig. 3a,b). Because cumulatively the two groups accounted for the majority (B70%) of bacterioplankton (Supplementary Fig. 2), it was reassuring that the buffer for mean bacterioplankton cells exceeded the hourly amount of phosphate uptake by the intermediate average of 32 times (Fig. 3c). Indirectly, it implies that bacterioplankton cells in other taxa could also have sizable phosphate buffers. In other words, cellular phosphate buffers could be common among bacterioplankton.
For SAR11 cells the estimated phosphate buffer was 27 times the amount of phosphate required for genomic DNA replication
(Fig. 3a). The phosphate buffer of Prochlorococcus cells was
smaller, on average 3.6 times the amount of phosphate in genomic DNA (Fig. 3b). The phosphate buffer of SAR11 cells was consistently bigger than the buffer ofProchlorococcuscells (paired
t-test,Po0.05). This implies that SAR11 cells may have a higher phosphate buffer capacity. However, we would exercise caution in generalizing the ecological significance of the difference con-sidering the limited number of independent measurements. Furthermore, irrespective of the differences in buffer sizes, the
phosphate uptake rates of SAR11 andProchlorococcuscells were
not different (paired t-test), suggesting similar phosphate
acquisition efficiency of the two bacteria with different buffer capacity.
The existence of the phosphate buffer can explain the lower rates of phosphate uptake by bacterioplankton in more productive, phosphate-replete tropical surface waters (Fig. 1). The degree of saturation of the cellular phosphate buffer increases from the gyre centre to equator (Fig. 3), in parallel with the increase in concentration of bioavailable phosphate and the increase in phosphate turnover time towards the equator (Supplementary Fig. 4a,c). The above suggests that bacterio-plankton do not experience much difficulty in filling their extracellular buffers in phosphate-depleted waters and conse-quently control the concentration of bioavailable phosphate in these strongly stratified surface waters. At 20.6°N the sum of the phosphate buffers of bacterioplankton cells was 14 times higher
than the 2.3-nmol l1of bioavailable ambient phosphate. At the
same time, bacterioplankton continued to take up bioavailable phosphate at a rate of 0.5 nmol l1h1. A few degrees closer to the equator the bacterioplankton phosphate buffer approaches saturation, the demand for buffering phosphate is reduced and the rate of uptake of bioavailable phosphate by both SAR11 and
Prochlorococcuscells drops by an order of magnitude, whilst their
Pi uptake (molecules per cell per hour)
Pi buffer (molecules per cell)
104 105 106 107 108
104 105 106 107 108
104 105 106 107 108
104 105 106 107 108
SAR11
25
25 20
20 15
15
25
20
15
Pro
Bpl
Latitude (°N)
Latitude (°N)
Latitude (°N)
a
b
[image:6.595.334.522.56.631.2]c
uptake rates of other molecules (methionine, ATP and CO2)
remain high (Fig. 1).
Discussion
Buffering should be taken into account when quantifying cellular phosphate uptake. Because labile phosphate could dissociate
from fixed cells23, a phosphate chase is commonly used as an
alternative to fixation to stabilize the amount of phosphate
radiotracer in living cells24,25. However, the presented
experimental evidence (Fig. 2, Supplementary Figs 6–7) suggests that such a pulse–chase approach should be used with caution. It could lead to considerable overestimation of phosphate uptake rates, because chasing with unlabelled phosphate does not stop uptake of the pulsed phosphate radiotracer.
The idea that bacteria could store phosphate as energy and growth reserves is not new—storage of phosphate inside prokaryotic as well as eukaryotic cells in the form of poly-phosphate is well documented. However, neither SAR11 nor
Prochlorococcuscells store polyphosphates20,21. Presumably they
either do not have enough space inside their small cells or it is energetically untenable for them to accumulate those granules.
Instead, Prochlorococcus and SAR11 cells seem to keep a
phosphate reserve outside their cells as a buffer. The association of the phosphate buffer with bacterial cells is reversible. However, it is not a result of uncontrolled adsorption to the cell surface, because bacterial uptake of phosphate tracers is linear over a period of 1–1.5 h (Supplementary Figs 3a–b,6b), while adsorption saturates within minutes. The extracellular location of the buffer is indicated by the ease of its removal from cells. Similar to how
washing Trichodesmium and other phytoplankton cells with
oxalate removes up to 90% of adsorbed phosphate19, washing
bacterioplankton with tri-potassium-citrate removes on average 85 and 70% of phosphate tracers from bacterioplankton cells that
had been incubated with more than 20 and 0.8 nmol l1 of
added phosphate, respectively, before the cells were fixed
(Supplementary Fig. 8a). However, when o0.05 nmol l1 of
33P-phosphate was used for labelling cells, citrate could remove
only 10% of tracer from labelled, fixed cells (Supplementary Fig. 8b). It seems that when additional amounts of phosphate as small as 0.8 nmol l1 become available, bacterial cells fill their buffers presumably to secure a sufficient amount of phosphate to complete the division cycle. In contrast to nonspecific phosphate sorption to eukaryotic algal surfaces19bacteria are able to readily access their buffered phosphate without compromising cell viability whilst the divided cells rapidly replenish their now-depleted phosphate buffer. Where concentrations of bioavailable phosphate are higher than a few nanomoles, for example, in the North–East Atlantic, central South Atlantic and Arabian Sea, the bacterioplankton phosphate buffer is generally full and therefore microbial phosphate uptake is close to detection limit and does not have a typical linear time course. Perhaps, the phosphate buffer is required for normal metabolism of oceanic bacterioplankton. The constantly low phosphate concentrations in the strongly stratified surface waters of the North Atlantic subtropical gyre allow the buffer and its role in microbial uptake to be delineated. The existence of the extracellular buffer also suggests that bioavailability of phosphate is most likely patchy at a micron scale of bacterioplankton environment.
Thus, the bacterioplankton that dominate the phosphate-depleted regions of the ocean exploit a large extracellular buffer to meet their phosphate requirements. Both SAR11 and
Prochlorococcus accumulate phosphate rather than balance its
uptake with the uptake of other molecules. Such a phosphate buffer could be a common feature for the majority of microbial cells. Buffering of vital nutrients explains how bacteria without internal reserves can still secure their growth.
Methods
Sampling and cell enumeration.The study was carried out during two transatlantic cruises, AMT-20 and AMT-22, on board the Royal Research Ships James Cook and James Clark Ross in October 2010 and 2012, respectively. Surface seawater samples were collected before dawn from a depth of 20 m, a representative depth of the surface mixed layer unaffected by the ship’s movement and contamination, with a sampling rosette of 20-l Niskin bottles mounted on a conductivity–temperature–depth profiler at stations identified in Supplementary Fig. 1. Samples were gently transferred into a 10-l polyethylene carboy. All plasticware and glassware were soaked in 10% HCl and extensively rinsed with sampled sea water. Microbial cell abundances (Supplementary Fig. 2) were determined by flow cytometry (FACSort and FACSCalibur instruments, Becton Dickinson, Oxford, UK) in samples, fixed with 1% (w/v) paraformaldehyde (PFA) final concentration and stained with SYBR Green I DNA dye26.
All experiments were set up within 20 min after sample collection.
CO2fixation byProchlorococcuscells.To assess CO2fixation by the smallest prokaryotic phototrophs,Prochlorococcuscells, trace metal-free NaH14CO
3tracer (34.66 mmol l1NaH14CO3, DHI, Denmark) was added to a 60-ml sample in a Pyrex glass bottle (250 kBq ml1final radioactivity). The sample was then incubated at ambient temperatures controlled by a refrigerated water bath (Grant Instruments, UK) in a 6-l acrylic glass water tank illuminated by a warm white light-emitting diode array (Photon Systems Instruments, Czech Republic) adjusted to a constant output of 500mmol photons per m2per s, mimicking the average
in situlight conditions at 20 m depth in subtropical waters7,12.
Bioassaying of bioavailable phosphate, ATP and methionine.The concentra-tions of bioavailable phosphate, methionine, ATP and microbial uptake rates were estimated at 20, 13 and 17 stations, respectively, on the 2010 cruise (Supplementary Figs 4–5) using an isotope dilution, concentration series bioassay2,7. L-[35S] methionine (specific activity41,000 Ci mmol 11, Hartmann Analytic GmbH, Braunschweig, Germany) was added at a concentration of 0.05 nM and diluted with unlabelledL-methionine (Sigma Aldrich, Dorset, UK) using a dilution series spanning the range 0.05–1.0 nM. [a33P]-ATP (specific activity
43,000 Ci mmol 11, Hartmann Analytic) was added at a concentration of 0.05 or
0.1 nM and diluted with non-labelled ATP–disodium salt hydrate (Sigma Aldrich) using a dilution series in the range 0.1–2.0 nM.33P-phosphate tracer (specific activity 100 TBq mM1, Hartmann Analytic) was added to samples at
o0.05 nmol l1final concentration and diluted with unlabelled orthophosphoric
acid using a dilution series spanning the range of 0.4–4.0 nM. On the 2012 cruise only the bioavailable concentration and microbial uptake of phosphate were estimated at 11 stations (Supplementary Fig. 2). Multiple replicated 1.6-ml samples were incubated in crystal clear screw cap microtubes (Starlab, Milton Keynes, UK) atin situtemperature in the dark and fixed with 1% (w/v) PFA.
Microbial33P-phosphate pulse,32P-phosphate chase labelling.At five stations of the 2012 cruise (Supplementary Fig. 1) dual phosphate tracer pulse–chase experiments were carried out (Fig. 2). Briefly,33P-phosphate tracer was added to samples ato0.05 nmol l1final concentration simultaneously with 0.8 nmol l1
of unlabelled31P-phosphate. After 1 h incubation in the dark atin situ
tempera-ture, a set of samples was fixed with 1% (w/v) PFA to determine33P uptake in total samples and by flow-sorted bacterioplankton cells at the end of the pulse. To the remaining samples,o0.01 nmol l1of32P-phosphate tracer (carrier free,
Hartmann Analytic) was added simultaneously with 0 nmol l1(control), 80 and 800 nmol l1of unlabelled phosphate in separate experiments to chase the pulse of the33P-phosphate tracer. Samples were incubated for further 2 h before being fixed
with 1% (w/v) PFA to determine the uptake of33P and32P tracers in total samples and by flow-sorted bacterioplankton cells. The radioactivities of the two tracers were de-convoluted based on the differences in their energy spectra.
Bacterioplankton cells were flow sorted from SYBR Green I DNA-stained samples. Tracer uptake byProchlorococcus, SAR11 and mean of total bacterioplankton cells were determined (Figs 1,3). At least four proportional numbers of cells were sorted to determine the mean cellular content of tracers. Sorted cells were collected onto 0.2mm pore size polycarbonate filters2,7.
Microbial uptake rates of bioavailable phosphate and Avogadro’s constant were used to convert relative cellular rates of phosphate uptake into absolute rates in units of phosphate atoms taken by an average cell of the flow-sorted population (PO43molecules per cell per hour). The size of cellular phosphate buffer (PiB) (PO43molecules per cell) was estimated using measurements of33P and32P uptake into flow-sorted cells as follows:
PiB¼33Pcl1 h33Pcl3 h33Pcl1 h
32
Pcl2 h
33
Pttl1 h
33
Padd
AvCðCnPaddþCnPambÞ
where33Pcl
1 his the cellular33P uptake at the end of the 1-h pulse with 0.8 nmol phosphate per l (CnPadd),33Pcl
3 his the cellular33P uptake at the end of the 1-h pulse with 0.8 nmol phosphate per l (CnPadd) added to the ambient bioavailable phosphate concentration (CnPamb) followed by 2-h chase with 80 nmol phosphate per l,32Pcl
2 his the cellular32P uptake at the end of the 2-h chase with 80 nmol phosphate per l,33Pttl1 his the total microbial33P uptake per ml at the end of the
1-h pulse with 0.8 nmol phosphate per l and33Padd is the total amount of added
33P tracer per ml.
Modelling phosphate extracellular buffering.As a quick overview, the model tracks the uptake of radioisotope and stable phosphate tracers explicitly and separately. Phosphate is taken into the buffer from ambient water at a rate proportional to the concentration of phosphate in ambient water. The uptake rate is scaled by the degree to which the buffer is full. As the simplest option, this scaling is taken to decrease linearly with increasing phosphate in buffer until it and the uptake rate are zero at the designated maximum capacity. Once again for simplicity, it is assumed that the cell has a constant demand for phosphate and that there is a constant loss of phosphate from the cell. There is assumed to be no distinction between phosphate involving31P,32P and33P in any process
(Supplementary Figs 3a–b,7). Furthermore, it is assumed that the number of cells remains constant over the 3 h of the ‘experiment’.
The equations for the model are:
dIh=dt¼dBh=ðBhþBcÞ fIh=ðIhþIcÞ dIc=dt¼dBc=ðBhþBcÞ fIc=ðIhþIcÞ dBh=dt¼cPhfdBh=ðBhþBcÞ dBc=dt¼cPcfdBc=ðBhþBcÞ dPh=dt¼ NcPhF
dPc=dt¼ NcPcf
whereIis phosphate internal to the cell,Bis phosphate in the buffer,Pis dissolved phosphate in the ambient water, h denotes ‘hot’ phosphate (that is, involving32P or33P), c denotes ‘cold’ phosphate (that is, involving31P),Nis the number of cells
in 1 m3andF¼1(B
hþBc)/Bmaxis a function representing the extent to which the buffer is full. The units of the model are molecules of phosphate and hours, and the model represents 1 m3of water.Bmax,c,dandfare constants taking the same values for all experiments at both sites.Bmaxrepresents the maximum number of molecules of phosphate that can be accommodated in the buffer of one cell,c(unit, per hour) is the maximum specific rate of uptake of phosphate from ambient waters into the buffer,d(unit, molecules per hour) controls the rate at which phosphate is taken from the buffer into the cell andf(unit, molecules per hour) is the rate at which phosphate is lost from the cell. The initial conditions for the model, including the number of cells, are taken from the experiments and the model is run for the same 3-hour period, with ‘hot’ and ‘cold’ tracers being added in quantities and at times once more matching the observations. There are seven parameters in the model. Their role is described in Supplementary Table 1. The model was solved using ode15s in Matlab.
The model is merely intended as a demonstration that the simple assumptions described above are qualitatively consistent with the observations; in particular, that the presence of a buffer allows the model to capture the relative changes in uptake rates seen in the observations. However, many of the parameters are poorly known, if at all. Therefore, to reduce the time involved in searching through parameter values one by one, we use the microgenetic algorithm27for fitting the
model to the data. The imposed parameter ranges are shown in Supplementary Table 1. In the absence of direct data the rates are chosen to cover a broad range. Data are available for ambient concentrations but once again a broad range encompassing the observations to ensure against uncertainties associated with measuring such low concentrations. If the optimizer had resulted in parameter values at the limits of the range, the ranges would have been expanded and the optimizer re-run. This did not prove necessary. Note that we do not use the optimization to claim the results presented are the best fit to the data. The optimization method is purely used to save time exploring whether there is a solution of the model, which resembles the observations. Without the presence of the buffer, the optimizer was unable to find such a solution despite several independent runs of the optimizer.
References
1. Tyrrell, T. The relative influences of nitrogen and phosphorus on oceanic primary production.Nature400,525–531 (1999).
2. Zubkov, M. V.et al.Microbial control of phosphate in the nutrient-depleted North Atlantic subtropical gyre.Environ. Microbiol.9,2079–2089 (2007). 3. Michelou, V. K., Lomas, M. W. & Kirchman, D. L. Phosphate and
adenosine-50-triphosphate uptake by cyanobacteria and heterotrophic bacteria in the Sargasso Sea.Limnol. Oceanogr.56,323–332 (2011).
4. Bjorkman, K., Thomson-Bulldis, A. L. & Karl, D. M. Phosphorus dynamics in the North Pacific subtropical gyre.Aquat. Microb. Ecol.22,185–198 (2000). 5. Wu, J. F., Sunda, W., Boyle, E. A. & Karl, D. M. Phosphate depletion in the
western North Atlantic Ocean.Science289,759–762 (2000).
6. Mather, R. L.et al.Phosphorus cycling in the North and South Atlantic Ocean subtropical gyres.Nat. Geosci.1,439–443 (2008).
7. Gomez-Pereira, P. R.et al.Comparable light stimulation of organic nutrient uptake by SAR11 andProchlorococcusin the North Atlantic subtropical gyre.
ISME J.7,603–614 (2013).
8. Morris, R. M.et al.SAR11 clade dominates ocean surface bacterioplankton communities.Nature420,806–810 (2002).
9. Chisholm, S. W.et al.A novel free-living prochlorophyte abundant in the oceanic euphotic zone.Nature334,340–343 (1988).
10. Heywood, J. L., Zubkov, M. V., Tarran, G. A. & Holligan, P. M. Inter-annual stability of prokaryoplankton standing stocks in oligotrophic gyre and equatorial provinces of the Atlantic Ocean.Deep-Sea Res. II53,1530–1547 (2006).
11. Hill, P. G., Mary, I., Purdie, D. A. & Zubkov, M. V. Similarity in microbial amino acid uptake in surface waters of the North and South Atlantic (sub-)tropical gyres.Prog. Oceanogr.91,437–446 (2011).
12. Hartmann, M.et al.Efficient CO2fixation by surfaceProchlorococcusin the Atlantic Ocean.ISME J.8,2280–2289 (2014).
13. West, N. J.et al.Closely relatedProchlorococcusgenotypes show remarkably different depth distributions in two oceanic regions as revealed by in situ hybridization using 16S rRNA-targeted oligonucleotides.Microbiology147, 1731–1744 (2001).
14. Wright, R. T. & Hobbie, J. E. Use of glucose and acetate by bacteria and algae in aqautic ecosystems.Ecology47,447–464 (1966).
15. Giovannoni, S. J.et al.Genome streamlining in a cosmopolitan oceanic bacterium.Science309,1242–1245 (2005).
16. Rocap, G.et al.Genome divergence in twoProchlorococcusecotypes reflects oceanic niche differentiation.Nature424,1042–1047 (2003).
17. Zubkov, M. V. Faster growth of the major prokaryotic versus eukaryotic CO2 fixers in the oligotrophic ocean.Nat. Commun.5,3776 (2014).
18. Redfield, A. C., Ketchum, B. H. & Richards, F. A. inThe Sea(ed. Hill, M. N.) 26–77 (John Wiley & Sons, 1963).
19. Sanudo-Wilhelmy, S. A.et al.The impact of surface-adsorbed
phosphorus on phytoplankton Redfield stoichiometry.Nature432,897–901 (2004).
20. Heldal, M., Scanlan, D. J., Norland, S., Thingstad, F. & Mann, N. H. Elemental composition of single cells of various strains of marineProchlorococcusand
Synechococcususing X-ray microanalysis.Limnol. Oceanogr.48,1732–1743 (2003).
21. Krumhardt, K. M.et al.Effects of phosphorus starvation versus limitation on the marine cyanobacteriumProchlorococcusMED4 I: uptake physiology.
Environ. Microbiol.15,2114–2128 (2013).
22. Zubkov, M. V. & Tarran, G. A. High bacterivory by the smallest phytoplankton in the North Atlantic Ocean.Nature455,224–226 (2008).
23. Larsen, A., Tanaka, T., Zubkov, M. V. & Thingstad, T. F. P-affinity measurements of specific osmotroph populations using cell-sorting flow cytometry.Limnol. Oceanogr. Methods6,355–363 (2008).
24. Thingstad, T. F.et al.Nature of phosphorus limitation in the ultraoligotrophic eastern Mediterranean.Science309,1068–1071 (2005).
25. Talarmin, A.et al.Improved methodology to measure taxon-specific phosphate uptake in live and unfiltered samples.Limnol. Oceanogr. Methods9,443–453 (2011).
26. Marie, D., Partensky, F., Jacquet, S. & Vaulot, D. Enumeration and cell cycle analysis of natural populations of marine picoplankton by flow cytometry using the nucleic acid stain SYBR Green I.Appl. Environ. Microbiol.63,186–193 (1997).
27. Ward, B. A., Friedrichs, M. A. M., Anderson, T. R. & Oschlies, A. Parameter optimisation techniques and the problem of underdetermination in marine biogeochemical models.J. Mar. Syst.81,34–43 (2010).
Acknowledgements
We gratefully acknowledge Andy Rees and Glen Tarran (the chief scientists), fellow scientists, technicians, captain, officers and crew aboard the Royal Research Ship James Cook for their support during the cruises. We thank Michael Sleigh for his critical comments on earlier drafts of the paper. This study was supported by the UK Natural Environment Research Council (NERC) through the core funding of the National Oceanography Centre as well as through Research Grant NE/H005196/1. This is Atlantic Meridional Transect publication number 273.
Author contributions
M.V.Z. conceived the project, designed the experiments, performed experiments on both cruises, analysed and interpreted the data and co-wrote the manuscript; A.P.M. constructed the mathematical model, interpreted the results and co-wrote the manuscript; M.H. performed experiments on the AMT-20, interpreted the data and co-wrote the manuscript; C.G. performed flow cytometrical cell sorting on the AMT-20 and co-wrote the manuscript; D.J.S. co-wrote the manuscript.
Additional information
Supplementary Informationaccompanies this paper at http://www.nature.com/ naturecommunications
Reprints and permissioninformation is available online at http://npg.nature.com/ reprintsandpermissions/
How to cite this article:Zubkov, M. V.et al.Dominant oceanic bacteria secure phosphate using a large extracellular buffer.Nat. Commun.6:7878 doi: 10.1038/ncomms8878 (2015).
This work is licensed under a Creative Commons Attribution 4.0 International License. The images or other third party material in this article are included in the article’s Creative Commons license, unless indicated otherwise in the credit line; if the material is not included under the Creative Commons license, users will need to obtain permission from the license holder to reproduce the material. To view a copy of this license, visit http://creativecommons.org/licenses/by/4.0/