University of Warwick institutional repository:
http://go.warwick.ac.uk/wrap
A Thesis Submitted for the Degree of PhD at the University of Warwick
http://go.warwick.ac.uk/wrap/77199
This thesis is made available online and is protected by original copyright.
Please scroll down to view the document itself.
Development of two
in vitro
methodologies for the
study of brain network dynamics and an application
to the study of seizure-evoked adenosine release
by
Matthew George Thomas
Thesis
Submitted to the University of Warwick
for the degree of
Doctor of Philosophy
MOAC Doctoral Training Centre
Contents
List of Figures iv
Acknowledgments xi
Declarations xii
Abstract xiv
Abbreviations xv
Chapter 1 Introduction 1
1.1 Brain anatomy and physiology . . . 2
1.2 The role of adenosine . . . 9
1.3 Methods for recording neuronal activity . . . 12
1.4 Preparations used for the study of the nervous system . . . 16
1.5 Seizures . . . 19
1.6 Epilepsy . . . 20
1.7 Models of epilepsy . . . 22
1.8 Thesis outline . . . 22
Chapter 2 A chamber for the perfusion of in vitro tissue with multi-ple solutions 35 2.1 Abstract . . . 37
2.2 Introduction . . . 37
2.3 Materials and methods . . . 39
2.5 Discussion . . . 57
2.6 Acknowledgements . . . 58
2.7 Grants . . . 58
2.8 Disclosures . . . 58
Chapter 3 High-resolution recording of neural activity by transforming Intrinsic Optical Signals 62 Chapter 4 Characterisation of the spatio-temporal dynamics of the extracellular concentration of adenosine in the neocortex in re-sponse to electrographic seizure activity 64 4.1 Abstract . . . 65
4.2 Introduction . . . 65
4.3 Materials and Methods . . . 69
4.4 Results . . . 73
4.5 Discussion . . . 88
4.6 Acknowledgements . . . 93
Chapter 5 Conclusions 98 Appendix A FAIMS analysis introduction 101 A.1 Ion mobility spectrometry . . . 101
A.2 Principles of FAIMS . . . 102
A.3 Clinical potential for FAIMS . . . 104
A.4 The challenge of identifying clinically relevant information in FAIMS spectra of complex biological mixtures . . . 105
A.5 Analysis approach . . . 106
A.6 Testing of analysis process . . . 111
A.7 Pilot studies . . . 112
Appendix B Evaluation of gut bacterial populations using an
elec-tronic e-nose and field asymmetric ion mobility spectrometry:
Appendix C A novel tool for noninvasive diagnosis and tracking of
patients with inflammatory bowel disease 116
Appendix D The detection of patients at risk of gastrointestinal
tox-icity during pelvic radiotherapy by electronic nose and FAIMS: A
pilot study 117
Appendix E Detection of colorectal cancer (CRC) by urinary volatile
List of Figures
1.1 The structure of a typical neuron showing branching processes. From Briar et al. (2003). The figure has been redacted from this version to avoid copyright infringement. . . 2 1.2 The membrane potential of a typical neuron during an action
po-tential. From Bean (2007). The figure has been redacted from this version to avoid copyright infringement. . . 3 1.3 The structure of a typical chemical synapse showing both presynaptic
and postsynaptic neurons and an astrocyte. From Briar et al. (2003). The figure has been redacted from this version to avoid copyright infringement. . . 4 1.4 Golgi stained cortex of a human infant, showing the typical layered
structure. From Cajal (1899). The figure has been redacted from this version to avoid copyright infringement. . . 5 1.5 The cannonical connectivity of the principal cells of the neocortex.
From Harris and Mrsic-Flogel (2013). The figure has been redacted from this version to avoid copyright infringement. . . 6 1.6 The hippocampal circuit, showing the well characterised pathways.
From Daumas et al. (2009). The figure has been redacted from this version to avoid copyright infringement. . . 7 1.7 The cerebellar circuit, showing the location of Purkinje cells that fire
spontaneously in acute slice preparations. From Apps and Garwicz (2005). The figure has been redacted from this version to avoid copy-right infringement. . . 8 1.8 The molecular structure of adenosine. From Ralevic and Burnstock
(1998). The figure has been redacted from this version to avoid copy-right infringement. . . 9 1.9 The structure of the A1 receptor showing seven transmembrane
do-mains, thought to be composed ofα-helices. From Ralevic and Burn-stock (1998). The figure has been redacted from this version to avoid copyright infringement. . . 11 1.10 Possible mechanisms for activity-dependent adenosine release. (1)
1.11 Pathways of adenosine production, metabolism and transport, with indications of the sites of action of various enzyme inhibitors. ADA: Adenosine deaminase; AK: Adenosine kinase; AOPCP:α, β-methylene
ADP; DCF: deoxycoformycin; EHNA: erythro-9-(2-hydroxy-3-nonyl)adenosine; es: sensitive nucleoside transporters; ei:
equilibrative-insensitive nucleoside transporters; 5-IT: 5-iodotubercidin; NBMPR: nitrobenzyl-thioiniosine; PDE: cAMP phosphodiesterase; SAH: S-adenosyl homocysteine. From Latini and Pedata (2001). The figure has been redacted from this version to avoid copyright infringement. 13 1.12 The local field potential recorded during a typical burst of
electro-graphic seizure activity in the Mg2+ free seizure model in acute neo-cortical slice. . . 20
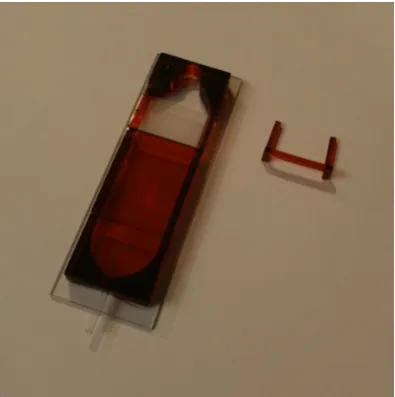
2.1 The chamber produced for Prof. Frenguelli, University of Warwick. For scale, the chamber is mounted on a standard 26×75 mm micro-scope slide. . . 36 2.2 (A) A rendered CAD model of the chamber showing the bath region
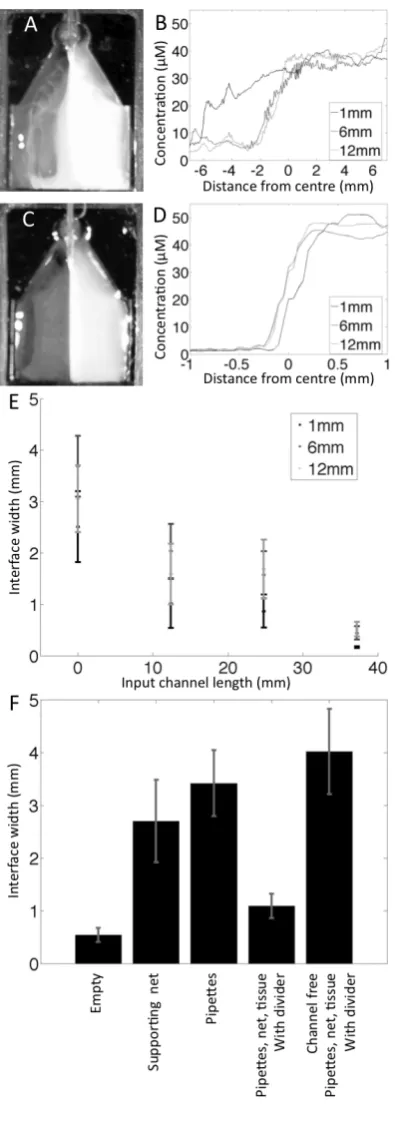
with mesh tissue support and slice hold down with dividers. (B) Cross section showing dividers on tissue support and hold down rel-ative to tissue slice. (C) An image of the bath region of a chamber built to target the entorhinal cortex region of a cortical slice with a different solution to the rest of the cortex and hippocampus. Two mi-croelectrodes (filled with a 2 mM solution of Brilliant blue R, to allow visualisation), a cortical slice, bath earth and hypodermic needle (for outflow) are shown. . . 40 2.3 Dye characterisation of solution interface width. (A) Image of bath
2.4 Dye characterisation of solution change. (A) Sequence of images dur-ing the change from water to a fluorescent solution taken at the in-dicated times. On the left are images of the bath region of the novel chamber, showing a uniform increase in fluorescence intensity, free from turbulence. On the right are images of a commercial tissue bath (detailed in the text) showing mixing of the two solutions with a stag-nant region of water persisting, unmixed with fluorescent solution. (B) Concentration profile during change from water to fluorescent dye for the region occupied by a tissue slice in the novel chamber. (C) Comparison of times for change from 5% to 95% of the maxi-mum fluorescein concentration for both the novel chamber and the commercially available bath. The contents of the bath and the depth of solution is indicated for each case. Mean of n = 3, bars show the standard error. . . 51 2.5 Results of tests for contamination of slices in the chamber from
com-ponents of the R11 resin used for its manufacture. (A) Top: Result of gas chromatography of a control solution of less than 100 ppm of the water soluble components of R11 resin monomer, cross-linker and associated solvents. Bottom: Result of gas chromatography of water after being passed through the chamber at 30 - 31 oC, showing no detectable contamination with any components of R11 resin. (B) Ex-ample recordings from hippocampal slices using a paired pulse stimu-lation protocol (50 ms interval) illustrating the viability of slices after an extended period in the novel chamber. Top: Example fEPSPs from a slice maintained in the novel chamber for 3.5 hours. Bottom: Ex-ample fEPSPs from a slice maintained in a Gibbs chamber for 3 hours before being transferred to the novel chamber for a 30 minute recov-ery period before stimulation. (C) Comparison of the initial slope of the first fEPSP evoked in slices maintained in the novel chamber and in a Gibbs chamber, showing no significant difference. Mean of n = 6, bars show the standard error. (D) Comparison of the paired pulse facilitation ratio from the initial slope of the fEPSPs evoked in slices maintained in the novel chamber and in a Gibbs chamber, showing no significant difference. Mean of n = 6, bars show the standard er-ror. Recordings were made from interleaved slices either maintained in the bath or in a Gibbs chamber and fEPSPs were evoked with the same stimulus strength. . . 53 2.6 Example of an individual cerebellar slice recording demonstrating the
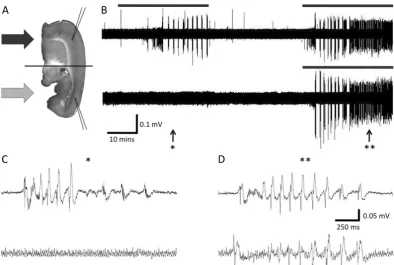
2.7 Example recording of induced epileptiform activity, demonstrating the effectiveness of the chamber both with respect to targeted perfu-sion and the maintenance of tissue viability. (A) Schematic of corti-cal slice showing microelectrode placement relative to the interface. Arrows indicate perfusion with distinct solutions. (B) Extracellular voltage recording on a compressed time base. Microelectrode place-ment as in (A). Application of excitant solution is indicated by grey bars. Initially excitant was applied to one side, which became active, while the other side remained quiescent. Application of excitant to both sides induced activity on both sides. (C) Expanded portion of panel (B) from (*) showing a burst of epileptiform activity on one side of the slice while the other side remained quiescent. (D) Expanded portion of panel (B) from (**) showing a burst of population spikes on both sides of the tissue. The synchronicity of the burst, and the population spikes with in it, demonstrates the viability of the centre of the tissue between the dividers, which connects them. . . 56
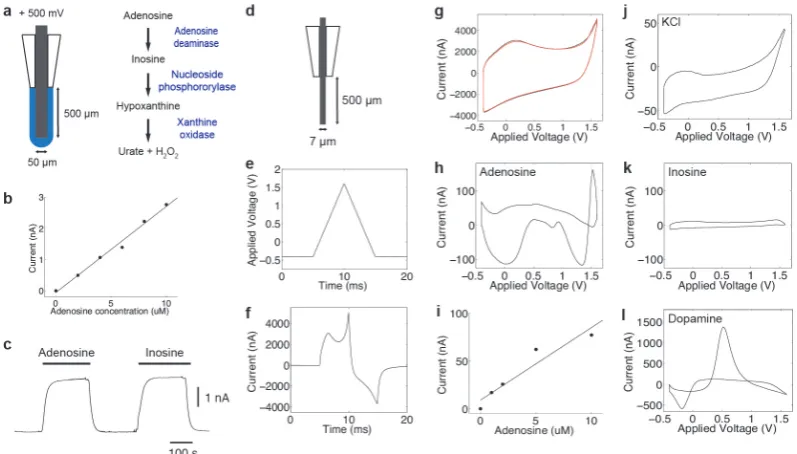
4.1 Methods for the measurement of adenosine: Fixed Potential Am-perometry (FPA) and Fast Scan Cyclic Voltammetry (FSCV). (a) Schematic of FPA biosensor. (b) Example calibration of an FPA biosensor. (c) Example response of an FPA biosensor to 10 µM adenosine and 10 µM inosine, showing the cross sensitvity of the biosensors. (d) Schematic of a carbon fibre microelectrode (CFME) used for FSCV. (e) Applied voltage waveform. (f) Example current measured in response to application of voltage shown in (e). (g) Voltammagrams of aCSF (black) and aCSF and 10 µM adenosine (red). (h) Background subtracted voltammagram of 10 µM adeno-sine. (i) Example calibration of FSCV to adenoadeno-sine. (j-l) Example cross sensitivities of FSCV: subtracted voltammagrams of potassium chloride (j), inosine (k) and dopamine (l). . . 72 4.2 Recovery of an LFP like time-series from the IOS recorded. (a) train
of fEPSPs (20 at 10 Hz) (b) population spikes (c) electrographic seizure activity and (d) spreading depression. For all types of activ-ity, the top row shows the change in reflected intensity. The second row shows the associated LFP. The third row shows the result of the transformation to the tIOS. The tIOS accurately reflects the dynam-ics of the LFP, with the exception of spreading depression, which produces a characteristic tIOS waveform. . . 73 4.3 Separation of spatial components. (a) Example micrograph of a tissue
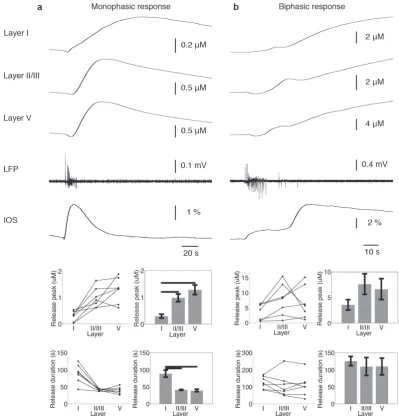
slice with superimposed grid reflecting the organisation of the tissue. A cartesian coordinate system (x-y-z) and a natural coordinate sys-tem (l-d-w) are indicated. (b) A schematic of the tissue slice shown in (a) transformed on to a rectilinear grid. (c) Projection of tissue slice, normal to that shown in (b). . . 74 4.4 Layer dependence of monophasic (a) and bisphasic (b) purine release
4.5 Validation of numerical PDE solution scheme. (a) Schematic of test geometry. (b) Analytic solution of diffusion equation at the four loca-tions shown in (a). (c) Comparison of numeric and analytic soluloca-tions at the four regions shown in (a) showing good agreement between the two solutions. . . 78 4.6 Model of release as a function of depth into neocortex. (a) Schematic
of system, indicating a non-releasing layer I. (b) Time courses of purine concentration for location 1 (blue) and 2 (black) in (a). (c) Relative peak in purine concentration as a function of depth into the neocortex for a releasing layer I. (d) Lag to peak in purine concen-tration as a function of depth in the neocortex for a releasing layer I. (e) Relative peak in purine concentration plotted against the lag to the maximum for a range of depths of layer I, all points along the line equidistant from both cut surfaces are shown (colours), and experimental results and linear fit (black). Relative peak in purine concentration plotted against the lag to the maximum for a 300µm layer I. A number of durations of release are shown at a number of distances from the pial surface. (g) Relative peak in purine concen-tration as a function of depth into the neocortex for a 300µm layer I. (h) Lag to peak in purine concentration as a function of depth in the neocortex for a 300µm layer I. . . 79 4.7 Measurement of purine release in response to electrographic seizure
activity and correction for loss through diffusion. (a) Illustration of biosensor placement relative to active region (red) and the boundaries of the tissue slice. (b) Schematic, normal to (a), of biosensor place-ment. The releasing region is indicated in red, with loss of purine from the slice indicated by the arrows. (c) Example LFP recording showing electrographic seizure activity. (d) FPA recording associated with the LFP recording shown in (c). (e) Purine release associated with (c) recovered from (d). (f) and (g) Recovered purine release (black) and model of release driven by LFP (red). The measured purine release is significantly delayed relative to the model. . . 83 4.8 Purine release is local to region of electrographic seizure activity. (a)
Left: Micrograph of tissue slice indicating location of LFP microelec-trode and FPA biosensor, the scale bar corresponds to 700µm. Right: False colour map showing spatial spread of activity across the slice as a function of time with the associated LFP recording (bottom) and biosensor measurement (top). (b) Left: micrograph of tissue slice in-dicating the location of three FPA biosensors. Right: tIOS for regions of interest across the tissue slice (black) and biosensor measurements (red). . . 85 4.9 Modelling of the spatial spread of purine by diffusion in a tissue slice.
4.10 Comparison of simultaneous FPA and FSCV measurements. (a) Si-multaneous FPA and FSCV measurements during a period of bursts of electrographic seizure activity. The black bar inidcates the applica-tion of EHNA. (b) Overlay of adenosine transients from FSCV from control period (black) and with EHNA (red) showing an increase in transient width with application of EHNA. (c) Plot of normalised transients measured with FPA (blue) and FSCV (green) with a stock release model (Eq. 4.12, red). . . 87 4.11 Layer dependence of adenosine release measured with FSCV. (a)
Adenosine transients in response to electrographic seizure activity in layer I (blue) and layer II/III (black). (b) Comparison of release peaks (left) and the full width at half maximum of adenosine tran-sients in layers I and II/III. (c) Effect of treatment with EHNA and ENT inhibitors on adenosine transients in layer I. (d) Effect of treat-ment with EHNA and ENT inhibitors on adenosine transients in layer II/III. . . 89
A.1 Schematic of a FAIMS system. From Owlstone Inc., Cambridge. The figure has been redacted from this version to avoid copyright infringe-ment. . . 103 A.2 An example positive ion FAIMS spectrum of air contaminated with a
single dopant (acetone). The residual ion peak (RIP) corresponds to hydronium ions (O−in the case of the negative ion matrix) produced from the beta decay of 63Ni, to ionise the analytes. . . 104 A.3 The Owlstone Lonestar, a self contained FAIMS system. From
Owl-stone Inc., Cambridge. The figure has been redacted from this version to avoid copyright infringement. . . 105 A.4 An example positive ion FAIMS spectrum of air (top left) showing the
residual ion peak (RIP) and an example cross-section at constant dis-persion field (top right) and an example positive ion FAIMS spectrum of air contaminated with a single dopant (acetone, bottom left) and an example cross-section at constant dispersion field (bottom right). 107 A.5 An example positive ion FAIMS spectrum of the headspace of urine
from a healthy individual (top left) and an example cross-section at constant dispersion field (top right) and an example positive ion FAIMS spectrum of the headspace of urine from an individual with colorectal cancer (bottom left) and an example cross-section at con-stant dispersion field (bottom right). . . 108 A.6 (A) An example cross section through a FAIMS peak at constant
A.7 Comparison of reclassification success for the original data sets and for the data relabelled to give two equivalent groups. (A) Result of the application of the analysis process to the original data as a func-tion of the input parameters, showing a robust region where successful reclassification significantly exceeded that expected from random re-classification. (B) Result of the application of the analysis process, as a function of the input parameters, to the data relabelled such that each new group contained half of each of the original members of each group (no spectrum was duplicated in each new group), showing sig-nificantly fewer correct reclassifications than that from reclassification of the correctly labelled data. . . 112 A.8 The wavelet transform step increases accurate reclassification. (A)
Acknowledgments
Declarations
The work presented in this thesis is entirely original and my own work, except where acknowledged in the text or figure legends. I confirm that this thesis has not been submitted for a degree at any other University.
Chapter 2 was published as:
Thomas, M.G.; Covington, J.A.; Wall, M.J.
A chamber for the perfusion ofin vitro tissue with multiple solutions. Journal of Neurophysiology 110:269-277, 2013
Chapter 3 is in review for:
Thomas, M.G.; Covington, J.A.; Richardson, M.J.E.; Turner, M.S.; Wall, M.J. High-resolution recording of neural activity by transforming intrinsic optical signals.
Chapter 4 is in preparation for:
Thomas, M.G.; Richardson, M.J.E.; Wall, M.J.
Characterisation of the spatio-temporal dynamics of the extracellular concentration of adenosine in the neocortex in response to electrographic seizure activity.
Appendix B was published as:
Arasaradnam, R.P.; Ouaret, N.;Thomas, M.G.; Gold, P.; Quraishi, M.N.; Nwokolo, C.U.; Bardhan, K.D.; Covington, J.A.
Evaluation of gut bacterial populations using an electronic e-nose and field asym-metric ion mobility spectrometry: further insights into ’fermentonomics’.
Journal of Medical Engineering & Technology 36:333-337, 2012
A novel tool for noninvasive diagnosis and tracking of patients with inflammatory bowel disease.
Arasaradnam, R.P.; Ouaret, N.;Thomas, M.G.; Quraishi, M.N.; Heatherington, E.; Nwokolo, C.U.; Bardhan, K.D.; Covington, J.A.
Inflammatory Bowel Diseases 19:999-1003, 2013
Appendix D was published as:
The detection of patients at risk of gastrointestinal toxicity during pelvic radiother-apy by electronic nose and FAIMS: A pilot study.
Covington, J.A.; Wedlake, L.; Andreyev, J.; Ouaret, N.;Thomas, M.G.; Nwokolo, C.U.; Bardhan, K.D.; Arasaradnam, R.P.
Sensors 12:13002-13018, 2012
Appendix E was published as:
Detection of colorectal cancer (CRC) by urinary volatile organic compound analysis. Arasaradnam, R.P.; McFarlane, M.J.; Ryan-Fisher, C.; Westenbrink, E.; Hodges, P.;
Thomas, M.G.; Chambers, S.; O’Connel, N.; Bailey, C.; Harmston, C.; Nwokolo, C.U.; Bardhan, K.D.; Covington, J.A.
Abstract
Abbreviations
5-HT 5-Hydroxytryptamine
8-CPT 8-Cyclopentyl-1,3-dimethylxanthine
aCSF artificial Cerebrospinal Fluid
ADA Adenosine Deaminase
ADK Adenosine Kinase
ADP Adenosine Diphosphate
AMP Adenosine Monophosphate
ATP Adenosine Triphosphate
BBSRC Biotechnology and Biological Sciences Research Council
BOLD Blood Oxygen Level Dependent
CA Cornu Ammonis
cAMP cyclic Adenosine Monophosphate
CAD Computer Aided Design
CC Corticocortical Cell
CED Cambridge Electronic Design
CFME Carbon Fibre Micro Electrode
CT Corticothalamic Cell
DG Dentate Gyrus
ECoG Electrocorticogram
EEG Electroencephalogram
EHNA Erythro-9-(2-hydroxy-3-nonyl)adenine
EGTA Ethylene Glycol Tetraacetic Acid
ENT Equilibritive Nucleoside Transporter
EPSP Excitatory Post Synaptic Potential
EPSRC Engineering and Physical Sciences Research Council
FAIMS Field Asymmetric Ion Mobility Spectrometry
fEPSP field Excitatory Post Synaptic Potential
fMRI functional Magnetic Resonance Imaging
FPA Fixed Potential Amperometry
FPS Frames Per Second
FSCV Fast Scan Cyclic Voltammetry
FWHM Full Width at Half Maximum
GABA Gamma Aminobutyric Acid
GPCR G-Protein Coupled Receptor
GCMS Gas Chromatography Mass Spectrometry
HEPES 4-(2-hydroxyethyl)-1-piperazineethanesulfonic Acid
IOS Intrinsic Optical Signal
ITN Intratelencephalic Neuron
LED Light Emitting Diode
LFP Local Field Potential
MOAC Molecular Organisation and Assembly in Cells
MRI Magnetic Resonance Imaging
MSL Microstereolithography
NBMPR 6-S-(4-Nitrobenzyl)-6-thioinosine
NMDA N-methyl-D-aspartate
PC Pyramidal Cell
RMSD Root Mean Square Deviation
RC Recurrent Collateral
ROI Region of Interest
SPME Solid Phase Micro Extraction
SPN Subcerebral Projection Neurons
tIOS transformed Intrinsic Optical Signal
TTL Transistor Transistor Logic
Chapter 1
Introduction
Epilepsy is a disorder of the nervous system that is characterised by paroxysmal episodes of abnormal brain activity. In this thesis two techniques for the study of brain function in health and disease, both particularly suited to the study of epilepsy, will be presented. The first is a fluidic device that allows an extended region of a tissue slice to be exposed, in isolation, to changes in environment while preserving the ability to record from the slice. This readily provides a model of focal epilepsy - by exposing a region of tissue to a pro-convulsant while maintaining the remainder of the slice in a physiological medium. The second method transforms the slow temporal dynamics of the intrinsic optical signal (IOS) associated with neuronal activity in vitro to a form that accurately mimics the more fundamental dynamics of the local field potential (LFP). This transformation overcomes the pri-mary disadvantage of the use of the IOS as a proxy for recording neuronal activity, allowing the many advantages to be fully exploited. The result is a technique for recording the spatio-temporal dynamics of neuronal activity particularly well suited to the study of the propagation of focal seizure activity. Finally, the transformation of the IOS is applied to the study of the spatiotemporal dynamics of adenosine, a po-tent neuromodulator implicated in a number of physiological and pathophysiological processes, and that plays a particularly important role in epilepsy.
Figure 1.1: The structure of a typical neuron showing branching processes. From Briar et al. (2003). The figure has been redacted from this version to avoid copyright infringement.
disease processes will be discussed.
1.1
Brain anatomy and physiology
The brain processes sensory input, stores information and coordinates responses. The current understanding of the cellular basis of these processes will be briefly summarised here, however, for a more thorough review see Kandel et al. (2013).
Cellular composition
Figure 1.2: The membrane potential of a typical neuron during an action potential. From Bean (2007). The figure has been redacted from this version to avoid copyright infringement.
Figure 1.3: The structure of a typical chemical synapse showing both presynaptic and postsynaptic neurons and an astrocyte. From Briar et al. (2003). The figure has been redacted from this version to avoid copyright infringement.
There are three known forms of coupling between neurons, chemical synapses, gap junctions and ephaptic coupling. Chemical synapses are junctions between the terminal boutons of neurons and their target cells. When an action potential reaches the terminal the depolarisation causes the opening of voltage gated Ca2+ channels. As a result, Ca2+ ions enter the terminal and cause vesicles of neurotransmitter to stochastically (Ribrault et al., 2011) fuse with the membrane and release their con-tents in to the synaptic cleft (Fig. 1.3). The neurotransmitter then diffuses across the cleft and binds to receptors on the post-synaptic cell and, potentially, on the pre-synaptic cell and adjacent astrocytes, effecting some change, for a review see Lisman et al. (2007). Most simply, the binding of neurotransmitter to ligand gated ion channels causes them to open channels, ions then move across the membrane of the post-synaptic cell, causing a change in membrane potential. If the combination of synaptic inputs to the post-synaptic neuron causes its membrane to depolarise above its threshold, an action potential will occur. The released transmitter is then removed by astrocytes, cells that surround synapses (for reviews of astrocytic func-tions see Haydon (2001); Volterra and Meldolesi (2005); Clarke and Barres (2013)). Modulation of synaptic strength is implicated in learning and memory, for reviews see Lamprecht and LeDoux (2004) and Sohl et al. (2005).
Figure 1.4: Golgi stained cortex of a human infant, showing the typical layered structure. From Cajal (1899). The figure has been redacted from this version to avoid copyright infringement.
These are groups of channels that directly connect the cytoplasm of two neurons. Ions can move through the channels and so when the potentials of the connected regions of the two cells are unequal, ions move so as reduce the difference in potential. If, for example, an action potential occurs in one cell, a transient depolarisation occurs in cells to which it is gap junction coupled. For a review see Pereda (2014).
The final way in which neurons are known to couple is by direct field effects, known as ephaptic coupling (Anastassiou et al., 2011). Neurons are electrochemical systems, their dynamics give rise to time varying electric fields, these fields then affect other cells. These effects, although relatively small, are sufficient to entrain the firing of action potentials in adjacent cells (Anastassiou et al., 2011).
Tissue structure
The brain is formed of a number of functionally and structurally distinct regions. The structure of the regions discussed in this thesis will be briefly summarised here, for a more complete discussion see Kandel et al. (2013).
The majority of the results presented in this thesis relate to the neocortex. The neocortex is the outer-most region of the cerebrum, it is responsible for many higher cognitive processes such as perception and the generation of motor com-mands. The neocortex is comprised of six layers (Fig. 1.4) that lie parallel to the pial surface.
Figure 1.5: The cannonical connectivity of the principal cells of the neocortex. From Harris and Mrsic-Flogel (2013). The figure has been redacted from this version to avoid copyright infringement.
is the deepest layer, and both receives input and provides output to the thalamus. The typical connectivity within the neocortex is an area of intense study, Fig. 1.5 shows a simplified summary, for a review see Harris and Mrsic-Flogel (2013).
Figure 1.8: The molecular structure of adenosine. From Ralevic and Burnstock (1998). The figure has been redacted from this version to avoid copyright infringement.
1.2
The role of adenosine
The final study in the core of this thesis presents a characterisation of the spatiotem-poral dynamics of extracellular adenosine concentration in response to electrographic seizure activity in the neocortex. A brief summary of the current understanding of the role of adenosine will be presented here, for more thorough reviews see Fredholm et al. (2001) and Ralevic and Burnstock (1998).
Adenosine is a purine nucleoside (Fig. 1.8), it is an important signalling molecule, implicated in both physiological and pathological processes. For example, adenosine plays an important role in the regulation of sleep (Huang et al., 2011; Blanco-Centurion et al., 2006; Bjorness and Greene, 2009; Schmitt et al., 2012; Sims et al., 2013), is a powerful vasodilator and an important neuroprotectant implicated in stroke, traumatic brain injury and epilepsy (Pasini et al., 2000; Dale et al., 2000; Frenguelli et al., 2003; Hunter et al., 2003; Pearson et al., 2006; Dale and Frenguelli, 2009; Ross et al., 2014; Winn et al., 1980; During and Spencer, 1992; Van Gompel et al., 2014).
Adenosine activates four types of G-protein coupled receptor: A1, A2A, A2B
and A3 (Ralevic and Burnstock, 1998; Fredholm et al., 2001), all composed of seven putative transmembrane domains (the structure of the A1 receptor is shown in Fig. 1.9). Activation of A1 and A3 receptors is largely inhibitory while that of A2 receptors is largely excitatory; A2Areceptors are found in the central nervous system
and A2B are found in the peripheral nervous system (Wall and Dale, 2008). The
et al., 1992).
A1 receptors are particularly abundant in the central nervous system. They are located both pre- and post-synaptically, on cell bodies and on axons. Activa-tion of A1 receptors has an inhibitory effect on neurotransmission by decreasing the probability of vesicle release and hyperpolarising neuronal membranes (Ralevic and Burnstock, 1998). Adenosine is released during hypoxia and ischemia. The resulting activation of A1 receptors reduces neuronal activity and, therefore, metabolic de-mand and as such is neuroprotective. A1 receptors are also expressed on the heart, activation of these receptors has negative chronotropic and inotropic effects, compli-cating the use of an A1 receptor agonist therapeutically to treat excessive neuronal activity such as occurs in epilepsy.
A2Areceptors are found in a restricted number of tissues including the central
nervous system, particularly the striatum, and vascular smooth muscle. In the cen-tral nervous system activation of A2A receptors largely facilitates neurotransmitter
release. However, striatal neurons express A2A receptors in close association with
dopamine D2 receptors, activation of these A2Areceptors reduces the affinity of the
D2 receptors for dopamine. This has raised the possibility of using A2A receptor
antagonists to treat Parkinsons.
A2B receptors are widely expressed at low levels, requiring relatively high
concentrations of adenosine for activation. They appear to be implicated in inflam-matory responses.
A3 receptors are also expressed widely and also appear to play a role in inflammatory responses. Activation of hippocampal A3 receptors has also been shown to desensitise A1 receptor mediated inhibition (Dunwiddie et al., 1997).
Figure 1.10: Possible mechanisms for activity-dependent adenosine release. (1) ATP released by exocytosis and subsequently dephosphorylated to adenosine in the extracellular space. (2) An intermediate signalling molecule is released by exocytosis and acts on another cell to cause adenosine release. (3) Direct exocytotic release of vesicular adenosine. Additionally, adenosine could be released through equilibritive nucleoside transporters. From Wall and Dale (2008). The figure has been redacted from this version to avoid copyright infringement.
Adenosine is removed either by phosphorylation to AMP by adenosine ki-nase (ADK) or deamination to inosine by adenosine deamiki-nase (ADA) (Latini and Pedata, 2001). Both ADK and ADA are primarily found intracellularly and act on adenosine once it has entered a cell via ENTs, however, there is also evidence of extracellular ADA (Latini and Pedata, 2001). A summary of some of the pathways of production, metabolism and transport of adenosine are shown in Fig. 1.11.
1.3
Methods for recording neuronal activity
To study network activity in the nervous system a technique is required to measure or infer neuronal activity. Many techniques have been developed, each striking a dif-ferent balance in the compromise between spatial and temporal resolution; recording duration; the area of the region of interest and the damage or ionic modification caused in the tissue. In this section a number of commonly used techniques will be briefly summarised, however, it should be noted that this is an intense area of research and so the technology available is developing rapidly.
measured directly, either from single neurons by patch clamp recording or by mea-suring the averaged contribution from a population of neurons, such as with local field potential (LFP), electrocorticogram (ECoG) or electroencephalogram (EEG) recording. Alternatively neuronal activity can be measured using voltage or calcium sensitive dyes, either loaded in to cells or expressed by the cells themselves. Finally, activity can be inferred from changes in the intrinsic optical properties of brain tissue at the network level, such as within vitro intrinsic optical signal (IOS) imag-ing, or by the effect of activity on the local perfusion, as with functional magnetic resonance imaging (fMRI) or typicalin vivo IOS imaging.
The intracellular voltage dynamics of single neurons can be recorded using patch clamp recording techniques (Sakmann and Neher, 1984), using either whole cell, cell attached (Perkins, 2006) or perforated patch (Linley, 2013) configurations. These approaches give high resolution recordings specific to the neurons under in-vestigation. However, the number of simultaneous recordings is limited, the highest number to date is twelve (Anastassiou et al., 2011), this does not give a representa-tive reflection of the activity of the ∼106 neurons in a slice of rat cortex.
representative. For a review of these recording modalities see Buzsaki et al. (2012). Single cell resolution can also be achieved using dye based techniques. The fluorescence characteristics of suitable dyes change in response to changes either in intracellular voltage or intracellular calcium concentration. These changes can then be used to infer neuronal activity. Dyes can either be loaded in to cells directly or the cells can be modified to express the dyes themselves. Dye based techniques allow single cell resolution recording from many more cells than is possible with patch clamp recording. However, dyes bleach with a half life∼800 s (Wenjun et al., 2002; Takagaki et al., 2008) and so the recording duration is severely limited. These approaches are, therefore, not suitable for the study of rare spontaneous events, such as seizure onset. For reviews of these techniques see Kerr and Denk (2008) and Knopfel (2012).
In addition to the BOLD and cytochrome oxidase dependent signals observed in vivo there is an additional intrinsic optical signal (IOS) that persists in vitro (Gouras, 1958; Aitken et al., 1999; Gurden et al., 2006). A number of mechanisms contribute to this signal. There is a fast change in light scattering that is neuronal in origin and closely tracks the dynamics of the underlying electrical activity (Cohen et al., 1968; Stepnoski et al., 1991; Rector et al., 1997, 2005). However, because of its small signal-to-noise ratio, averaging of many sweeps is required to detect this signal in tissue; it is therefore unsuitable for the study of spontaneous activity. The first response is followed by a slower, much larger, signal that results from a combi-nation of glutamate dependent neuronal and glial swelling, changes in cytoplasmic refractive index and possibly changes in the interactions between macromolecules and organelles (Lipton, 1973; Holthoff and Witte, 1996; Andrew et al., 1999; Buch-heim et al., 1999, 2005; Jarvis et al., 1999; Fayuk et al., 2002; Gurden et al., 2006; Kitaura et al., 2009). This signal can be readily measured, however, the temporal dynamics of the signal do not directly reflect the underlying network dynamics. This signal is the subject of Chapter 3 and will be discussed more fully there.
1.4
Preparations used for the study of the nervous
sys-tem
A wide range of preparations have been developed for the study of the nervous system. Each strikes a different balance between fidelity to the system ultimately of interest, access for recording and the ability to control and manipulate the system to implement experimental protocols.
more invasive surgical procedures than clinically indicated or that require otherwise unnecessary pharmacological manipulation are deemed unethical and so cannot be carried out.
Pharmacological manipulation and invasive recording techniques can, how-ever, be applied to ex vivo human brain tissue. Resection of the brain is indicated for a number of neurological problems, for example, for the treatment of some cases of pharmacologically refractory focal epilepsy. The tissue removed, after appropri-ate clinical tests, is often made available for research purposes. This tissue often provides exact insights in to disease processes, rather than only being a model of them. However, the availability of such tissue is limited and clinical considerations must always take precedence over maximising the quality of the samples for research. Additionally, the tissue removed is almost always affected by a disease process and so it is unlikely to be suitable for the study of physiological processes.
Although it is the human brain that is ultimately of interest, the brains of other mammals are thought to provide a good model of human brain function and are widely used for the study of the nervous system. As with human brain, the brains of other mammals can be studiedin vivo, however, although there are strict ethical controls, where justified, more invasive in vivo surgical procedures can be carried out. Furthermore these can be implemented in both healthy animals and those affected by disease as well as in transgenic lines. The access for both recording and manipulation is, however, still limited and soin vivo preparations are unsuitable for some protocols. Equally, some protocols do not requirein vivomeasurement and so it would be unethical to use such a preparation.
Typically experiments are either carried out in vivo, in tissue slices or in cultured cells. However, an intermediate preparation is possible with the guinea pig brain. The guinea pig brain can be removed and perfused through its circle of Willis, allowing the intact brain to be viably maintained out of the skull, this is termed the isolated brain. This preparation allows improved access and pharma-cological manipulation while preserving the complete network connectivity. Access for recording is, however, still more limited than in tissue slice or cell culture.
ac-cess. The brain of an animal is rapidly removed and, whilst cold, cut in to slices ∼ 400 µm thick. The slices are then rewarmed and immersed in an oxygenated artificial cerebrospinal fluid (aCSF) which maintains the viability of the tissue by diffusion. The cutting process severs a large proportion of the network connections, however, sections are cut that maximise connectivity within the slice and such slices exhibit spontaneous activity, indicating a significant degree of connectivity. The advantage of the acute tissue slice preparation is the degree of access to the tissue that it facilitates, both for recording from the tissue and for pharmacological, ionic, electrical and mechanical manipulation. Additionally, all experimentation is carried out once the animal is dead and so the suffering caused is minimised. For these rea-sons all experiments presented in this thesis that involved animal tissue employed this preparation.
Typically acute tissue slices are only viable on the day of preparation, how-ever, tissue from young animals can be cultured. Cultured slices are termed organ-otypics and are well suited to the study of slow processes that require direct access to the cells (Gahwiler et al., 1997). For example, cells in culture can be transfected and the effect of expression of a resulting protein can be investigated, a process that would not occur within the time scale of viability of an acute tissue slice. Unlike in cultures of separate cells, some synaptic connections between cells are preserved, allowing the study of synaptic transmission. However, the development of the cells within an organotypic slice can differ from that which would occurin vivo so some caution is required.
1.5
Seizures
Clinically, an epileptic seizure is defined as an unprovoked transient occurrence of signs or symptoms due to abnormal excessive or synchronous neuronal activity in the brain (Fisher et al., 2005). The signs and symptoms of seizures vary considerably depending on the location and extent of the affected brain area. Seizures are divided in to two main classes: focal seizures, those that are localised to an area of the brain and generalised seizures, those that involve the majority of the cortex. Some seizures do not cause a loss of consciousness, but depending on the location of the seizure activity, may cause motor signs or sensory, autonomic or psychic symptoms, these are termed simple partial seizures (Alarcon et al., 2009). If a focal seizure affects both hemispheres it can impair consciousness, this is then termed a complex partial seizure. Generalised seizures cause a loss of consciousness in addition to one or more of a number of other possible signs, most commonly (in approximately 60% of patients) convulsions. Typically, limbs become rigid for a few seconds (tonic phase) followed by repetitive contractions of all limbs at approximately 3 Hz, where the limbs jerk in one direction followed by a slower movement back to the original position before jerking again (clonic phase) (Alarcon et al., 2009).
Figure 1.12: The local field potential recorded during a typical burst of electrographic seizure activity in the Mg2+ free seizure model in acute neocortical slice.
chloride (Pavlov et al., 2013) and by synchronous recovery from inhibition of a larger population of principal neurons (Klaassen et al., 2006). The propagation of seizures is also complex and involves all three known mechanisms of neuronal cou-pling: chemical synapses, gap junctions and ephaptic coupling. Propagation can even occur independently of both chemical synapses and gap junctions (Jefferys and Haas, 1982; Zhang et al., 2014). During ictal events interacting networks appear to coalesce and fragment (Kramer et al., 2010), similarly seizure may involve a micro to macro seizure transition (Stead et al., 2010).
Understanding seizure dynamics is of fundamental scientific interest, but also of significant practical importance. An understanding of seizure onset, particularly identification of the features of pre-ictal states, would facilitate the implementation of systems to predict seizures. Temporally targeted therapy could then be provided to prevent the seizure occurring or a system could warn the patient of the impending event so that they could take steps to avoid injury during the seizure. Greater understanding of the mechanisms that cause seizure termination could be used to inform the development of improved anti-epileptic therapies.
1.6
Epilepsy
is diagnosed with epilepsy if they have two or more unprovoked epileptic seizures within a period of two years (Alarcon et al., 2009).
Epilepsy is broadly classified on the basis of its cause. Some types of epilepsy are genetic, for example, Dravet’s syndrome is caused by a mutation in the sodium channelαI subunit gene SCN1A (Depienne et al., 2009; Dravet, 2011; Marini et al., 2011). Other types of epilepsy are termed symptomatic - the result of an insult to the brain, for example, febrile infection related epilepsy syndrome (FIRES) - the development of epilepsy by a school age child as the result of a period of status epilepticus caused by a fever (Kramer et al., 2011; van Baalen et al., 2012; Serrano-Castro et al., 2013). Finally, epilepsy can be idiopathic.
Although it is not completely understood, a number of processes have been implicated in epileptogenesis. For example, granule cell dispersion, mossy fibre sprouting, raised intracellular chloride potentials and astrogliosis and associated ADK up regulation have all been observed (Pitkanen and Lukasiuk, 2011; Boison, 2008).
There are three approaches to the treatment of epilepsy: pharmacological, surgical and electrical. Anti-epileptic drugs work via a variety of mechanisms, for example, benzodiazepines work by enhancing inhibition by allosteric modulation of GABAAreceptors, gabapentin works by binding to theα2δ subunit of the
voltage-gated calcium channels and reduces synaptic release of glutamate. Resection can be carried out to treat some cases of focal epilepsy. Finally, use of electrical stimulation shows promise in treating epilepsy (Alarcon et al., 2009; Jiruska et al., 2010b). Currently it is estimated that 30% of patients with epilepsy would still suffer from seizures even with optimal treatment (Deacon, 2011), however, recent studies of the mechanisms of pharmacological resistance have implicated P-glycoprotein (Loscher, 2005; Volk and Loscher, 2005; Brandt et al., 2006) and combined treatment with both an anti-epileptic drug and a P-glycoprotein inhibitor has shown significant promise (Potschka et al., 2002).
incidence of epilepsy is approximately 51 per 100,000 of population per year, the prevalence of epilepsy is around 1 in 103 people (1 in 242 for those under 18 years) and approximately 600,000 people take anti-epileptic drugs (Deacon, 2011). In the UK 1,150 people died of epilepsy related causes in 2009, the average number of years of life lost per person was 30.2 (Deacon, 2011). In England, Wales and Scotland 69,700 people with epilepsy were claiming disability living allowance in 2009. This cost∼ £244 million per year (Deacon, 2011).
1.7
Models of epilepsy
Numerous models have been developed to replicate the features of epilepsy. These range from in vivo models, through acute slice models and dissociated cells, to cultures of transgenic cells and computational models. For example, lateral fluid percussion is used in rats as a model of post-traumatic epilepsy. In contrast, cell cultures are used to study the properties of ion channels arising from genes mutated to reflect those causing genetic epilepsies. For thorough reviews of experimental and computational models of epilepsy see Pitkanen et al. (2006) and Soltesz and Staley (2008) respectively.
In this thesis the hypomagnesemic seizure model (Mody et al., 1987) was employed in acute slice of the rat neocortex. This model produces spontaneous seizures in neocortical tissue from wild type rats without any pretreatmentin vivo. Mg2+ ions block N-methyl-D-aspartate receptor channels, by removing this block neocortical tissue becomes more excitable and spontaneous electrographic seizures occur in the neocortex after approximately 20 minutes. This model exhibits the spatio-temporal dynamics that were of interest here, while causing minimal suffering to the animals and so was used for each of the projects presented here.
1.8
Thesis outline
a device for the perfusion of in vitro tissue with multiple solutions, providing an entirely in vitro model of focal epilepsy. Chapter 3 presents a transformation to convert the slow dynamics of intrinsic optical signals in vitro to the form of the local field potential, facilitating the study of the spatio-temporal dynamics of focal seizure activityin vitro. Chapter 4 presents the application of the transformation derived in Chapter 3 to the study of the spatio-temporal dynamics of extracellular adenosine release in response to electrographic seizure activityin vitro.
Bibliography
Aitken, P., Fayuk, D., Somjen, G. G., and Turner, D. Use of intrinsic optical signals to monitor physiological changes in brain tissue slices. Methods, 18:91–103, 1999.
Alarcon, G., Nashef, L., Cross, H., Nightingale, J., and Richardson, S. Epilepsy. Oxford University Press, 2009.
Anastassiou, C., Perin, R., Markram, H., and Koch, C. Ephaptic coupling of cortical neurons. Nature Neuroscience, 14:217–224, 2011.
Andrew, R., Jarvis, C., and Obeidat, A. Potential sources of intrinsic optical signals imaged in live brain slices. Methods, 18(2):185 – 196, 1999. ISSN 1046-2023.
Apps, R. and Garwicz, M. Anatomical and physiological foundations of cerebellar information processing. Nature Reviews Neuroscience, 6:297–311, 2005.
Bean, B. The action potential in mammalian central neurons. Nature Reviews Neuroscience, 8:451–465, 2007.
Bjorness, T. and Greene, R. Adenosine and sleep. Current Neuropharmacology, 7: 238–245, 2009.
Blanco-Centurion, C., Xu, M., Murillo-Rodriguez, E., Gerashchenko, D., Shiromani, A., Salin-Pascual, R., Hof, P., and Shiromani, P. Adenosine and sleep homeostasis in the basal forebrain. The Journal of Neuroscience, 26:8092–8100, 2006.
Boison, D. The adenosine kinase hypothesis of epileptogenesis. Progress in Neuro-biology, 84:249–262, 2008.
hypothesis of drug resistance in epilepsy: Proof-of-principle in a rat model of temporal lobe epilepsy. Neurobiology of Disease, 24:202–211, 2006.
Briar, C., Lasserson, D., Gabriel, C., and Sharrack, B. Nervous System. Mosby, 2003.
Buchheim, K., Schuchmann, S., Siegmund, H., Gabriel, H., Heinemann, U., and Meierkord, H. Intrinsic optical signal measurements reveal characteristic features during different forms of spontaneous neuronal hyperactivity associated with ECS shrinkage in vitro. Eur, J. Neurosci., 11:1877–1882, 1999.
Buchheim, K., Wessel, O., Siegmund, H., Schuchmann, S., and Meierkord, H. Pro-cesses and components participating in the generation of intrinsic optical signal changes in vitro. European Journal of Neuroscience, 22:125–132, 2005.
Buzsaki, G., Anastassiou, C., and Kocj, C. The origin of extracellular fields and currents - EEG, ECog, LFP and spikes.Nature Reviews Neuroscience, 13:407–420, 2012.
Cajal, S. Comparative study of the sensory areas of the human cortex. 1899.
Chang, S., Kim, I., Marsh, M., Jang, D., Hwang, S., Van Gompel, J., Goerss, S., Kimble, C., Bennet, K., Garris, P., Blaha, C., and Lee, K. Wireless fast-scan cyclic voltammetry to monitor adenosine in patients with essential tremor during deep brain stimulation. Mayo Clinic Proceedings, 87:760–765, 2012.
Clarke, L. and Barres, B. Emerging roles of astrocytes in neural circuit development. Nature Reviews Neuroscience, 14:311–321, 2013.
Cohen, L., Keynes, R., and B., H. Light scattering and birefringence changes during nerve activity. Nature, 218:438 – 441, 1968.
Dale, N. and Frenguelli. Release of adenosine and ATP during ischemia and epilepsy. Current Neuropharmacology, 7:160–179, 2009.
Dale, N., Pearson, T., and Frenguelli, B. Direct measurement of adenosine release during hypoxia in the CA1 region of the rat hippocampal slice. Journal of Phys-iology, 526:143–155, 2000.
Daly, J. and Padgett, W. Agonist activity of 2- and 50-substituted adenosine analogs and their N6-cycloalkyl derivatives at A1- and A2-adenosine receptors coupled to adenylate cyclase. Biochem Pharmacol, 43:1089–1093, 1992.
Daumas, S., Ceccom, J., Halley, H., Frances, B., and Lassalle, J.-M. Activation of metabotropic glutamate receptor type 2/3 supports the involvement of the hip-pocampal mossy fiber pathway on contextual fear memory consolidation.Learning and Memory, 16:504–507, 2009.
De Zeeuw, C., Hoebeek, F., Bosman, L., Schonewille, M., Witter, L., and Koekkoek, K. Spatiotemporal firing patterns in the cerebellum. Nature Reviews Neuro-science, 12:327–344, 2011.
Deacon, K. Epilepsy prevalence, incidence and other statistics. Technical report, Joint Epilepsy Council, September 2011.
Depienne, C., Trouillard, O., Saint-Martin, C., Gourfinkel-An, I., Bouteiller, D., Carpentier, W., Keren, B., Abert, B., Gautier, A., Baulac, S., Arzimanoglou, A., Cazeneuve, C., Nabbout, R., and LeGuern, E. Spectrum of SCN1A gene mutations associated with Dravet syndrome: analysis of 333 patients. Journal of Medical Genetics, 46:183–191, 2009.
D’Esposito, M., Deouell, L., and Gazzaley, A. ALterations in the bold fMRI signal with ageing and disease: A challenge for neuroimaging. Nature Reviews Neuro-science, 4:863–872, 2003.
Dravet, C. The core Dravet syndrome phenotype. Epilepsia, 52:3–9, 2011.
hip-pocampal adenosine A3 receptors produces a desensitization of A1 receptor- me-diated responses in rat hippocampus. Journal of Neuroscience, 17:607–614, 1997.
During, M. and Spencer, D. Adenosine: A potential mediator of seizure arrest and postictal refractoriness. Annals of Neurology, 32:618–624, 1992.
Edwards, A., Brown, G., Cope, M., Wyatt, J., McCormick, D., Roth, S., Delpy, D., and Reynolds, E. Quantification of concentration changes in neonatal human cerebral oxidized cytochrome oxidase. Journal of Applied Physiology, 71:1907– 1913, 1991.
Fayuk, D., Aitken, P., Somjen, G., and Turner, D. Two different mechanisms under-lie reversible, intrinsic optical signals in rat hippocampal slices. J. Neurophysiol., 87:1924–1937, 2002.
Fisher, R., van Emde Boas, W., Blume, W., Elger, C., Genton, P., Lee, P., and Engel, J. Epileptic seizures and epilepsy: Definitions proposed by the Interna-tional League Against Epilepsy (ILAE) and the InternaInterna-tional Bureau for Epilepsy (IBE). Epilepsia, 46:470–472, 2005.
Fredholm, B., Ijzerman, A., Jacobson, K., Klotz, K.-N., and Linden, J. Interna-tional union of pharmacology. xxv. nomenclature and classification of adenosine receptors. Pharmacological Reviews, 53:527–552, 2001.
Frenguelli, B., Lllaudet, E., and Dale, N. High-resolution real-time recording with microelectrode biosensors reveals novel aspects of adenosine release during hy-poxia in rat hippocampal slices. Journal of Neurochemistry, 86:1506–1515, 2003.
Gahwiler, B., Capogna, M., Debanne, D., McKinney, R., and Thompson, S. Organ-otypic slice cultures: a technique has come of age. Trends in Neuroscience, 20: 471–477, 1997.
Gouras, P. Spreading depression of activity in amphibian retina. Am. J. Physiol., 195:28–32, 1958.
in the olfactory bulb are coupled to glutamate release and uptake. Neuron, 52: 335–345, 2006.
Harris, K. and Mrsic-Flogel, T. Cortical connectivity and sensory coding. Nature, 503:51–58, 2013.
Haydon, P. Glia: listening and talking to the synapse.Nature Reviews Neuroscience, 2:185–193, 2001.
Heeger, D. and Ress, D. What does fMRI tell us about neuronal activity? Nature Reviews Neuroscience, 3:142–151, 2002.
Holthoff, K. and Witte, O. Intrinsic optical signals in rat neocortical slices measured with near-infrared dark-field microscopy reveal changes in extracellular space. J. Neurosci., 16:2740–2749, 1996.
Huang, Z., Urade, Y., and Hayaishi, O. The role of adenosine in the regulation of sleep. Current Topics in Medicinal Chemistry, 11:1047–1057, 2011.
Hunter, C., Bennet, L., Power, G., Roelfsema, V., Blood, A., Quaedackers, J., George, S., Guan, J., and Gunn, A. Key neuroprotective role for endogenous A1 receptor activation during asphyxia in the fetal sheep. Stroke, 34:2240–2245, 2003.
Jarvis, C., Lilge, L., Vipond, G., and Andrew, R. Interpretation of intrinsic optical signals and calcein fluorescence during acute excitotoxic insult in the hippocampal slice. Neuroimage, 10:357–372, 1999.
Jefferys, J. and Haas, H. Synchronised bursting of CA1 hippocampal pyramidal cells in the absence of synaptic transmission. Nature, 300:448–450, 1982.
Jiruska, P., Csicsvari, J., Powell, A., Fox, J., Chang, W.-C., Vreugdenhil, M., Xi-aolia, L., Palus, M., Bujan, A., Dearden, R., and Jefferys, J. High-frequency network activity, global increase in neuronal activity and synchrony expansion precede epileptic seizuresin vitro. Journal of Neuroscience, 30:5690–5701, 2010a.
Jiruska, P., de Curtis, M., Jefferys, J., Schevon, C., Schiff, S., and Schindler, K. Synchronization and desynchronization in epilepsy: controversies and hypotheses. Journal of Physiology, 591:787–797, 2013.
Kandel, E., Schwartz, J., Jessell, T., Siegelbaum, S., and Hudspeth, A. Principles of neural science. McGraw-Hill, 2013.
Kerr, J. and Denk, W. Imaging in vivo: watching the brain in action. Nature Reviews Neuroscience, 9:195–205, 2008.
Kitaura, H., Tsujita, M., Huber, V., Kakita, A., Shibuki, K., Sakimura, K., Kwee, I., and Nakada, T. Activity-dependent glial swelling is impaired in aquaporin-4 knockout mice. Neurosci. Res., 64:208–212, 2009.
Klaassen, A., Glykys, J., Maguire, J., Labarca, C., Mody, I., and Boulter, J. Seizures and enhanced cortical GABAergic inhibition in two mouse models of human au-tosomal dominant nocturnal frontal lobe epilepsy. Proceedings of the National Academy of Sciences of the USA, 103:19152–19157, 2006.
Klyuch, B., Dale, N., and Wall, M. Deletion of ecto-50-nucleotidase (CD73) reveals direct action potential dependent adenosine release. Journal of Neuroscience, 32: 3842–3847, 2012.
Knopfel, T. Genetically encoded optical indicators for the analysis of neuronal circuits. Nature Reviews Neurocience, 13:687–700, 2012.
Kramer, M., Eden, U., Kolaczyk, E., Zepeda, R., Eskandar, E., and Cash, S. Coa-lescence and fragmentation of cortical networks during focal seizures. Journal of Neuroscience, 30:10076–10085, 2010.
Kramer, U., Chi, C.-S., Lin, K.-L., Specchio, N., Sahin, M., Olson, H., Nabbout, R., Kluger, G., Lin, J.-J., and van Baalen, A. Febrile infection related epilepsy syndrome (FIRES): Pathogenesis, treatment, and outcome: A multicenter study on 77 children. Epilepsia, 52:1956–1965, 2011.
Latini, S. and Pedata, F. Adenosine in the central nervous system: release mech-anisms and extracellular concentrations. Journal of Neurochemistry, 79:463–484, 2001.
Linley, J. Perforated whole-cell patch-clamp recording. Methods in Molecular Biol-ogy, 998:149–157, 2013.
Lipton, P. Effects of membrane depolarization on light scattering by cerebral cortical slices. J. Physiol., 231:365–383, 1973.
Lisman, J., Raghavachari, S., and Tsien, R. The sequence of events that underlie quantal transmission at central glutamatergic synapses. Nature Reviews Neuro-science, 8:597–609, 2007.
Loscher, W. Drug resistance in brain diseases and the role of drug efflux transporters. Nature Reviews Neuroscience, 6:591–602, 2005.
Marini, C., Scheffer, I., Nabbout, R., Suls, A., De Jonge, P., Zara, F., and Guerrini, R. The genetics of Dravet syndrome. Epilepsia, 52:24–29, 2011.
Mody, I., Lambert, J., and Heinemann, U. Low extracellular magnesium induces epileptiform activity and spreading depression in rat hippocampal slices. Journal of Neurophysiology, 57:869–888, 1987.
Pasini, F., Guideri, F., Picano, E., Parenti, G., Petersen, C., and Varga, T., A. abd Perri. Increase in plasma adenosine during brain ischemia in man: A study during transient ischemic attacks, and stroke. Brain Research Bulletin, 51:327– 330, 2000.
Pavlov, I., Kaila, K., Kullmann, D., and Miles, R. Cortical inhibition, pH and cell excitability in epilepsy: what are optimal targets for antiepileptic interventions? Journal of Physiology, 591:765–774, 2013.
Peakman, M. and Hill, S. Adenosine A2B-receptor-mediated cyclic AMP
accumula-tion in primary rat astrocytes. British Journal Pharmacology, 111:191–198, 1994.
extra-tion of neuronal funcextra-tion in rat hippocampusin vitro.Journal of Neurochemistry, 97:1357–136, 2006.
Pereda, A. Electrical synapses and their functional interactions with chemical synapses. Nature Reviews Neuroscience, 15:250–263, 2014.
Perkins, K. Cell-attached voltage-clamp and current-clamp recording and stimula-tion techniques in brain slices. Journal of Neuroscience Methods, 154:1–18, 2006.
Pinto, D., Patrick, S., Huang, W., and Connors, B. Initiation, propagation, and termination of epileptiform activity in rodent neocortex in vitro involve distinct mechanisms. Journal of Neuroscience, 25:8131–8140, 2005.
Pitkanen, A. and Lukasiuk, K. Mechanisms of epileptogenesis and potential treat-ment targets. Lancet Neurology, 10:173–186, 2011.
Pitkanen, A., Schwartzkroin, P., and Moshe, S. Models of seizures and epilepsy. Elsevier Academic Press, 2006.
Potschka, H., Fedrowitz, M., and Loscher, W. P-glycoprotein-mediated efflux of phenobarbital, lamotrigine, and felbamate at the blood-brain barrier: evidence from microdialysis experiments in rats. Neuroscience Letters, 327:173–176, 2002.
Ralevic, V. and Burnstock, G. Receptors for purines and pyrimidines. Pharmaco-logical reviews, 50:413–492, 1998.
Raman, I. and Bean, B. Ionic currents underlying spontaneous action potentials in isolated cerebellar Purkinje neurons. The Journal of Neuroscience, 19:1663–1674, 1999.
Rector, D., Poe, G., Kristensen, M., and Harper, R. Light scattering changes follow evoked potentials from hippocampal schaffer collateral stimulation.J. Neurophys-iol., 78:1707 – 1713, 1997.
Ribrault, C., Sekimoto, K., and Triller, A. From the stochasticity of molecular pro-cesses to the variability of synaptic transmission. Nature Reviews Neuroscience, 12:375–387, 2011.
Ross, A., Nguyen, M., Privman, E., and Venton, B. Mechanical stimulation evokes rapid increases in adenosine concentration in the prefrontal cortex. Journal of Neurochemistry, 130:50–60, 2014.
Sakmann, B. and Neher, E. Patch clamp techniques for studying ionic channels in excitable membranes. Annual Review of Physiology, 46:455–472, 1984.
Schmitt, L., Sims, R., Dale, N., and Haydon, P. Wakefulness affects synaptic and network activity by increasing extracellular astrocyte-derived adenosine. Journal of Neuroscience, 32:4417–4425, 2012.
Scott, R., Lhatoo, S., and Sander, J. The treatment of epilepsy in developing countries: where do we go from here? Bulletin of the World Health Organisation, 79:344–351, 2001.
Serrano-Castro, P., Quiroga-Subirana, P., Payan-Ortiz, M., and Fernandez-Perez, J. The expanding spectrum of febrile infection-related epilepsy syndrome (FIRES). Seizure, 22:153–155, 2013.
Sims, R., Wu, H., and Dale, N. Sleep-wake sensitive mechanisms of adenosine release in the basal forebrain of rodents: AnIn Vitro Study. PLoS One, 8:e53814, 2013.
Sohl, G., Maxeiner, S., and Willecke, K. Expression and functions of neuronal gap junctions. Nature Reviews Neuroscience, 6:191–200, 2005.
Soltesz, I. and Staley, K.Computational neuroscience in epilepsy. Elsevier Academic Press, 2008.
Stepnoski, R., LaPorta, A., Raccuia-Behling, F., Blonder, G., Slusher, R., and Kleinfeld, D. Noninvasive detection of changes in membrane potential in cultured neurons by light scattering. Proc. Natl. Acad. Sci. USA, 88:9382 – 9386, 1991.
Strange, B., Witter, M., Lein, E., and Moser, E. Functional organization of the hippocampal longitudinal axis. Nature Reviews Neuroscience, 15:655–669, 2014.
Takagaki, K., Lippert, M., Dann, B., Wagner, T., and Ohi, F. Normalization of voltage-sensitive dye signal with functional activity measures. PLos ONE, 3: e4041, 2008.
Truccolo, W., Donoghue, J., Hochberg, L., Eskandar, E., Madsen, J., Anderson, W., Brown, E., Halgren, E., and Cash, S. Single-neuron dynamics in human focal epilepsy. Nature Neuroscience, 14:635–641, 2011.
van Baalen, A., Husler, M., Plecko-Startinig, B., Strautmanis, J., Vlaho, S., Geb-hardt, B., Rohr, A., Abicht, A., Kluger, G., Stephani, U., Probst, C., Vincent, A., and Bien, C. Febrile infection-related epilepsy syndrome without detectable autoantibodies and response to immunotherapy: a case series and discussion of epileptogenesis in FIRES. Neuropediatrics, 43:209–216, 2012.
Van Gompel, J., Bower, M., Worrell, G., Stead, M., Chang, S.-Y., Goerss, S., Kim, I., Bennet, K., Meyer, F., Marsh, W., Blaha, C., and Lee, K. Increased cortical extracellular adenosine correlates with seizure termination.Epilepsia, 55:233–244, 2014.
Volk, H. and Loscher, W. Multidrug resistance in epilepsy: rats with drug-resistant seizures exhibit enhanced brain expression of P-glycoprotein compared with rats with drug-responsive seizures. Brain, 128:1358–1368, 2005.
Volterra, A. and Meldolesi, J. Astrocytes, from brain glue to communication ele-ments: the revolution continues. Nature Reviews Neuroscience, 6:626–640, 2005.
Wall, M. and Dale, N. Neuronal transporter and astrocytic ATP exocytosis underlie activity-dependent adenosine release in the hippocampus. Journal of Physiology, 591:3853–3871, 2013.
Wenjun, J., Zhang, R.-J., and Wu, J.-Y. Voltage-sensitive dye imaging of population neuronal activity in cortical tissue. Journal of Neuroscience Methods, 115:13 – 27, 2002.
Winn, H., Welsh, J., Rubio, R., and Berne, R. Changes in brain adenosine during bicuculine-induced seizures in rats. Circulation Research, 47:568–577, 1980.
Zhang, M., Ladas, T., Qiu, C., Shivacharan, R., Gonzalez-Reyes, L., and Durand, D. Propagation of epileptiform activity can be independent of synaptic transmission, gap junctions, or diffusion and is consistent with electrical field transmission. Journal of Neuroscience, 34:1409–1419, 2014.
Zhang, Z., Valiante, T., and Carlen, P. Transition to seizure from ‘macro’ to ‘micro’ mysteries. Epilepsy Research, 97:290–299, 2011.
Chapter 2
A chamber for the perfusion of
in vitro
tissue with multiple
solutions
The acute neural tissue slice is a widely used preparation, providing a powerful compromise between invasiveness, access and control. Tissue can readily be treated, both locally and globally, pharmacologically or with changes in ionic conditions. However, it is harder to manipulate the environment of regions of tissue on the intermediate scale, that of areas comprising a significant proportion, but not the whole, of a tissue slice. Manipulation of the perfusing aCSF on this scale could be used, for example, as a model of focal epilepsy. An excitant solution could be applied to part of a tissue slice, to induce electrographic seizure activity in that region, while the remainder of the slice was perfused with a standard aCSF. The propagation of the pathological activity from the activated region in to the otherwise quiescent tissue could then be studied. A chamber was developed by Blake et al. (2007) to enable the manipulation of the environment of extended regions of tissue. However, the system developed by Blakeet al. entirely encapsulated the tissue slice except for a single edge. Micro-electrode recordings could, therefore, only be made from that single edge.
Figure 2.1: The chamber produced for Prof. Frenguelli, University of Warwick. For scale, the chamber is mounted on a standard 26×75 mm microscope slide.
slice for micro-electrodes. This chapter contains the published paper describing this work. Some preliminary development of the chamber was included in a submission for an MSc, however, neither this chamber design, nor any of the data, analysis or text presented here were included in the submission. I designed the chamber, planned and carried out the experiments, carried out the data analysis and wrote the paper. The design, manufacture and initial testing of the chamber was carried out under the supervision of Dr James Covington, the planning and implementation of the biological testing of the chamber was carried out under the supervision of Dr Mark Wall.
A chamber for the perfusion of
in vitro
tissue with
multiple solutions
Matthew G. Thomas1,2,3, James A. Covington2 and Mark J. Wall1 1 School of Life Sciences,2 School of Engineering,3 MOAC Doctoral Training
Centre, University of Warwick, CV4 7AL, United Kingdom
2.1
Abstract
There are currently no practical systems that allow extended regions (>5 mm2) of a tissue slicein vitroto be exposed, in isolation, to changes in ionic conditions or to pharmacological manipulation. Previous work has only achieved this at the expense of access to the tissue for recording electrodes. Here we present a chamber that allows a tissue slice to be maintained in multiple solutions, at physiological temperatures, and preserves the ability to record from the slice. We demonstrate the effectiveness of the tissue bath with respect to minimising the mixing of the solutions, maintaining the viability of the tissue and preserving the ability to simultaneously record from the slice.
2.2
Introduction
focal pharmacological manipulation on the micron scale, less invasively than with conventional glass micropipettes (Mohammed et al., 2008; Queval et al., 2010; Tang et al., 2011) and improved perfusion of tissue slices allowing thicker tissue slices to be viably be maintained (Choi et al., 2007; Hill and Greenfield, 2011).
The global conditions of a tissue slice can be simply altered by changing the solution supplied to the tissue bath. The environment of regions of tissue on the scale of single cells can be modified using pressure ejection systems and micropipettes (Smith and Cunningham, 1983; Salierno et al., 2007) as well as by microfluidic approaches (Queval et al., 2010). However, the ability to expose an extended region (>5 mm2) within a tissue slice to a change in conditions is limited. Work by Blake et al. (Blake et al., 2007) used laminar flow to successfully maintain adjacent regions of tissue in different media. Their device did not, however, facilitate recording from the tissue surface. Access for recording electrodes was only possible along a single edge of the tissue. This was satisfactory for the medullary slices that were studied. However, for many applications access for recording electrodes to the tissue surface is essential (Rutecki et al., 1985; Mody et al., 1987).
An example of an application of a chamber capable of exposing an extended region (>5 mm2) within a tissue slice to a change in conditions is in the study of the propagation of epileptiform activity across neural tissue. Epileptiform activity is commonly induced in neural tissue by the modification of the perfusing medium (Jefferys and Haas, 1982; Konnerth et al., 1984). A chamber that perfuses regions of a tissue slice with different media would allow the study of the propagation of epileptiform activity, in the region treated with excitant solution, into an adjacent region, maintained in physiological medium. This provides a model for the study of the generalisation of focal seizure activity.