ISSN Online: 1945-3108 ISSN Print: 1945-3094
DOI: 10.4236/jwarp.2019.1111082 Nov. 29, 2019 1408 Journal of Water Resource and Protection
Hydrogeophysical Characterization of a
Weathered-Fractured Aquifer System:
A Case Study of Olbanita, Lower
Baringo Basin, Kenya Rift
Benjamin Sosi
1,2*, Justus Barongo
3, Albert Getabu
2, Samson Maobe
21Department of Natural Resources, Egerton University, Egerton, Kenya 2Department of Natural Resources, Kisii University, Kisii, Kenya 3Department of Geology, University of Nairobi, Nairobi, Kenya
Abstract
Groundwater yields in the Kenya Rift are highly unsustainable owing to geo-logical variability. In this study, field hydraulic characterization was per-formed by using geo-electric approaches. The relations between electric-al–hydraulic (eh) conductivities were modeled hypothetically and calibrated empirically. Correlations were based on the stochastic models and field-scale hydraulic parameters were contingent on pore-level parameters. By consi-dering variation in pore-size distributions over eh conduction interval, the relations were scaled-up for use at aquifer-level. Material-level electrical con-ductivities were determined by using Vertical Electrical Survey and hydraulic conductivities by analyzing aquifer tests of eight boreholes in the Olbanita aquifer located in Kenya rift. VES datasets were inverted by using the com-puter code IP2Win. The main result is that lnT =0.537 ln
(
Fa)
+3.695, the positive gradient indicating eh conduction through pore-surface networks and a proxy of weathered and clayey materials. An inverse (1/F-K) correla-tion is observed. Hydraulic parameters determined using such approaches may possibly contribute significantly towards sustainable yield management and planning of groundwater resources.Keywords
Electrical-Hydraulic Conductivity Model, Weathered-Fractured Aquifer System, Olbanita, Kenya Rift
How to cite this paper: Sosi, B., Barongo, J., Getabu, A. and Maobe, S. (2019) Hydro-geophysical Characterization of a Weathered- Fractured Aquifer System: A Case study of Olbanita, Lower Baringo Basin, Kenya Rift. Journal of Water Resource and Protection, 11, 1408-1425.
https://doi.org/10.4236/jwarp.2019.1111082
Received: September 28, 2019 Accepted: November 26, 2019 Published: November 29, 2019
Copyright © 2019 by author(s) and Scientific Research Publishing Inc. This work is licensed under the Creative Commons Attribution International License (CC BY 4.0).
http://creativecommons.org/licenses/by/4.0/
DOI: 10.4236/jwarp.2019.1111082 1409 Journal of Water Resource and Protection
1. Introduction
The frameworks of modern day characterization approaches are probabilistic and notoriously unreliable in application owing to inherent heterogeneity in fractured aquifers, scaling and uncertainty associated with their hydraulic para-meter values; however, the cost dimensions of their hydraulic data requirements are not commensurate. Theories such as fractal transport are founded on know-ledge of the probabilistic properties of the flow media [1] and [2]. As a potential measure of circumventing the high cost, [3] and [4] had conjectured that cheap-er, minimally invasive and technically robust geophysical data ought to supple-ment hydraulic data. References [1] and [5] proposed a means of modeling groundwater flow dynamics based on crossover statistics of groundwater head fluctuations. It was observed that the multi-fractionality exhibited, was condi-tioned by other factors, scale-diversity in material-level heterogeneity, whose descriptions require robust and systematic quantification of multi-fractal beha-vior of the hydraulic conductivity, K field. Advances made recently on the ap-plication of metrics obtained via radar (GPR) technology [6] [7], Nuclear mag-netic resonance, NMR [8] [9] [10] and seismic methods [11] have shown to cor-relate reasonably well with hydraulic conductivity. Despite the inroads made by various techniques, the convolution of poorly resolved computations of the pa-rameter K persists.
In this paper, we advance theoretically and validate empirically a more deter-ministic electrical–hydraulic (eh) conductivity model in a fractured aquifer. The theoretical footing of the eh correlation rests on the stochastic models by [12]
and [13] (hereinafter conveniently referred to as the model of Bernabé et al. and the BLM model respectively). The preferred “universal” power laws incorporated scale homogenization and uncertainty quantification; aspects which are conspi-cuously lacking in most probabilistic approaches. The BLM is a permeability k, model that quantifies the effects of pore network connectivity via the average coordination number z (i.e. the mean numbers of throats and pipes linked to a nodal pore), the hydraulic radius, rH and many others. The incorporation of z in
k, as a substitute to more expensive direct numerical simulation commonly ap-plicable to macroscopic properties in the fine-scale [14], further restricts effects of model parametric uncertainty onto model outputs. The methodology is thus viable especially for clay-contaminated fractured aquifers.
DOI: 10.4236/jwarp.2019.1111082 1410 Journal of Water Resource and Protection of connectedness, we formulate a hypothesis that whichever the structural eh conduction effect present in a 2-D sample, there is a dominant eh conduction phase. We then objectively validate the derived comprehensive eh conductivity relation in order to characterize a fractured rock aquifer wherein groundwater productivity is unsustainable.
2. Theory of Electrical—Hydraulic Conduction
in Fractured Rocks
Minerals in rocks conduct electrical current through interstitial fluids present in the rock pore–field scale features. Reference [14] observed elevated insitu con-ductivities within a wide spectrum of 10−1 to 10−8 mohm/m weighted against a
narrow array of 10−12 to 10−17 mohm/m in diverse rock materials. As a
conse-quent, geo-electrical conductivity, c may be thought to be associated with fluid conductivity, Cf and pore-surface conductivity, Cs [15] [16]. The extended
con-ceptualized models by [17] which comprises conductivity conditioned by: grain-matrix (Cgm), ion-exchange (Cex), and the Maxwellian-effects (Cmax) may
be used to clear any doubts.
To begin with, the BLM model considered normal lattices bearing cylindrical pipes and circular cross-sections immersed in an impermeable matrix. To widen its range of applicability, they conceptualized 2-D and 3-D lattices. In the case of 2-D set-ups, a thickness was designated to the systems to compute k and ∅. By applying random (e.g. by changing pipe radii) network simulations and invoking the Kirchoff’s law under periodic boundary conditions, BLM concluded that k is a power function of z (except near the percolation threshold zc) and pore radii
distribution σr. Log-uniform distributions were applied since micro-structural parameters such as pore radii in rocks are robustly varied [18] [19]. Numerical solution sought at varying values of z and σr, yielded clustered average values of k and ∅. Their simplified relation was:
(
)
2
2
1.5 ,
8 rH H
k z r
l
β ω
= −
π
(1)
where, rH is the hydraulic radius, β and ω, are controls to the log-transformed
measures of pore-size heterogeneity; and rH l
, is the proportion of average ef-fective pore radius to average pore parting transform (sometimes interpreted as
longitudinal pore aspect ratio). The factor
2
8 H r
l
π is a consequence of
Poi-seuille formula.
DOI: 10.4236/jwarp.2019.1111082 1411 Journal of Water Resource and Protection solution was sought by application of Kirchoff laws and the Poiseuille formula
[12]. As for k in the BLM model, the model of Bernabé et al. studied the associations of diverse permutations of ∅ and 1
F to
(
z z− c)
and arrived at the same conclusion that 1F obeyed a power law relationship stated as:
(
)
2
.
1 H
F r c
w z z
F l
τ
= −
π
(2)
By combining Equations (1) and (2), the model of Bernabé et al. was simpli-fied as:
( )
2 1
2
1 ,
H
H r
k C r
l F
−∝ ∝
=
(3)
where C is a prefactor for circular pipes, ∝,
σ
are functions of scale variations in the model of Bernabé et al. This result may appear based on analytical rela-tionship that electrical conduction and hydraulic flow replicas conform to equi-valently recognized array of linear equations.In spite of the advances to improve understanding of pore-level heterogeneity, it has been acknowledged that there does not exist a scale contingent universally accepted petrophysical models relating geophysical measurements to hydraulic parameters. In this study we perform modifications to scale-invariant stochastic relations above prior to applying them in a deterministic framework by using multi-scale data obtained from the Olbanita aquifer in Kenya Rift, for which so far no hydraulic characterization studies are available and sustainability of ground-water yield is uncertain.
3. Materials and Methods
3.1. Study Area
Olbanita aquifer occurs within the Lower Baringo Basin, Central Kenya Rift (Figure 1). The study area comprises a volcano-sedimentary sub-basin with an area of ≈6.25 sq. km roughly bound by latitudes 0˚07'S and 0˚10'N and longi-tudes 36˚05'E and 36˚15'S. The area has low relief (1650 - 1750 m asl.) and ASAL climate.
DOI: 10.4236/jwarp.2019.1111082 1412 Journal of Water Resource and Protection
Figure 1. Map of, (A) Africa, showing (B) Kenya in which (C) the Study area lies. The
groundwater wells are indicated by using blue circled dots).
fractured zones (comprised of trachytes tuffs and clays) in the volcanic rocks and sediments inter-bedded between volcanic rocks may also provide water in some localities.
3.2. Geo-Electric Resistivity Data
DOI: 10.4236/jwarp.2019.1111082 1413 Journal of Water Resource and Protection of 296 locations. Data inversion was conducted by using IP2Win software de-veloped by Borland Int. and distributed by Geoscan M. Ltd, Moscow, Russia. The interactive-semi interactive concept of the computer code and inversion procedures used provided by IPI-2Win. The VES data inversion output for each VES location was a graphical model defined by the layer resistivity ρ, and thick-ness h in plumb.
3.3. Aquifer Hydraulic Data
The aquifer hydraulic character in the Olbanita area was distinguished by con-fined weathered matrix interconnected and by non-extensive fractures (implying leaky conditions). Single well constant rate pumping test data collected recently by Rift Valley Water Services Board comprised the largest scale of investigation for this study. The test analysis has been, therefore, conducted by depending on Cooper-Jacob solution [21], stated as:
0
10 2
2.25
2.3 log ,
4 r
w
Tt Q
Z
T r S
=
π (4)
where Zr is the drawdown, Q is the pumping rate, T is the transmissivity, S is the
storatility, t0 is time interval since the start of pumping, and rw is the bore radius
(m).
3.4. Modifications to Pre-Existing Stochastic Models
Since detailed pore-level attributes are inconsequential individually but spatially varied bulk averages do, aquifer-level hydraulic determinations using stochastic-ity require up-scaling. Particle tracking studies by [22] suggest that fault con-duits significantly influence results. K measurements by [23] imply a direct rela-tion with density of conductive fracture zones and defects. However, Fracture density, hence matrix connectivity in volcanic rocks can increase with diminu-tive change in porosity [24], whereas at a local-scale higher porosity may slow- down the flow [25]. The Conduit Flow Process Model (CFPM) developed by
[26] linked turbulent flow to a pipe-network observed in outcropping normal faults, implying viscous laminarity for freshly fractured rock aquifers [22]. Tur-bulent flow was also observed by [22] in the pipe network representing un-faulted rock matrix blocks away from fault zones in the equivalent porous medium cha-racterized by Darcian fractures. Borehole geo-logs from the study area depict thick tuffaceous-clay layers. Constant rate aquifer tests also indicate low K values (in the order of magnitude of 10−1) with a fluid exchange phenomenon in which
block matrix flow aided by the PFN was identified. Further, the aggregate effect of water-rock interaction characterized by swelling of hydrophilic clays and consequent fracture space blockage implies that fractures undergo self-healing
[27], gradually reducing k-values. Therefore, we conceptualized as most appro-priate a turbulent flow regime (within both the partially closed rough fractures and block matrix) for the entire flow domain investigated.
DOI: 10.4236/jwarp.2019.1111082 1414 Journal of Water Resource and Protection better by using non-steady-state solution to the Darcian equation of flow represented by; Q 12w e3 P
L
µ ∆
= , where w is the width of each bond as detailed in
the Virtual Medial Axes (VMA) for fractured rock of [28], e is taken as the mean aperture thickness for an ideal fracture, μ is the groundwater dynamic viscosity, L is the path length where flow occurs and P is the pressure drop along the path. The hydraulic conductance K of ideal fractures would be distributed depending on the cubic law stated as; K=12w eµ3 ; in which the more fundamental and in-trinsic parameter k, which defines the pore geometry within the flow domain is
represented by 2
12 e
k= . For the field hydraulic conductivity, K in Equation (3) can be re-written as:
( ) 2 1 2 1 . H H r we
K C r
l F µ −∝ ∝ =
(5)
Since geologic matrix hydraulic conductivity is based on aperture/pore conduc-tance, the transmissivity, T for any aquifer interval is computed by using a geome-tric mean of aperture thicknesses ac as distributed within the limits of the specified
network interval. Therefore, we consider the dependence of field-scale effects on hydraulic apertures with a mean diameter, ac, in the fracture-matrix network. The
network transmissivity would then be expressed as; T a K a k= c = c weµ . Unlike e,
ac is a field-scale property which accounts for hydraulic channeling and the net
fracture surface area [29]. Additionally, conventional engineering hydrogeology practice [12] [13] and [30] recommends the use, in place of ac, a measurable
parameter such as hydraulic radius rH (e.g.
2 p H p V r A
= , where Vp and Ap are solid
volume and exposed solid-fluid interfacial area of the fractupore matrix, re-spectively. Hydraulic radius is occasionally defined as; p 2H
p
V r
A = as a scale-
invariant effect over a suite of aperture-networks with divergent pore radii dis-tributions.
Rock formation at preliminary stages such as weathering and transport abra-sion reorganize microstructural attributes proportionally [31] but randomly hence the expected variation in pore radius distributions and groundwater satu-ration. Locally, consequent distributions in electrical conductance depict broad and even skewed configurations [32]. Since the occurrences of micro-structural heterogeneities in rocks are strongly skewed, we consider the adequacy of log-uni- form distributions of apertures, fractures, and so forth. The relation in Equation (5) becomes:
( )
2 1( ) 3ln ln H ln
H
r we
T C F
l r µ −∝ − ∝ = −
DOI: 10.4236/jwarp.2019.1111082 1415 Journal of Water Resource and Protection Equation (6) is, therefore, the modified aquifer-scale model which relates a borehole-scale parameter T, and a micro-scale parameter F. The equation is a li-near function of the form:
,
Y a bX= + (7) in which the coefficients a and b depicting the intercept and gradient between T and F, respectively, are stated as:
( )
2 1 ln we rH
a C l µ −∝ =
(8)
3 H
b r−
∝
= −
(9)
To achieve dimensional logic, the two coefficients are in units of m2/day, while
F, being a ratio of resistivity values, is dimensionless. Since Equation (6) depicts field-scale parameters influenced by connectivity and heterogeneity of the flow medium, at each aquifer test site, natural logarithm of T was plotted versus nat-ural logarithm of F derived from corresponding VES data.
Because of the flexibility of the theoretical eh network model (that is, it can accommodate any network heterogeneity), a bond shrinkage model (such as [31]
model) was incorporated into the modified equation [15] [16] [17]. Accordingly, the relationships between ρ and k with ∅ fraction will be such that 1ρ is
expressed by Archie’s law; stated as 1 1 (m ) f α
ρ ρ ∅ ∅ whereas k is expressed by a
Kozen-type power relation; stated as k ( )m2k S
α∅ wherein the power m∅ is
Archie’s exponent also known as cementation factor and S represents the specif-ic surface area. Comparing these two relations, at macroscopspecif-ic scale, ∅ is common in the numerator with positive exponents implying a positive eh corre-lation. Considerations of these proportionalities, e.g. [15-17] showed that:
2 1
ln ln c k ln ,
a
Ba g m
T S F
A m δ µ − − ∅ = −
(10)
where in A and B are the pertinent proportionality constants mk and m∅ showing the different functions of bond shrinkage process; expressed accordingly
as; 2 2
2ln 2 0
1 1 k x m x x
= + >
+
− and
2 2 ln 0 1 x m x
∅ = − > ; 0< <x 1, where, empirical
studies frequently report m∅ in the range of 1 - 2, and x is the bond shrinkage operator by which the pore radii of throats and conduits are adjusted [15]. The factors; m m∅, k (hence the slope) must be positive since the pore-volume eh conduction envisaged by the bond shrinkage model depicts exactly this. To achieve structural synchrony between the modified models (Equations (6) and (10)) with the empirical model of the Olbanita aquifer, its slope, 3 0.537 k
DOI: 10.4236/jwarp.2019.1111082 1416 Journal of Water Resource and Protection expressed in relation to x as:
2 2
2 2
2ln 2 ln 0.537. 1
1 1
x x
b
x
x x
= + =
+
− −
(11)
which further reduced to:
2x− =2 ln .x (12)
Equation (12) was split into two relations stated as:
2 2,
y= x− (13)
and,
3ln .
y= x (14)
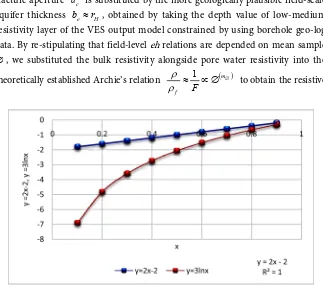
A numerical solution of Equations 13 and 14 wherein f(x) = y, y = 2x − 1 and y = 3 lnx for successive values of 0 < x > 1 was sought. When plotted simulta-neously on one chart scale, the intersection of the two graphs yields the solution to the equations (Figure 2). Accordingly, the two functions intersect at x = 0.9 for values of 0< <x 1. For that reason, the cementation exponent m∅, defined
by ln2 2 0
1
x m
x
∅ = − > ; 0< <x 1, was 1.1.
The cementation exponent obtained was used in the computation of porosity values at each VES station by correct substitution in the proportionality relations given that EC of groundwater was observed at all the borehole sites. Field-wide hydraulic conductivity values were also obtained by using; T a K= c , where fracture aperture ac is substituted by the more geologically plausible field-scale aquifer thickness be ≈rH, obtained by taking the depth value of low-medium resistivity layer of the VES output model constrained by using borehole geo-log data. By re-stipulating that field-level eh relations are depended on mean sample ∅, we substituted the bulk resistivity alongside pore water resistivity into the
theoretically established Archie’s relation 1 (m )
f F
ρ
[image:9.595.212.535.408.694.2]ρ ≈ ∝ ∅ ∅ to obtain the resistive
Figure 2. Approximated solution to f(x) = y, y = 2x − 1 and y = 3 lnx for successive values
DOI: 10.4236/jwarp.2019.1111082 1417 Journal of Water Resource and Protection component, F and porosity fraction, ∅ at each VES location. The macroscopic variation in K and F were then illustrated since the bond shrinkage model shows that as steps in the factor x get large, logarithmic ratios of the most probable mean ∅n evolve into the Kozen-type power equation and Archie’s law. (e.g. in
[15]; after the work of [31].
4. Results and Discussion
4.1. Hydraulic Parameters
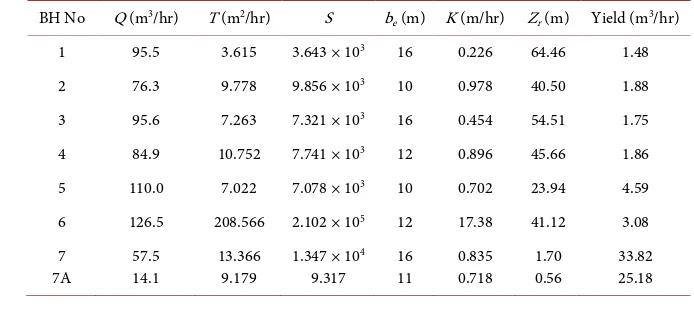
Aquifer storativity, flow and borehole yields in the area are found to be structu-rally controlled by the pervasive but variable array of fault-fracture traces. Groundwater BH 2 BH 5, BH 6, and BH 7 are intersected by major faults (Figure 1) and are the most productive in the area (Table 1). The Storativity, S-hydraulic conductivity, K relation depicts a direct correlation (highest in BH 6 and lowest in BH 1). BH 1 (the least productive) and BH 8 (dried-up borehole approx. 400 meters north of BH 7) are not intersected by any fault structure. The mean values of discharge recorded were highest at BH 6 (126.5 m3/hr) in the
north western periphery of the study, whereas the lowest discharge boreholes, BH 7 and BH 7A with mean discharges of 57.5 m3/hr and 14.1 m3/hr,
respective-ly, occurs in the eastern part near water plant. Groundwater boreholes located in the central portion (for example BH 1, BH 3 and BH 4) recorded average specific yields (that is, in the range of 1.48 - 1.86 m2/hr). BH 2, though located in this
zone is one of the most productive probably due to deep weathering associated with a fault zone as depicted from its geo-log.
[image:10.595.193.540.576.733.2]However, distinction of effective porosity values, hence permeability differen-tia in each continua becomes a crucial factor [22]. The intra-aquifer system fluid interaction observed in the data set was mainly block matrix flow to the pump-ing well via non-extensive fractures with the exception of BH 6. At this scale, pumping test data indicate that flow towards BH 6 is mainly controlled by SFN which is probably comprised of two sets: 1) the horizontal set responsible for sub-horizontal k, and 2) the less permeable sub-vertical set occurring within ad-jacent blocks that insures matrix connectivity decreasing drawdown at pumping.
Table 1. Hydraulic characteristics of the aquifer based on aquifer test analysis.
BH No Q (m3/hr) T (m2/hr) S b
e (m) K (m/hr) Zr (m) Yield (m3/hr)
1 95.5 3.615 3.643 × 10³ 16 0.226 64.46 1.48
2 76.3 9.778 9.856 × 10³ 10 0.978 40.50 1.88
3 95.6 7.263 7.321 × 10³ 16 0.454 54.51 1.75
4 84.9 10.752 7.741 × 10³ 12 0.896 45.66 1.86
5 110.0 7.022 7.078 × 10³ 10 0.702 23.94 4.59
6 126.5 208.566 2.102 × 10⁵ 12 17.38 41.12 3.08
7
7A 57.5 14.1 13.366 9.179 1.347 × 10
4
DOI: 10.4236/jwarp.2019.1111082 1418 Journal of Water Resource and Protection Conversely, elsewhere the PFN influences the adjacent block matrix only at a de-cimeter scale, thereby increasing k and S of the block (Table 1).
4.2. The Calibrated Aquifer Model
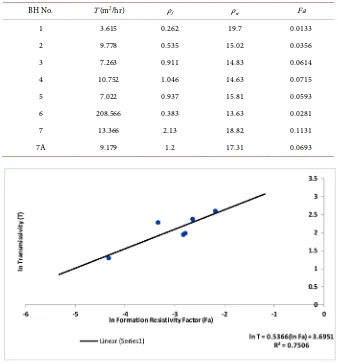
The algorithm in Equation (6) was satisfactorily calibrated by comparison with more experimental data from the study area (Table 2). By applying Archie’s law, which has its own theoretical pedigree to data, it can be construed that the index F is less than unity, a clear indication that the rock matrix is less resistive than pore fluid. The resultant graph gives a positive gradient (Figure 3) indicating that groundwater flow is through non-extensive fracture-pore surfaces as op-posed to flow through pore-volumes.
The observed linear regression correlation was:
(
)
[image:11.595.204.542.334.698.2]lnT =0.537 lnFa +3.695
(15) Equation (15) is the subsequent calibrated eh conductivity model approx-imated for Olbanita aquifer (Figure 3). The model is less rugged with reference
Table 2. Aquifer T and Fa at the pumping test sites
BH No. T (m2/hr) ρ
f ρw Fa
1 3.615 0.262 19.7 0.0133
2 9.778 0.535 15.02 0.0356
3 7.263 0.911 14.83 0.0614
4 10.752 1.046 14.63 0.0715
5 7.022 0.937 15.81 0.0593
6 208.566 0.383 13.63 0.0281
7 13.366 2.13 18.82 0.1131
7A 9.179 1.2 17.31 0.0693
Figure 3. Regression between natural logarithm of formation Factor, Fa versus natural
DOI: 10.4236/jwarp.2019.1111082 1419 Journal of Water Resource and Protection to a coefficient of correlation at 75.0% (percent) but we rest contented with the magnitude of precision since the transmissivity—resistivity factor correlation is “fit for purpose”.
The linearity of this graph was excellent with detailed resistivity data demon-strating power law relationships between field-based hydraulic parameters and micro-geometry based electrical parameters. By using numerical procedures de-scribed earlier, the study computed the cementation factor, m for the study area as m∅=1.1. However, the factor
α
in equation 19 must, therefore, remains negative in consistent with the positive slope observed in Equation (15), which depicts a negative eh conduction relation contrary to the bond shrinkage model envisaged by [31]. The low cementation exponent is generally indicative of clayey- contaminated fracture surface conduction characterized by cation exchange phenomena and/or fresh groundwater environment [33]. Rock fracturing, pre-ferred flow paths along fracture-fissures and subsequent weathering may en-hance contamination at these sites by alumino-silicates (clays and zeolites). Rapid rates of mineral dissolution are associated with areas where defects inter-sected the topography and vice-versa [34], causing modifications to pore throat aspects such as pore radii and pipe length (and hence porosity and permeability) variedly at different field sites [18]. Associated clay mineralization reduced the parameter z (hence low connectivity of pore volume networks) which obscures pore-volume electrolytic flow paths for continuous phase conductance, but fa-vors fluid-solid interface (surface) conductance. The calibrated numerical model with deterministic range of borehole-scale conductivities and micro-scale for-mation factors produced an approxifor-mation of equivalent parameters at a higher scale. Geo-electric models of ∅, T, and K at each VES location are shown (Table 3). Apparently, at the scale of well-test (Table 1), K values observed are at least several orders of magnitude higher than the model values (Table 3), re-flecting scaling effects. As [23] suggest, influences on small-scale measurements such VES, could probably emerge depended on the occurrence of sub-vertical artifacts (heterogeneity) and bias.DOI: 10.4236/jwarp.2019.1111082 1420 Journal of Water Resource and Protection
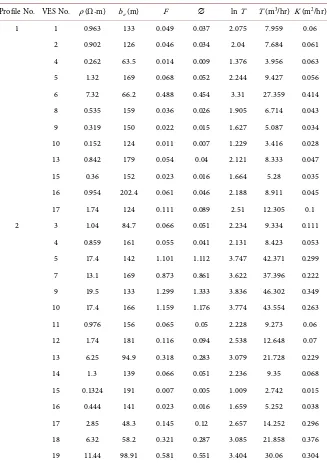
Table 3. Calculated porosity ∅, transmissivity T, and hydraulic conductivity K values
based on aquifer resistivity, ρ(Ω-m), and Aquifer layer thickness, be (m) along two E-W
profile lines in the eastern part.
Profile No. VES No. ρ(Ω-m) be (m) F ∅ ln T T (m3/hr) K (m2/hr)
1 1 0.963 133 0.049 0.037 2.075 7.959 0.06
2 0.902 126 0.046 0.034 2.04 7.684 0.061 4 0.262 63.5 0.014 0.009 1.376 3.956 0.063 5 1.32 169 0.068 0.052 2.244 9.427 0.056 6 7.32 66.2 0.488 0.454 3.31 27.359 0.414 8 0.535 159 0.036 0.026 1.905 6.714 0.043 9 0.319 150 0.022 0.015 1.627 5.087 0.034 10 0.152 124 0.011 0.007 1.229 3.416 0.028 13 0.842 179 0.054 0.04 2.121 8.333 0.047 15 0.36 152 0.023 0.016 1.664 5.28 0.035 16 0.954 202.4 0.061 0.046 2.188 8.911 0.045 17 1.74 124 0.111 0.089 2.51 12.305 0.1 2 3 1.04 84.7 0.066 0.051 2.234 9.334 0.111
4 0.859 161 0.055 0.041 2.131 8.423 0.053 5 17.4 142 1.101 1.112 3.747 42.371 0.299 7 13.1 169 0.873 0.861 3.622 37.396 0.222 9 19.5 133 1.299 1.333 3.836 46.302 0.349 10 17.4 166 1.159 1.176 3.774 43.554 0.263 11 0.976 156 0.065 0.05 2.228 9.273 0.06 12 1.74 181 0.116 0.094 2.538 12.648 0.07 13 6.25 94.9 0.318 0.283 3.079 21.728 0.229 14 1.3 139 0.066 0.051 2.236 9.35 0.068 15 0.1324 191 0.007 0.005 1.009 2.742 0.015 16 0.444 141 0.023 0.016 1.659 5.252 0.038 17 2.85 48.3 0.145 0.12 2.657 14.252 0.296 18 6.32 58.2 0.321 0.287 3.085 21.858 0.376 19 11.44 98.91 0.581 0.551 3.404 30.06 0.304
(OH−) are absorbed by clays and the H+ increases acidity of pore waters.
The consequent overall negative pore surface charge electrochemically bind positive charged ions initially dissolved in pore waters to pore walls, thereby forming an electrical double layer, which in turn acts as a surface for elec-tro-migration of charges. By considering conductivity via the electrical double
layer as being dominant, and with the application of f (1 )
m
c F
c α − ∅
= =
∅ and
( )
2
k
m
k S
DOI: 10.4236/jwarp.2019.1111082 1421 Journal of Water Resource and Protection as pore network fluid conductivity, cf) and S2 in the denominator of the latter. The observation approves the inverse (1/F, K) correlation depicted in Figure 4.
A negative linear eh conductivity relation, therefore, arise which consequently implies a similar functional relation on a bi-log scale for this aquifer environ-ment. Although it sounds awkward by using only a few data points in the high normalized electrical conductivity region, we remain unaware of any cases of equal dominance of two non-zero conductance phases in eh conduction space, even in multiphase mixtures. Nevertheless, the apparent realization of this mod-el holds our hope that further works (with additional drill-sites) in the aquifer might 1) hold exactly or approximately true for Equation (15) or further approve the inverse (1/F, K) relation or 2) provide a relation that will further improve the model.
Meanwhile, at pore network scale, the Olbanita would be a case typical of low-salinity and/or clay-dominated aquifer that is characterized mainly by ca-tion-exchange (CEC) phenomenon. Studies by [35] and [36] demonstrated that cfαCEC. Under such scenarios, [15] urged that Archie-type and hence the
posi-tive eh conduction correlation is persistently restrained, setting forth a “less fa-miliar” “Archie’s freshwater-clay counterpart”.
Results of this study agree reasonably well with hydraulic studies conducted by [37] [38] [39] [40] to investigate relations between pore’s internal surface area for each unit mass (m2/g) and CEC for freshwater (low EC) aquifers. Their
[image:14.595.211.537.517.694.2]la-boratory samples were graded by grain size with a consequential finer grade in each successive sort. It was found that with each grain size reduction, electrical conductivity increased whereas K decreased. We also noticed that a transition from pore-volume to pore-surface conduction occurred after grain size decreased. In consistent with published literature, therefore, we concur that the finer the aquifer material, the greater the pore-surface area for electrical conduction through cation exchange (as in Equation (2)), and the higher the viscous drag for hydraulic flow (and consequent low K values) as depicted by Equation (6).
Figure 4. (1/F, K) correlation, (after [15]). Negative relationship indicates eh conduction
DOI: 10.4236/jwarp.2019.1111082 1422 Journal of Water Resource and Protection
4.3. Conclusions
Adjustments have been made to the micro-level theoretical relations Bernabé et al. (2010, 2011) enhanced their applicability to field scale scenarios. From the widely known cubic law that controls flow through rock fractures, we expanded existing stochastic models by accounting for fracture wall roughness as well as inertia effects due to turbulent fluid in both the partially clay-filled fractures and block matrix. Specifically, the study modeled theoretically an association between field T and pore-level F. The network-level fracture-matrix heterogeneity and pore-level connectivity were found to be related by a negative linear function,
stated as; ln
( )
ln H 2 1( ) 3 lnH
r we
T C F
l r
µ
−∝
∝
= −
, in which the intercept is chiefly
a contingent of intrinsic properties of the eh conduction space and fluid proper-ty, whereas the gradient is based on the bond shrinkage factor x (for 0 <x > 1) of Wong et al. (1984) whereas x is determined by the mean eh conductive hydraulic radii over fracture-pore surface interface. The negative slope implies a theoreti-cal inverse relationship between T and F as postulated in the pore-volume eh conduction case of Wong et al. (1984). By calibrating the modified model with transmissivity and formation resistivity data of the Olbanita aquifer, a positive linear relation of the theory, stated as lnT =0.537 ln
(
Fa)
+3.695, at R2 = 75.1%DOI: 10.4236/jwarp.2019.1111082 1423 Journal of Water Resource and Protection
Acknowledgements
This study was funded by the Kenya Government through the National Research Fund http://researchfund.go.ke/. The original manuscript was also reviewed by an anonymous reviewer. The datasets used and generated in this study are available upon request.
Conflicts of Interest
The authors declare no conflicts of interest regarding the publication of this pa-per.
References
[1] Yuan, L., Sun, H., et al. (2018) Temporal Scaling Analytical Method to Identify Multifractionality in Groundwater Head Fluctuations. Ground Water, 57, 485-491.
https://doi.org/10.1111/gwat.12831
[2] Habib, A., Sorensen, J.P. and Bloomfield, J.P. (2017) Temporal Scaling Phenomena in Ground-Water-Floodplain Systems Using Robust Detrended Fluctuation Analy-sis. Journal of Hydrology, 549, 715-730.
https://doi.org/10.1016/j.jhydrol.2017.04.034
[3] Koedel, U. (2018) International Conference on Novel Methods for Subsurface Cha-racterization and Monitoring: From Theory to Practice: NovCare 2017. Environ-mental Earth Sciences.https://doi.org/10.1007/s12665-018-7834-3
[4] McLachlan, P.J., Chambers, J.E., Uhlemann, S.S., et al. (2017) Geophysical Charac-terization of the Groundwater Surface Water Interface. Advances in Water Re-sources, 109, 302-319.https://doi.org/10.1016/j.advwatres.2017.09.016
[5] Medici, G., West, L.J. and Mountney, N.P. (2018) Characterization of a Fluvial Aquifer at a Range of Depths and Scales: The Triassic St Bees Sandstone Formation, Cumbria, UK. Hydrogeology Journal, 26, 565-591.
https://doi.org/10.1007/s10040-017-1676-z
[6] Paz, C., Alcalá, F.J., Carvalho, J.M. and Ribeiro, L. (2017) Current Uses of Ground Penetrating Radar in Groundwater-Dependent Ecosystems Research. Science of the Total Environment, 595, 868-885.https://doi.org/10.1016/j.scitotenv.2017.03.210
[7] Dubreuil-Boisclair, C., Gloaguen, E., Marcotte, D. and Giroux, B. (2011) Heteroge-neous Aquifer Characterization from Ground-Penetrating Radar Tomography and Borehole Hydrogeophysical Data Using Nonlinear Bayesian Simulations. Geophys-ics, 76, J13-J25.https://doi.org/10.1190/1.3571273
[8] Ren, S., Parsekian, A.D., Zhang, Y., et al. (2019) Hydraulic Conductivity Calibration of Logging NMR in a Granite Aquifer, Laramie Range, Wyoming. Groundwater, 57, 303-319.https://doi.org/10.1111/gwat.12798
[9] Niu, F.-J., Gao, Z.-Y., Lin, Z.-J., et al. (2019) Vegetation Influence on the Soil Hy-drological Regime in Permafrost Regions of the Qinghai-Tibet Plateau, China.
Geoderma, 354, Article ID: 113892.https://doi.org/10.1016/j.geoderma.2019.113892
[10] Grunewald, E. and Walsh, D. (2018) Recent Advancements and Applications of Logging and Surface Magnetic Resonance for Groundwater Investigations. 1st Aus-tralasian Exploration Geoscience Conference—Exploration Innovation Integration, Vol. 2018, 1.https://doi.org/10.1071/ASEG2018abW10_2H
DOI: 10.4236/jwarp.2019.1111082 1424 Journal of Water Resource and Protection https://doi.org/10.1093/gji/ggy036
[12] Bernabé, Y., Li, M. and Maineult, A. (2010) Permeability and Pore Connectivity: A New Model Based on Network Simulations. Journal Geophysical Research: Atmos-pheres, 115, 1-14.https://doi.org/10.1029/2010JB007444
[13] Bernabé, Y., Zamora, M., Li, M., et al. (2011) Pore Connectivity, Permeability, and Electrical Formation Factor: A New Model and Comparison to Experimental Data.
Journal Geophysical Research: Atmospheres, 116, 1-15.
https://doi.org/10.1029/2011JB008543
[14] Wang, P., Chen, H.L., Meng, X.H., et al. (2018) Uncertainty Quantification on the Macroscopic Properties of Heterogeneous Porous Media. Physical Review E, 98, Article ID: 033306.https://doi.org/10.1103/PhysRevE.98.033306
[15] Purviance, T.D. and Andricevic, R. (2000) On the Electrical-Hydraulic Conductivity Correlation in Aquifers. Water Resources Research, 36, 2905-2913.
https://doi.org/10.1029/2000WR900165
[16] Sosi, B. (2013) Hydraulic Characterization of the Kabatini Aquifer, Upper Lake Nakuru Basin, Kenya Rift, Using Geophysical and Pumping Test Data. Internation-al JournInternation-al Development and Sustainability, 2, 2093-2109.
[17] Dhakate, R. (2011) Hydrogeophysical Parameter Estimation for Aquifer Characte-risation in Hard Rock Environments: A Case Study from Jangaon Sub-Watershed, India. Journal of Oceanography and Marine Science, 2, 50-62.
[18] Spariharijaona, A., Eswaran, P., Joel, B., et al. (2019) Static Dissolution-Induced 3D Pore Network Modification and Its Impact on Critical Pore Attributes of Carbonate Rocks. Petroleum Exploration and Development, 46, 374-383.
https://doi.org/10.1016/S1876-3804(19)60017-0
[19] Li, M., Tang, Y.B., Bernabé, Y., et al. (2017) Percolation Connectivity, Pore Size, and Gas Apparent Permeability: Network Simulations and Comparison to Experimental Data. Journal of Geo-Physical Research: Solid Earth, 122, 4918-4930.
https://doi.org/10.1002/2016JB013710
[20] Telford, W.M., Telford, W.M., Geldart, L.P., et al. (1990) Applied Geophysics. Cambridge University Press, Cambridge.
https://doi.org/10.1017/CBO9781139167932
[21] Fetter, C. (1990) Applied Hydrogeology. 2nd Edition, CBS Publishers & Distribu-tors, New Delhi, 592.
[22] Medici, G., West, L.J., Chapman, P.J., et al. (2019) Prediction of Contaminant Transport in Fractured Carbonate Aquifer Types: A Case Study of the Permian Magnesian Limestone Group (NE England, UK). Environmental Science and Pollu-tion Research, 26, 24863-24884.https://doi.org/10.1007/s11356-019-05525-z
[23] Maréchal, J.C. and Dewandel, B. (2004) Use of Hydraulic Tests at Different Scales to Characterize Fracture Network Properties in the Weathered-Fractured Layer of a Hard Rock Aquifer. Water Resources Research, 40, W11508.
https://doi.org/10.1029/2004WR003137
[24] Colombier, M., Wadsworth, F.B., Gurioli, L., et al. (2017) The Evolution of Pore Connectivity in Volcanic Rocks. Earth and Planetary Science Letters, 462, 99-109.
https://doi.org/10.1016/j.epsl.2017.01.011
[25] Weijermars, R. and Khanal, A. (2019) Elementary Pore Network Models Based on Complex Analysis Methods (CAM): Fundamental Insights for Shale Field Devel-opment. Energies, 12, 1243.https://doi.org/10.3390/en12071243
DOI: 10.4236/jwarp.2019.1111082 1425 Journal of Water Resource and Protection https://doi.org/10.1111/j.1745-6584.2009.00673.x
[27] Ju, J.-F., Li, Q.-S., Xu, J.-L., et al. (2019) Self-Healing Effect of Water-Conducting Fractures Due to Water-Rock Interactions in Undermined Rock Strata and Its Me-chanisms. Bulletin of Engineering Geology and the Environment, 1-11.
https://doi.org/10.1007/s10064-019-01550-x
[28] Jiang, Z., Van-Dijke, M.I.J., Geiger, S., et al. (2017) Pore Network Extraction for Fractured Porous Media. Advances in Water Resources, 107, 280-289.
https://doi.org/10.1016/j.advwatres.2017.06.025
[29] Renshaw, C.E. and Dadakis, J.S. (2000) Measuring Fracture Apertures: A Compari-son of Methods. Geophysical Research Letters, 27, 289-292.
https://doi.org/10.1029/1999GL008384
[30] Bernabé, Y., Li, M., Tang, Y.B. and Brian, E. (2016) Pore Space Connectivity and the Transport Properties of Rocks. Oil & Gas Science and Technology, 71, 50.
https://doi.org/10.2516/ogst/2015037
[31] Wong, P., Koplik, J. and Tomanic, J.P. (1984) Conductivity and Permeability of Rocks.
Physical Review B, 30, 6606-6614. https://doi.org/10.1103/PhysRevB.30.6606
[32] Bernabé, Y. and Bruderer, C. (1998) Effect of the Variance of Pore Size Distribution on the Transport Properties of Heterogeneous Networks. Journal Geophysical Re-search: Atmospheres, 103, 513-526.https://doi.org/10.1029/97JB02486
[33] Salem, H.S. and Chilingarian, G.V. (1999) The Cementation Factor of Archie’s Eq-uation for Shaly Sandstone Reservoirs. Journal of Petroleum Science and Engineer-ing, 23, 83-93.https://doi.org/10.1016/S0920-4105(99)00009-1
[34] Hynek, S., Comas, X. and Brantley, S.L. (2017) The Effect of Fractures on Weather-ing of Igneous and Volcaniclastic Sedimentary Rocks in the Puerto Rican Tropical Rain Forest. Procedia Earth and Planetary Science, 17, 972-975.
https://doi.org/10.1016/j.proeps.2017.01.001
[35] Revil, A., Murugesu, M., Prasad, M., et al. (2017) Alteration of Volcanic Rocks: A New Non-Intrusive Indicator Based on Induced Polarization Measurements. Jour-nal of Volcanology and Geothermal Research, 341, 351-362.
https://doi.org/10.1016/j.jvolgeores.2017.06.016
[36] Ahmed, A.S., Revil, A., Byrdina, S., et al. (2018) 3D Electrical Conductivity Tomogra-phy of Volcanoes. Journal of Volcanology and Geothermal Research, 356, 243-263.
https://doi.org/10.1016/j.jvolgeores.2018.03.017
[37] Dai, S., Santamarina, J.C., Waite, W.F., et al. (2012) Hydrate Morphology: Physical Properties of Sands with Patchy Hydrate Saturation. Journal of Geophysical Re-search: Solid Earth, 117, B11205.https://doi.org/10.1029/2012JB009667
[38] Koch, K., Kemna, A., Irving, J. and Holliger, K. (2011) Impact of Changes in Grain Size and Pore Space on the Hydraulic Conductivity and Spectral Induced Polariza-tion Response of Sand. Hydrology and Earth System Sciences, 15, 1785-1794.
https://doi.org/10.5194/hess-15-1785-2011
[39] Schoen, J.H. (2011) Physical Properties of Rocks: A Workbook. Vol. 8, Elsevier, Amsterdam.

![Figure 4. (1/F, K) correlation, (after [15]). Negative relationship indicates eh conduction via pore-surface networks](https://thumb-us.123doks.com/thumbv2/123dok_us/8746415.388941/14.595.211.537.517.694/figure-correlation-negative-relationship-indicates-conduction-surface-networks.webp)
