Published Online May 2010 in SciRes.http://www.scirp.org/journal/jbise
Determination of isotretinoin in pharmaceutical formulations
by reversed-phase HPLC
Carla Aiolfi Guimarães1*, Farid Menaa2, Bouzid Menaa3*, Ivo Lebrun4, Joyce S. Quenca-Guillen1,
Aline Vivian Vatti Auada4, Lucildes P. Mercuri5, Paula Ferreira5, Maria Inês Rocha Miritello Santoro1
1Department of Pharmacy, Faculty of Pharmaceutical Sciences, University of São Paulo, São Paulo, Brazil; 2Department of Dermatology, School of Medicine, University of Wuerzburg, Wuerzburg, Germany; 3Fluorotronics, Inc., 1425 Russ. Bvld, San Diego Technology Incubator, San Diego, USA;
4Department of Biochemistry and Biophysics, Butantan Institute, São Paulo, Brazil;
5Department of Exact and Earth Sciences, Diadema, Federal University of São Paulo, São Paulo, Brazil. Email: carlaaiolfi@usp.br; bouzid.menaa@gmail.com
Received 4 February 2010; revised 1 March 2010; accepted 2 March 2010.
ABSTRACT
The development of facile and rapid quantification of biologically active biomolecules such as isotretitoin in therapeutic drugs contained in many generic formu- lations is necessary for determining their efficiency and their quality to improve the human health care. Isotretritoin finds its applications in the maintenance of epithelial tissues. Different processes to date such as normal phase HPLC, or gas chromatrography am- ong others are able to separate and quantify isote- troin. However, the extraction is quite complex and in the case of HPLC, the analysis requires long reten-tion times. In such context, an isocratic reversed- phase high-performance liquid chromatography (HP- LC) technique coupled with an UV-vis detector is described here for easy separation and quantification of 13-cis-retinoic (isotretinoin) from soft gelatin cap-sule formulations. The isotretinoin was extracted from three different commercial drug samples with tetrahydrofuran (THF) solvent by a procedure that can be completed in less than 10 minutes. Subsequent separation and quantification were accomplished in less than 5 minutes under isocratic reversed-phase conditions on a Lichrospher RP18 column and a mo-bile phase consisting of 0.01% TFA/acetonitrile (15/85, v/v) at a flow rate of 1.0 mL/min. Isotretoin was detected for the three samples via its UV-vis ab-sorbance at 342 nm. The method was validated and the results showed good linearity, precision and ac-curacy for sensitive and selective quantitative deter-mination of isotretinoin in the different pharmaceu-tical formulations. We found that the average isot-retinoin content in two of the three commercial pro- ducts fell outside the 90-110% United States Pha- rmacopeia specifications. Consequently, the facile extraction and the precise method for the biomole-
cule quantification open up tremendous possibilities in improving the quality control of drugs which can exist as different generic brands.
Keywords: 13-Cis Retinoic Acid; Reversed-Phase Chromatography; Isotretitoin Extraction; Isotretinoin Quantification; Pharmaceuticals Formulation
1. INTRODUCTION
Retinoic acid is a very potent biomolecule in promoting growth and controlling differentiation and maintenance of epithelial tissue for vitamin A deficient animals. In-deed, all-trans-retinoic acid (tretinoin) appears to be ac- tive form of vitamin A in all tissues except the retina, and it is 10-100-fold more potent than retinol in various systems in vitro. Isomerization of this compound in the body yields to 13-cis-retinoic acid (isotretinoin), which is nearly as potent as tretinoin in many of its actions on epithelial tissues. Vitamin A and other retinoids have found wide applications in the treatment of skin disor-ders and may find important roles in cancer chemopre-vention and therapy [1].
One of the most clinically useful vitamin A derivatives is 13-cis-retinoic acid (isotretinoin). It was approved in 1982 to treat severe recalcitrant nodular acne and re-mains the drug of choice for this therapeutic treatment. Isotretinoin is the only treatment that affects all the ma-jor factors involved in the pathogenesis of acne. Its ex-hibits several activities, in particular a capacity to de-crease sebaceous gland activity, to correct the keratinisa-tion defect in acne and to reduce the populakeratinisa-tion of the bacterium Propionibacterium acnes [2].
limitations upon formulation options. For instance, the degradation of isotretinoin (in its solid state) in the presence of air is an autocatalytic process that proceeds rapidly and a simple dry powder formulation would not have a sufficient shelf-life. A suspension in oil is more stable [2]. Suspension in oil also minimizes chemical degradation, as lipid preparations, especially those with a low peroxide number, have been shown to enhance stability [3]. Owing to the photolability and sensitivity to heat and oxidation of the retinoids, their quantitative determination in pharmaceutical is particularly important for the quality control of finished products and for sta-bility-indicating assays [1].
Indeed, for all pharmaceutical agents, one of the most important therapeutic determinants is the amount of drug the patient is exposed to. Previous studies comparing the quality of a variety of generic with innovator products have revealed important deficiencies in the amount of active ingredient among generics [4,5]. Isotretinoin and its trans-isomer, tretinoine, are known to be teratogens that can cause fetal malformations during pregnancy for intance [6,7]. It is possible for a patient to be treated with a different isotretinoin-based generic products dur-ing a course of therapy because of an assumption that ‘generic isotretinoins’ are essentially identical and bio-equivalent to the innovator product. Under these circum-stances, the pharmaceutical quality and consistency among products become of paramount importance [2].
A number of previous methods for determination of isotretinoin have been described in the literature. The analytical method generally employed in the United State Pharmacopoeia (USP) is a normal phase HPLC system [8]. Isotretinoin has also been determined by gas chromatography in soft and hard capsules formulations [9]. A reversed phase HPLC method with fluorescence detection has been described [1] for the determination of retinoids in pharmaceutical dosage forms. Simultaneous determination of tretinoin and isotretinoin in derma-tological formulations has been also reported via normal phase HPLC [10]. HPLC [1], Microcalorimetry [11], UV radiation monitor [12], thin layer chromatography (TLC) and preparative layer chromatography (PLC) [13], cap-illary zone electrophoresis (CZE) and micellar elec-trokinetic capillary chromatography (ME-KC) [14] have been also employed to study retinoid degradation prod-ucts in commercial preparation and raw materials.
Although the above methods are able to separate and quantify isotretinoin, the extraction procedure is quite complex and HPLC analysis involves long retention times [10]. In that context, the aim of this study was to develop a rapid method using an isocratic high perform-ance liquid chromatography (HPLC) coupled to UV-vis detector to determine and quantify the isotretinoin in soft capsule formulations from three commercial samples. The validation method with its precision and accuracy was checked and the isotretinoin quantification was
car-ried out for three commercial products for which the content of the biomolecule was compared to the United States Pharmacopeia specifications.
2. MATERIALS AND METHODS
2.1. Chemicals and Reagents
The content of isotretinoin was determined from the concentrations of standard solutions. The standards for 13-cis-retinoic acid were from United States Pharm- copeia reference standard (USP:RS). The three commer-cial products were purchased from two different phar-maceutical companies (their names have been omitted for commercial reasons) named as Branded Original Product A (Product A), Generic Product B (Product B) and Generic Product C (Product C). All three commer-cial soft-gel capsules contained 20 mg of isotretinoin. Acetonitrile, trifluoroacetic acid (TFA), tetrahydrofuran (THF) were HPLC grade and purchased from Merck (USA).
2.2. Laboratory Precaution
All experiments were performed using amber glass volu- metric flasks under yellow light conditions to avoid degradation of isotretinoin.
2.3. HPLC Instrumentation and Conditions
The HPLC system consisting of Agilent model 1100 (Agilent, USA) connected to a UV/Visible absorbance detector (agilent) was used for all separation. Chroma- tographic separations were performed using reversed- phase chromatographic using a HPLC column [Lichro-spher RP18 (5 µm, 125 × 4 mm i.d., Merck, USA)]. Isotretinoin was detected by the UV-vis absorbance at 342 nm [8] with the sensitivity set at 0.1 aborbance unit full scale (Aufs).
The mobile phase used was composed of 0.01% tri- fluoroacetic acid and acetonitrile (15/85, v/v) at a flow rate of 1.0 mL/min. The injection volume was 20 µL and the column was maintained at 40ºC.
2.4. Standard Preparation Procedures
Stock solutions were prepared by dissolving the appro- priate amounts of isotretinoin in acetonitrile. A set of working standard solutions was produced by diluting aliquots of the stock solutions to give the desired con-centrations of the analytes. For the method linearity as-sessment, the concentration range was 5.0 to 30.0 µg/mL (the concentrations were determined using the calibr- ation graphs. The standard solutions were stable for at least 3 days at 4ºC).
2.5. Extraction of Soft-Gel Capsules Formulations
ex-Copyright © 2010 SciRes. tracted directly with THF solvent. The solution contai-
ning isotretinoin was shaked for 5 min. 1 mL of aliquot for the resulting solution was diluted in acetonitrile to obtain the final solution concentration (20 µg/mL) that was analyzed by HPLC in comparison with the appro- priate standard solution.
2.6. Quantification of Isotretinoin
A standard curve was constructed by injecting samples containing isotretinoin standard at concentrations rang-ing from 5.0 to 30.0 µg/mL. The peak area was deter- mined and plotted versus the concentration of isotre- tinoin. For the recovery studies, known volumes of iso- tretinoin standard solutions were analyzed, and the absolute recovery was calculated by comparing the peak area obtained from isotretinoin in the commercial cap- sule with the peak area of samples derived from the standard solutions.
JBiSE
3. RESULTS AND DISCUSSION
The objective of this work was to develop a rapid me-
thod using an isocratic high performance liquid chro- matography (HPLC) system to determine quantitatively the isotretinoin in hard gelatin capsule formulations. In order to validate an efficient method for analysis of drugs in pharmaceutical formulations, preliminary tests were performed with the objective to select adequate and optimum conditions. Parameters such as detection wave- length, ideal mobile phase and their proportions, con- centration of the standard solutions, and flow rate were exhaustively tested and the quantitative determination of isotretoin in the gel capsules was made possible under the ideal conditions described in this paper. The pro-posed method is simple and do not involve laborious time-consuming sample preparation.
3.1. Chromatography
The conditions for a rapid and simple HPLC separation with UV detection were developed using an isocratic elu-tion with a mobile phase composed of 0.01% trifluo- roacetic acid and acetonitrile (15/85, v/v). These condi-tions gave well resolved sharp peaks (Figure 1) for
(a)
Absorbance (mA
U
)
(b)
(c)
(d)
[image:3.595.149.432.335.658.2]Elution time (min)
The precision of proposed method was evaluated thro- ugh intra-day repeatability of responses after replicate (n = 10) injection of sample solutions (20.0 µg/mL). The precision is expressed as the relative standard deviation (RSD) amongst responses. The standard deviation the isotretinoin commercial formulations but also for the isotretinoin standards. The retention time was of ap-proximately 3.8 min. The shorter elution time makes the method especially useful for routine analysis of isotreti-noin in pharmaceutical formulations. The validation ex-periments as described in the following section were completed to determine if the method could achieve the reproducibility and accuracy required for analysis of formulations.
3.2. Method Validation
3.2.1. Method Validation
[image:4.595.311.539.372.429.2]The quantification of the chromatogram was performed using the peak area of isotretinoin standards for known content of isotretinoin and as references for the determi-nation of the content for the commercial samples to which we determined the peak areas of their respective chro-matograms. Five standard solutions ranging from 5.0 to 30.0 µg/mL in concentration (three replicates each), were injected into the HPLC system. The calibration graph was obtained by plotting the peak areas of the standard solutions against the theoretical standard con- centrations. The linearity was evaluated by linear least- squares regression analysis. The correlation coefficient obtain with linear regression of curve was 0.997. Statis- tical analysis indicated excellent linearity as shown in Table 1.
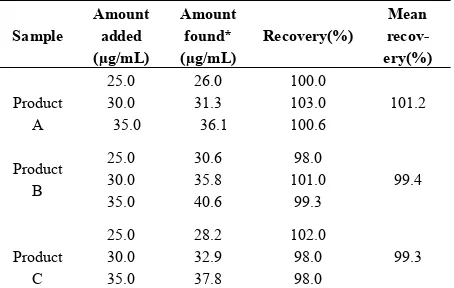
3.2.2. Accuracy
To evaluate the accuracy of the proposed method, re-covery tests were carried out with all samples. The measurements were performed by adding known amo- unts of standard solutions to sample followed by analysis using the proposed method. The recovery values ob-tained were 101.2, 99.4 and 99.3% (why don’t you have 100%) for the three soft gelatin capsule formulations, confirming the accuracy of the proposed method. The percentage of recovery results are presented in Table 1. 3.2.3. Precision
amongst replicate responses and relative standard devia-tion values (RSD) were less than 1.0%, indicating preci-sion of the method. The statistical data results obtained
in the analysis of commercially available samples are shown in Table 2.
According to the results obtained only one formula-tion (Product A (branded named)), was found to be good agreement with the claimed content of the drugs. Indeed, the average percentage of isotretinoin content (Table 3) for the Product A was evaluated to 105 ± 0.05% which fits with United States Pharmacopeia (USP) specifica- tions. In contrast, the content for the generic products formulations Products (Product B and Product C), fell outside the United States Pharmacopeia (USP) specifica- tions. The content percentage of isotretinoin was found to be 128.5 ± 0.08 and 115.5 ± 0.04 in Product B and Product C, respectively. The USP XXX [8] monograph for isotretinoin capsules states that the capsules must contain not less than 90.0% and not more than 110% of the labeled amounts of isotretinoin. The results and the accuracy of the method shows that it is necessary to con-trol the content of the active biomolecule for drug safety, but also that the precision of the method and rapid acqui-sition of the data can be a plus for pharmaceutical indus-tries for the quality control of their products.
Table 1. Statistical results of linear regression analysis in the determination of isotretinoin by proposed method.
Statistical parametrs Results
Intercept of curve (b) –328.09
Slope of curve (a) 138.86
[image:4.595.312.539.467.611.2]Linear correlation coefficient (r) 0.997
Table 2. Recovery data of standard solutions added to the samples analyzed by using the proposed HPLC method.
Sample
Amount added (µg/mL)
Amount found* (µg/mL)
Recovery(%)
Mean recov-ery(%)
Product A
25.0 30.0 35.0
26.0 31.3 36.1
100.0 103.0 100.6
101.2
Product B
25.0 30.0 35.0
30.6 35.8 40.6
98.0 101.0
99.3
99.4
Product C
25.0 30.0 35.0
28.2 32.9 37.8
102.0 98.0 98.0
99.3
[image:4.595.56.538.652.712.2]*Avarage of three determination
Table 3. Statistical data obtained in the analysis of samples using the proposed method.
Sample concentration (µg/mL)Declared theoretical concentration (µg/mL)Found experimental Content (%) RSD (*) (%) Confidence interval (**) Content (%)
Product A 20.0 21.0 105.0 0.43 105.0 ± 0.05
Product B 20.0 25.7 128.5 0.70 128.5 ± 0.08
Product C 20.0 23.1 115.5 0.30 115.5 ± 0.04
Copyright © 2010 SciRes. JBiSE
4. CONCLUSIONS
The proposed HPLC methods for quantitative determi- nation showed good linearity, precision and accuracy for sensitive and selective quantitative determination of iso- tretinoin in pharmaceutical formulations. This method is not time-consuming and is easy to perform in any labo-ratory. We ultimately show, according the United States Pharmacopeia specifications that the average amount of isotretinoin in 2 of the 3 commercial products ranged outside the 90-110%. Safe use of isotretinoin, particu-larly with respect to teratogenicity, remains a central issue for therapeutics development. Therefore, it is im-portant, that future research determines a comparative study with pharmaceutical quality of isotretinoin prod-ucts on patient exposure to isotretinoin by comparative bioequivalence tests.
5. ACKNOWLEDGEMENTS
The authors acknowledge the CNPq (National Counsel of Techno- logical and Scientific Development) CAPES (Foundation to Higher Level People Improvement) and FAPESP (Research Support Founda-tion in the State of São Paulo) for the financial support.
REFERENCES
[1] Gatti, R., Gioia, M.G. and Cavrini, V. (2000) Analysis and stability study of retinoids in pharmaceuticals by fluorescence. Journal of Pharmaceutical and Biomedical Analysis, 23(1), 147-159.
[2] Taylor, P.W. and Keenan, M.H.J. (2006) Pharmaceutical quality of generic isotretinoin products, compared with Roaccutane. Current Medical Research and Opinion,
22(3), 603-615.
[3] Ioele, G., Cione, E., Risoli, A., Genchi G. and Ragno, G. (2005) Accelerated photostability study of tretinoin and isotretinoinin liposomes formulations.International Jour- nal of Pharmaceutics, 60(1-2), 251-260.
[4] Wetterich, U. and Mutschler, E. (1995) Quality of cefo-taxine sodium preparations. Arzneimittel-Forschung Drug
Research, 45(1), 74-80.
[5] Lambert, P.A. and Conway, B.R. (2003) Pharmaceutical quality of ceftriaxone generic products compared with Rocephin. Journal Chemotherapy, 15(4), 357-368. [6] Lammer, E.J., Chen, D.T., Hoar, R.M., Agnish, N.D.,
Benke, P.J. and Braun, J.T. (1985) Retinoic acid em- bryopathy. New England Journal of Medicine, 313(14), 837-841.
[7] Willhite, C.C., Wier, P.J. and Berry, D.L. (1989) Dose response and structure-activity considerations in retinoid- induced dysmor phogênesis. Critical Reviews in Toxicology, 20(2), 689-695.
[8] (2007) United States pharmacopeia. XXX, Pharma- copeia Convention, Maryland, 2428-2429.
[9] Lima, E.M., Diniz, D.G. and Antoniosi-Filho, N.R. (2005) Development of a gas chromatography method for the determination of isotretinoin and its degradation products in pharmaceuticals. Journal of Pharmaceutical of Bio- medical Analysis, 38(4), 678-685.
[10] Tashtoush, M.B. Jacobson, E.L. and Jacobson, M.K. (2007)A rapid HPLC method for simultaneous deter- mination of tretinoin and isotretinoin in dermatological formulations. Journal of Pharmaceutical and Biomedical Analysis, 43(3), 859-864.
[11] Tan, X., Meltzer, N. and Lindenbaum, S. (1992) Solid- state stability studies of 13-cis-retinoic acid and all- transretinoic acid using microcalorimetry and HPLC analysis. Pharmaceutical Research, 9(9), 1203-1208. [12] Allwood, M.C. and Plane, J.H. (1984) The degradation of
vitamin A exposed to ultraviolet radiation. International Journal of Pharmaceutics, 19(2), 207-213.
[13] Crank, G. and Pardijanto, M.S. (1995) Photooxidations and photosensitized oxidations of vitamin A and its palmitate ester.Journal of Photochemistry and Photobio- logy A: Chemistry, 85(1-2), 93-100.