The interplay between tissue growth and scaffold degradation
in engineered tissue constructs.
R. D. O’Dea1+∗, J. M. Osborne2+, A.J. El Haj3, H. M. Byrne2,4& S. L. Waters5 1
School of Science and Technology, Nottingham Trent University Clifton Campus, Nottingham, NG11 8NS, UK
2
Department of Computer Science, University of Oxford, Wolfson Building, Parks Road, Oxford, OX1 3QD, UK 3Institute for Science & Technology in Medicine, Keele University,
Guy Hilton Research Centre, Stoke-on-Trent ST4 7QB, UK 4Oxford Centre for Collaborative Applied Mathematics, Mathematical Institute, Gibson Building, Oxford, OX2 6HA, UK
5
Oxford Centre for Industrial and Applied Mathematics, Mathematical Institute, 24-29 St Giles’, Oxford, OX1 3LB, UK
+
Joint first authors
Abstract
In vitro tissue engineering is emerging as a potential tool to meet the high demand for replacement tissue, caused by the increased incidence of tissue degeneration and damage. A key challenge in this field is ensuring that the mechanical properties of the engineered tissue are appropriate for the in vivo environment. Achieving this goal will require detailed understanding of the interplay between cell proliferation, extracellular matrix (ECM) deposition and scaffold degradation.
In this paper, we use a mathematical model (based upon a multiphase continuum frame-work) to investigate the interplay between tissue growth and scaffold degradation during tissue construct evolution in vitro. Our model accommodates a cell population and culture medium, modelled as viscous fluids, together with a porous scaffold and ECM deposited by the cells, represented as rigid porous materials. We focus on tissue growth within a perfusion bioreactor system, and investigate how the predicted tissue composition is altered under the influence of (i) differential interactions between cells and the supporting scaffold and their associated ECM, (ii) scaffold degradation, and (iii) mechanotransduction-regulated cell proliferation and ECM deposition.
Numerical simulation of the model equations reveals that scaffold heterogeneity typical of that obtained fromµCT scans of tissue engineering scaffolds can lead to significant variation in the flow-induced mechanical stimuli experienced by cells seeded in the scaffold. This leads to strong heterogeneity in the deposition of ECM. Furthermore, preferential adherence of cells to the ECM in favour of the artificial scaffold appears to have no significant influence on the eventual construct composition; adherence of cells to these supporting structures does, how-ever, lead to cell and ECM distributions which mimic and exaggerate the heterogeneity of the underlying scaffold. Such phenomena have important ramifications for the mechanical integrity of engineered tissue constructs and their suitability for implantation in vivo.
1
Introduction
Mathematical modelling of tissue growth is a wide field of research, aiming to provide a more complete understanding of the myriad biological and biophysical processes that contribute to tissue growth. Such theoretical models underpin the emerging field of in vitro tissue engineering, which, by the creation of replacement tissue in the laboratory, has the potential to alleviate the shortage of replacement tissue available for implantation into patients. A typical method for generating such implants entails seeding a biodegradable porous scaffold with cells; subsequent incubation in a bioreactor allows the cells to colonise the porous scaffold (termed a tissue construct). On implantation, the degrading scaffold is replaced by extracellular materials such as collagen and proteoglycans, which are laid down by the cells (Freed et al., 1994). Ensuring that the rates of nascent tissue growth and scaffold degradation (e.g. due to hydrolysis) are appropriately matched is therefore crucial in maintaining the mechanical integrity of the construct, a factor of especial importance for load-bearing constructs, such as bone implants (L. and Ding, 2004). The biological processes which contribute to tissue construct growth operate on disparate spatio-temporal scales and range from intracellular gene networks to tissue-level mechanics; reviews are given by Curtis and Riehle (2001), Cowin (2000, 2004), Sipe (2002) and Burdick and Mauck (2010). In this paper, we concentrate on a tissue-scale description of tissue growth, and employ a continuum model to focus on the way in which the properties of the supporting scaffold influence the structure of the resulting tissue construct.
In addition to the scaffold’s mechanical properties, its chemical features are of great importance. For example, most cell types are anchorage-dependent, their growth being affected by interactions between a substrate or deposited extracellular matrix (ECM); the surface chemistry of the scaffold crucially affects such interactions. Adherence to polymer scaffolds commonly employed in tissue engineering applications is mediated by adsorption of deposited ECM molecules onto the scaffold surface or by, for instance, artificially embedded cell recognition molecules (Freed and Vunjak-Novakovic, 1998; Nikolovski and Mooney, 2000). The type and density of such molecules may vary dramatically throughout the scaffold due to, e.g., inhomogeneous ECM deposition, leading to spatial variations in cell adhesion characteristics, or preferential adherence to ECM or other deposited materials over artificial scaffolds.
is specific to the tissue under consideration; bespoke bioreactors are therefore required to provide appropriate cues for different tissue engineering applications. Well-studied examples include os-teocytes (terminally-differentiated bone cells), which are known to be sensitive to fluid shear stress (Bakker et al., 2004b); and chondrocytes, whose metabolism and maintenance of ECM integrity are regulated by mechanical stress (Urban, 1994; Wang et al., 2010). Indeed, in El Haj et al. (1990) attention focussed on the influence of such mechanical stimulation on bone tissue growth.
0000000000000 0000000000000 0000000000000 0000000000000
1111111111111 1111111111111 1111111111111 1111111111111
Cell seeded scaffold
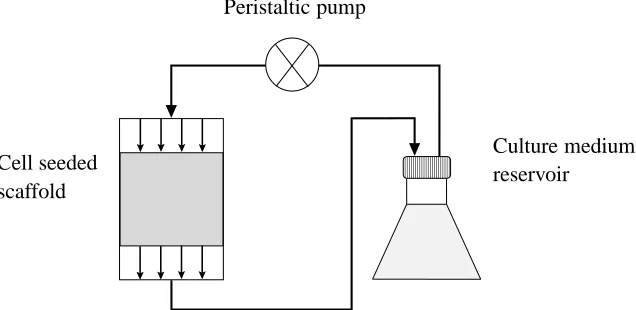
[image:3.612.135.453.131.286.2]Culture medium reservoir Peristaltic pump
Figure 1: Layout of the bioreactor system of El Haj et al. (1990).
In what follows, we employ a mathematical model relevant to perfusion bioreactor systems in which cells are cultivated within a porous scaffold. Our formulation accommodates the cells’ pro-gression from a proliferative to an apoptotic phenotype, via an ECM depositing phase, in response to changes in the local cell volume fraction (a methodology for accomodating mechanotransduction-mediated cell proliferation in response to a range of mechanical stimuli is given in O’Dea et al. (2008, 2010) and Osborne et al. (2010)), as well as considering in detail the interactions between the cells and their supporting structures.
A variety of approaches has been employed to model tissue growth, their respective benefits de-pending on the specific application under consideration. Here, we study an extension to a recently-developed continuum model (O’Dea et al., 2010) in which we consider the evolution of the spa-tial distribution of PLLA scaffold and ECM density. We employ a multiphase formulation which enables us to incorporate interactions between the many constituent materials which comprise bi-ological tissue; we model explicitly cell-cell and cell-scaffold/ECM interactions as well as mass transfer between phases (representing cell proliferation, ECM deposition and scaffold degradation). Such multiphase approaches have been widely employed in industrial applied mathematics (Drew and Segel, 1971) and, more recently, modelling of tumour growth and in vitro tissue engineering processes; examples include Breward et al. (2002), Byrne and Preziosi (2003), Franks and King (2003), Araujo and McElwain (2005), Lemon et al. (2006), Lemon and King (2007), Wilson et al. (2007), O’Dea et al. (2008, 2010), Osborne et al. (2010), and references therein. Reviews are given by, e.g., Preziosi and Tosin (2009) and O’Dea et al. (2012).
con-structs were investigated: (i) cell-cell and cell-scaffold interactions and, (ii) mechanotransduction mechanisms. The formulation was simplified via the long-wavelength limit (in which the biore-actor’s aspect ratio is assumed to be small) and by considering constant, spatially-homogeneous scaffold porosity. Numerical simulation of the model equations (validated by analytic solutions obtained in the limit of asymptotically-small cell volume fraction), revealed that inclusion of cell-cell and cell-cell-scaffold interactions leads to significant differences in the extent to which the cell-cell population colonises the scaffold, depending upon the relative importance of cell aggregation and repulsion. It was further shown that the composition of the resulting construct was strongly influ-enced by whether cell proliferation and ECM deposition were regulated by mechanical stimulation related to the cell population density, pressure or shear stress. Employing two-dimensional finite element simulations, Osborne et al. (2010) demonstrated that, when considering total tissue yield, the long-wavelength limit of O’Dea et al. (2010) provides an excellent approximation to the full two-dimensional model, even for relatively large values of bioreactor aspect ratio. However, this work further demonstrated that mechanotransduction-mediated tissue growth can lead to significant two-dimensional spatial variation of tissue density, a feature which is not captured by the long-wavelength limit. The authors concluded that, while spatial effects in two- or three-dimensions cannot be ignored in comprehensive models of tissue growth, its relative simplicity makes the long-wavelength model a natural framework with which to estimate parameters relevant to specific biore-actor systems, for subsequent use in more complex two- or three-dimensional models.
θs
x
(a) (b)
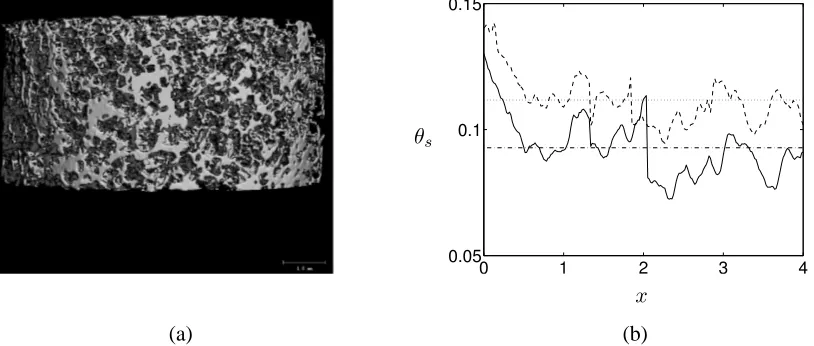
Figure 2: (a) A typical cylindrical PLLA scaffold employed in the bioreactor system of El Haj et al. (1990). The scale bar indicates 1mm; dimensions are: 9mm (diameter), 4mm (height). (b) Typical variation in the cross section-averaged scaffold density (represented by the scaffold volume fraction,
θs) before and after culture, observed experimentally in such a scaffold. The initial scaffold density
is represented by “—” (with average “·-·-·”) and the final scaffold by “- -” (with average “· · ·”).
stiffness and mean pore size. Byrne et al. (2007) considered the influence of scaffold porosity and degradation rate on in vitro bone tissue growth; mechanotransduction-regulated differentiation of stem cells to fibroblasts, chondrocytes and osteoblasts was also accommodated, each phenotype displaying different migration and material properties. A random walk model for cell movement within a poroelastic scaffold (whose deformation was simulated via a finite element method) was used to compute the tissue composition. The study concluded that under low load, high porosity and stiffness, together with an intermediate scaffold degradation rate, stimulate increased bone tis-sue generation; to prevent collapse of the scaffold under high load, a reduced degradation rate is required.
Due to the nature of the problems investigated (three-dimensional scaffolds with specific pore geometry, deformation, flow, scaffold material properties), many of the studies mentioned above give rise to complex systems of coupled PDEs, which are heavily reliant on numerical investiga-tion. In this study, we demonstrate that considerations relevant to biological tissue growth may be accommodated within a continuum model, amenable to asymptotic simplification; we extend our earlier work (O’Dea et al., 2010) by relaxing the assumption of constant, homogeneous scaffold porosity, and employ the resulting model to investigate the interplay between scaffold degradation and nascent tissue growth in a perfusion bioreactor. Our model incorporates a cell population and culture medium, each represented as a viscous fluid, as well as both a PLLA scaffold and ECM deposited by the cells, modelled as rigid porous phases. This approach allows spatio-temporal vari-ations in cell-scaffold and cell-ECM interactions, realistic scaffold porosity distributions (informed by experimental data), scaffold degradation, and mechanotransduction-regulated cell proliferation and ECM deposition to be accommodated.
[image:5.612.84.491.37.210.2]deposi-tion. Further, our model suggests that preferential adherence to ECM in favour of the PLLA scaffold has no significant influence on the eventual construct composition; we therefore conclude that such additional mathematical complexity is unnecessary, so that simplified models, in which cells interact uniformly with their supporting structures, may be employed to describe biological tissue growth. Lastly, we indicate that careful manipulation of the rate of PLLA scaffold degradation is required in order to maintain the mechanical integrity of constructs.
The remainder of the paper is organised as follows. In§2, the multiphase model of O’Dea et al. (2010) is summarised, and extended by the addition of spatial and temporal variation in scaffold and ECM volume fractions, and the resulting governing equations and boundary conditions are stated (a detailed derivation is provided in the Appendix). In §3, numerical simulations of the model equations are presented and the importance of scaffold degradation, ECM deposition and heterogeneity in scaffold porosity on construct composition is investigated. §4 provides a summary of the results contained in the preceding sections and a discussion of their implications for in vitro tissue engineering, together with suggestions for future avenues of investigation.
2
Model formulation
In this section, we present a multiphase model which describes the growth of a tissue construct within a nutrient-rich perfusion bioreactor. The bioreactor under consideration is illustrated in Fig-ure 1 and comprises a cell-seeded porous scaffold within a cultFig-ure medium-filled cylinder, through which a flow is driven (see El Haj et al. (1990) and O’Dea et al. (2010) for details). The key mod-elling assumptions are summarised below and the resulting equations, together with appropriate boundary and initial conditions, are stated. The derivation of these equations is summarised in the Appendix for completeness; the interested reader is directed to O’Dea et al. (2010) and references therein for a detailed discussion of the modelling considerations embodied by these equations when variations in scaffold and ECM volume fractions are neglected.
For simplicity, we view the perfusion bioreactor as a two-dimensional channel (we expect re-sults for an axisymmetric cylinder to be qualitatively similar) containing a mixture of four inter-acting phases. The cell population and culture medium are modelled as distinct viscous fluids, and rigid porous phases represent the PLLA scaffold and the ECM. The interplay between cell prolifer-ation, ECM deposition and scaffold degradation is captured by mass exchange between the relevant phases, effected by the specification of mass transfer functions which account for the influence of mechanotransduction on cell proliferation and ECM deposition.
The mechanical interactions between phases comprise interphase viscous drag (proportional to differences in phase velocity) and active forces. The latter enter the governing equations via prescribed contributions to the cell phase pressure, arising due to cell-cell interactions and traction between the cell and scaffold or ECM phases, respectively. Interactions between the culture medium and scaffold/ECM phases are assumed to involve only viscous drag.
incon-sistent with this simplifying limit; however, our previous work (Osborne et al., 2010) indicates that such a limit provides an excellent approximation to the full two-dimensional model. We employ this limit in preference to an a priori assumption of one-dimensional flow for consistency with our previous work, and for wider applicability to other bioreactor systems.
2.1 Dimensionless model equations and boundary conditions
We consider a 2D Cartesian coordinate system x = (x, y), in which the bioreactor is assumed to
occupy the dimensionless region06x61,06y 6h≪1, and within which the PLLA scaffold phase is localised in the regiona6x 6b(where0 < a < b <1, anda, b−a,1−b ≫h). We assume that all dependent variables are functions ofxand dimensionless time,t.
The volume fractions of the cell, culture medium, PLLA scaffold and ECM phases are denoted byθn, θw, θsandθe, respectively; and the substrate phaseΘis defined by
Θ =θs+θe. (1)
The dimensionless velocities and pressures of the cell and culture medium phases are denoted
ui = (ui, vi)andpi(i=n, w). The rigidity of the PLLA scaffold and ECM impliesus=ue= 0;
the solid phase pressuresps,pe are not required in this analysis and remain undetermined. Tissue
growth, scaffold degradation and ECM deposition are captured via material transfer functions Si
which we specify below. The governing equations are stated below in dimensionless form.
The model is constructed by considering mass and momentum balances for each phase, assum-ing that the fluid phases are incompressible with equal density, and by neglectassum-ing inertial effects (details of the model derivation and nondimensionalisation are provided in the Appendix). Assum-ing that the bioreactor aspect ratio is asymptotically small, and employAssum-ing the momentum balance equations, together with the no-voids condition, Piθi = 1, it is straightforward to show that the
flow is unidirectional and that the pressure and volume fraction of each phase are functions of x
andt. By eliminating dependent variables, the system may be reduced to the following differential equations forθs,θe,θnandpw:
∂θs
∂t =Ss, (2)
∂θe
∂t =Se, (3)
∂θn
∂t +
1 12
∂ ∂x
(1−θs−θe−θn)
∂pw
∂x
=Sn, (4)
∂ ∂x
(θn+µn(1−θs−θe−θn))
∂pw
∂x
+ ∂
∂x
∂(θ2 nΣ)
∂x + 2θnψ
∂(θe+θs)
∂x +θn(θe+θs)
∂ψ ∂x
= 0, (5)
in whichµn is the relative viscosity of the cell and culture medium phases, andΣandψ capture
active forces that exist between adjacent cells, and between cells and the substrate. We note that appropriate choice of the interaction functionsΣandψ, and mass transfer termsSi, ensures that the
volume fractions obeyθi∈[0,1](see e.g. Preziosi and Tosin (2009) for more details).
Equations (2)–(4) are the mass conservation equations for the PLLA scaffold, ECM and cell phases. The latter states that the rate of change of the cell volume fractionθn is due to advection
embodies conservation of mass for the multiphase mixture. In view of Equation (1), Equations (2)– (5) may be recast as a set of three nonlinear differential equations forΘ,θnandpw, with (2) and (3)
replaced with
∂Θ
∂t =SΘ; SΘ=Ss+Se, (6)
reflecting the pseudo-three phase nature of the model.
Equations (4) and (5) are closed by imposing the following boundary conditions:
∂θn
∂x = 0 at x= 0,1, (7)
pw =PU at x= 0, (8)
pw =PD at x= 1, (9)
wherePU andPD are the imposed up- and downstream pressures; initial conditions forθn,θsand
θeare specified subsequently.
In this paper, we consider the influence of scaffold properties on tissue construct growth and composition by examining the interplay between scaffold degradation and nascent tissue growth under the influence of biologically-relevant cell-substrate interactions, and mechanotransduction-regulated cell proliferation and ECM deposition. These phenomena are captured by the interaction functionsΣ,ψand the material transfer functionsSn,SeandSswhich are specified in terms of the
dependent variables below.
2.2 Cell-cell and cell-scaffold interactions
The functions Σand ψ describe respectively mechanical interactions between cells and between cells and their substrate; examples of relevant interactions include cell-cell and cell-substrate adhe-sion, and, in the case of motile cells such as fibroblasts, tractions between cells and their substrate.
Following Lemon et al. (2006) and O’Dea et al. (2010), we prescribeΣandψas follows:
Σ =−ν+ δaθn (1−Θ−θn)
, ψ=−χ+ δbθn
(1−Θ−θn)
, (10)
whereinν, χ, δaandδb account for the cells’ tendency to aggregate, their affinity for the substrate
and the strength of the repulsive forces between cells and between cells and substrate. We remark that in this simplified formulation, cell-scaffold and cell-ECM interactions are lumped together in (10); however, as detailed below, we exploit our knowledge of the separate evolution ofθsandθeto
distinguish between cell-scaffold and cell-ECM interactions.
As discussed in §1, cell adhesion to polymer scaffolds is mediated by adsorption of ECM molecules, or the embedding of specific cell recognition molecules, into the scaffold surface (Freed et al., 1994; Nikolovski and Mooney, 2000). Since the type and density of such molecules can vary markedly, depending on the surface chemistry of the polymer, it is reasonable to expect that cells preferentially adhere to their extracellular matrices rather than synthetic substitutes. In this study, we aim to understand how such a disparity in cell-scaffold and cell-ECM interactions may influence the composition of the developing construct. We achieve this by comparing simulation results for the caseχ=constant with those obtained forχ=χ(θe), so that the affinity of the cells for the
scaf-fold phase depends on how much ECM has been deposited on the PLLA substrate; for simplicity, the remaining interaction termsν, δaandδb are treated as fixed parameters.
We specifyχ(θe)as follows:
χ(θe) =χ0+
χ1−χ0
For suitable g1 = constant, this represents a smoothed switch between the valuesχ0 (the affinity
between cells and scaffold in the absence of deposited ECM) andχ1 > χ0(the elevated affinity due
to ECM accumulation); θe0 is the threshold level of ECM deposition at which this change occurs.
In the limitg1→ ∞, the progression betweenχ0andχ1approximates a step function.
2.3 Mechanotransduction-mediated growth
The cells’ response to biomechanical stimuli is accounted for by appropriate specification of the mass transfer ratesSi(i=n, e, s);Sw is chosen to ensure conservation of mass. Stimuli relevant
to tissue engineering applications include contact inhibition, residual stress caused by tissue growth (Fung, 1991; Skalak et al., 1996; Roose et al., 2003; Chaplain et al., 2006; Holzapfel and Ogden, 2006) and the local fluid dynamics, such as the local hydrostatic pressure (Roelofsen et al., 1995; Klein-Nulend et al., 1995) or fluid shear stress (You et al., 2000, 2001; Bakker et al., 2004a; Han et al., 2004; Yourek et al., 2004).
The focus of the current study is the interplay between scaffold degradation, tissue growth and cell-cell/cell-substrate interactions; for brevity, we restrict attention to cases in which cell prolifer-ation and ECM deposition are regulated by contact inhibition. (Considerprolifer-ation of the influence of a wider range of mechanical stimuli is given in O’Dea et al. (2010) and Osborne et al. (2010).) We represent such regulation in our model by introducing net cell proliferation and ECM deposition ratesκn, κe which depend upon the local cell volume fraction; the PLLA scaffold is assumed to
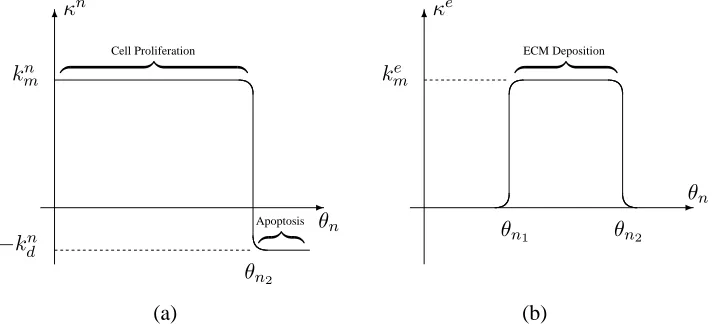
degrade at a constant rate. We identify three distinct cellular responses to the local cell volume fraction: a proliferative phenotype, an ECM-depositing phenotype and an apoptotic phenotype, for each of whichκn, κetake different values. The progression from one phenotype to the next occurs
at threshold densitiesθn1 and θn2 (0< θn1 < θn2). Functional forms for κ
n and κe are specified
below and depicted in Figure 3.
Sn(θn) = θnκn(θn), Se(θn) =θnκe(θn), Ss(θs) =−kdsθs, (12)
κn(θn) = kmn −
kn m+knd
2 (tanh (g2(θn−θn2))+1), (13)
κe(θn) =
kme
2 (tanh (g2(θn−θn1))−tanh (g2(θn−θn2))). (14)
Equations (12)–(14) embody the following assumptions: (i) cells proliferate at a constant ratekn m
until the cell volume fraction exceedsθn2, when they become apoptotic (with death ratek n d); (ii)
at intermediate values, the cells also deposit ECM at a rateke
m. As in Equation (11), in the limit
g2 → ∞,κnandκeare piecewise-constant and the progression between phenotypes obeys a step
function; in what follows, we chooseg2 =g1 = 100.
2.4 Initial conditions
Tissue engineers employ a number of different techniques to seed porous scaffolds with cells. Here we consider static seeding, in which a suspension of cells is injected onto the surface of, or into, the scaffold, leading to an initial cell population which is localised near the point of injection. Following O’Dea et al. (2010) and Osborne et al. (2010), we prescribe:
θn(x,0) =
ˆ
ns
2 (tanh (g3(x−α))−tanh (g3(x−β))), (15)
where ˆns is the maximum initial cell volume fraction, and x = α and x = β represent the left
-6
−kn
d
kn
m z }| {
Cell Proliferation
z }| {
Apoptosis
θn2
θn
κn
-6
ke
m z }| {
ECM Deposition
θn1 θn2
θn
κe
(a) (b)
Figure 3: (a) The net cell proliferation rate,κn, and (b) the ECM deposition rate,κe, representing
phenotypic progression in response to the local cell volume fractionθn. The dimensionless
parame-terskn
mandkme represent the rate of cell proliferation and ECM deposition whilstkdnrepresents the
rate of cell death. The thresholds areθn1 andθn2.
β < b < 1), near whichg3 governs the spatial gradient ofθn. In what follows, we fixa = 0.25,
b= 0.75,nˆ= 0.2,α= 0.4375,β = 0.5625, andg3 = 50without loss of generality.
Assumptions of uniform porosity have been employed in previous studies of in vitro tissue growth (Lemon et al., 2006; O’Dea et al., 2010; Osborne et al., 2010); however, the structure of scaffolds typically employed in such tissue engineering systems is highly heterogeneous (see Fig-ure 2). To determine the influence of such heterogeneity on construct evolution, we compare the predicted construct composition resulting from two separate initial conditions for the PLLA scaf-fold:
θs(x,0) =
( θideal
s for a6x6b
0 otherwise , θs(x,0) =
(
θsµCT(x) for a6x6b
0 otherwise . (16 a,b)
We setθideal
s = 0.0928, so that the former initial condition represents a scaffold of width (b−a)
and uniform porosity≈91%, this being the average initial porosity of the data shown in Figure 2. The choiceθµCTs (x) denotes the spatially-varying initial experimental data shown in Figure 2. In
all cases, the initial ECM distribution is specified as
θe(x,0) = 0. (17)
3
Numerical results
In this section, we present numerical simulations of Equations (2)–(5), subject to the boundary conditions (7)–(9). Employing Equations (10)–(14), and the initial conditions (15)–(17), we inves-tigate how the cells’ response to their environment (especially their interactions with the underlying substrate) influences the composition of the resulting tissue construct.
The numerical scheme that we use and its validation are described in Osborne and Whiteley (2010) and Osborne et al. (2010) and so we do not include details here. To summarise, Equation (5) is solved for pw using θn, θs and θe from the previous timestep (with a linear finite element
[image:10.612.113.470.36.200.2]and θs are updated by applying to (2)–(4) an implicit Euler method, together with linear finite
element approximations. For numerical convenience, we include a diffusive term, with constant diffusivityD(here we useD= 0.001), in Equation (4) which converts it to a second order parabolic equation. With D > 0 we need not track explicitly the sharp interface which is evident when
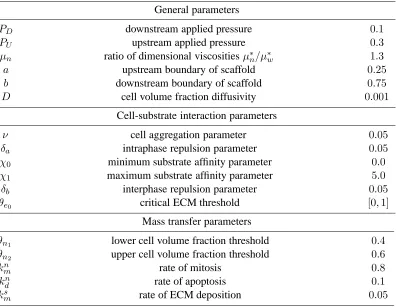
[image:11.612.91.490.181.488.2]D= 0. Such artificial diffusion has a negligible effect on the solution behaviour (VonNeumann and Richtmyer, 1950). Model parameter values are selected to illustrate the behaviour of the model and are similar to those employed in O’Dea et al. (2010) and Osborne et al. (2010); the specific values chosen are summarised in Table 1 and repeated in the relevant figure captions.
Table 1: Summary of dimensionless parameters employed in numerical simulations.
General parameters
PD downstream applied pressure 0.1
PU upstream applied pressure 0.3
µn ratio of dimensional viscosities µ∗n/µ∗w 1.3
a upstream boundary of scaffold 0.25
b downstream boundary of scaffold 0.75
D cell volume fraction diffusivity 0.001
Cell-substrate interaction parameters
ν cell aggregation parameter 0.05
δa intraphase repulsion parameter 0.05
χ0 minimum substrate affinity parameter 0.0
χ1 maximum substrate affinity parameter 5.0
δb interphase repulsion parameter 0.05
θe0 critical ECM threshold [0,1]
Mass transfer parameters
θn1 lower cell volume fraction threshold 0.4
θn2 upper cell volume fraction threshold 0.6
kn
m rate of mitosis 0.8
kn
d rate of apoptosis 0.1
ksm rate of ECM deposition 0.05
3.1 PLLA scaffold heterogeneity
To illustrate the model behaviour, in Figure 4 we present simulations corresponding to the case for which cells are seeded within a PLLA scaffold of uniform porosity and their interactions with the PLLA scaffold and deposited ECM are identical; that is, we employ Equation (16a) to initialiseθs
and chooseχ =constant in place of (11). Figure 5 shows corresponding simulation results in the case for whichθs(x,0)is specified via Equation (16b).
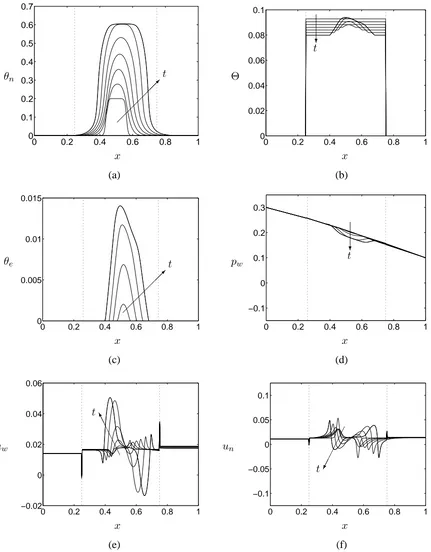
Figures 4(a) and (b) reveal that the cells proliferate and deposit ECM asymmetrically under the influence of perfusion. The PLLA scaffold degrades uniformly so that θs = θs(t) in a 6 x 6
fraction, ECM deposition ensures that the substrate density is maintained or increased. Figure 4(a) indicates that the cell volume fraction tends to a spatially-uniform valueθn = θn2. Asθnreaches
θn2, the transition to the apoptotic phenotype precludes any further increase in cell density. Re-entry
to the proliferative phenotype on subsequent reduction of cell density ensures a uniform distribution is maintained; the ECM deposition is greatest upstream due to perfusion causing advection of cells downstream, so thatθnattains the upper threshold at later times.
Figure 4 indicates that, in the regime shown, the addition of spatial variation to the substrate phase via ECM deposition does not affect significantly the dynamics of the other model variables shown in Figures 4(d)–(f). This behaviour has been discussed in our previous work (see Figures 4–7 of O’Dea et al. (2010)). Here, it suffices to note that the interplay between aggregative and repulsive cell behaviour (see Equation (10)) is reflected in the evolution of the pressures and velocities of each phase (see Figures 4(d)–(f); the cell phase pressure is omitted for brevity). At low cell volume fraction (early times), aggregation dominates and the cell phase velocity indicates cell movement towards the centre of the population to form a dense aggregate; at high cell volume fraction (later times) repulsive effects dominate, leading to migration away from the central region; aggregative effects dominate at the edges of the population where the cell population remains low. Combined, these effects generate a dense cell aggregate, with steep spatial gradients of cell volume fraction near its up- and down-stream periphery (shown by the final line in Figure 4(a)). To conserve mass, the culture medium phase moves in the opposite direction.
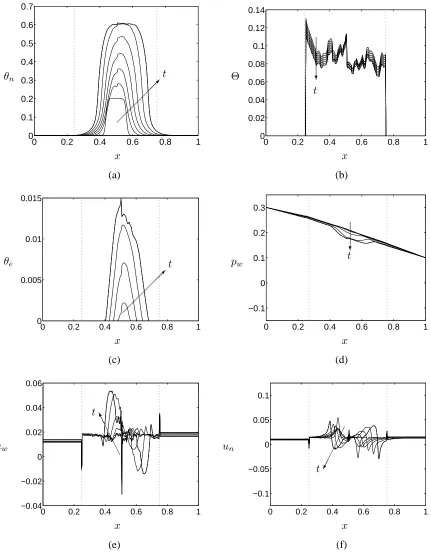
Comparison of Figures 4 and 5 shows that, while the global features of the predicted cell and ECM volume fractions remain similar, the introduction of PLLA scaffold heterogeneity induces large, short-range variations in cell and ECM volume fractions and, additionally, has a significant influence on the cells’ fluid-mechanical environment, with large variations in culture medium ve-locity evident over the short lengthscale associated with the heterogeneity of the substrate (Figure 5(e)).
The importance of the scaffold (and ECM) distribution on the culture medium and cell phase velocities is evident from Equation (5), which shows that spatial gradients inΘinfluence the culture medium pressure gradient, leading to significant changes in culture medium flow. In addition, the axial cell phase velocity, obtained by integrating the axial component of the cell phase momentum equation (Equation (22), Appendix A, in the long-wavelength limit), is defined as follows:
un=
1 12µn
−∂pw
∂x +
1
θn
∂
∂x θ
2 nΣ
+ 2∂Θ
∂xψ+ Θ
∂ψ ∂x
, (18)
which indicates that, under the influence of the final two terms, the large variations in substrate porosity present in Figures 2 and 5(b) will lead to significant changes in cell velocity. (We also note that the singularity inθs atx = a, btherefore leads to the spike in cell and culture medium
velocities, illustrated in Figures 4(e,f) and 5(e,f).) Additionally, inspection of Equations (10) and (18) reveals that active movement of cells within the tissue construct (embodied in the final two terms of (18)) results from a balance between aggregation, attachment to the substrate and repulsion, regulated byχ, ν, δa andδb. Spatial gradients of the cell and substrate phases also influence this
behaviour: whenνandχare constant, aggregation and attachment modify the cells’ velocity via:
1 6µn
ν∂θn
∂x +χ
∂Θ
∂x
, (19)
so that when aggregation or attachment dominates repulsion, cells move up spatial gradients ofθn
0 0.2 0.4 0.6 0.8 1 0
0.1 0.2 0.3 0.4 0.5 0.6 0.7
θn
x
t
0 0.2 0.4 0.6 0.8 1
0 0.02 0.04 0.06 0.08 0.1
Θ
x
t?
(a) (b)
0 0.2 0.4 0.6 0.8 1
0 0.005 0.01 0.015
θe
x
t
0 0.2 0.4 0.6 0.8 1
−0.1 0 0.1 0.2 0.3
pw
x
t?
(c) (d)
0 0.2 0.4 0.6 0.8 1
−0.02 0 0.02 0.04 0.06
uw
x t
A A A A AK
0 0.2 0.4 0.6 0.8 1
−0.1 −0.05 0 0.05 0.1
un
x t
[image:13.612.60.491.29.581.2]
(e) (f)
Figure 4: Illustrative plots of the evolution of (a) the cell volume fraction (θn), (b) the scaffold phase
volume fraction (θs), (c) the ECM volume fraction (θe), (d) the culture medium pressure (pw), (e)
the axial culture medium velocity (uw), and (f) the axial cell phase velocity (un) in the regime of cell
volume fraction dependent growth and degradation and uniform cell-scaffold interaction properties at times t = 0−3 (in steps of t=0.5). The model parameters are as described in Table 1 except
χ =χ1 in place of (11). Initial conditions are given by (15), (16a) and (17). Vertical dotted lines
mechanical stimulation to the growth and differentiation of various cell types (see §1 and §2.3), such variations in cell and culture medium velocity are likely to have a significant effect on local cell behaviour.
We pause to remark that Figures 4(a) and 5(a) show that as the cell population expands to colonise the scaffold, our fluid-based model allows egress of cells (and, eventually, the subsequently deposited ECM) from the scaffold into the up- and downstream regions (x < aandx > b). Lemon and King (2007) demonstrate that, due to cell-scaffold adhesion, such behaviour is minimised in scaffolds whose density distributions decay to zero at the boundaries; we have, however, employed experimentally-relevant data to initialiseθshere. Cell egress is not desirable in the current context
of a perfusion bioreactor (and is in any case minimal in the seeding protocol employed here: the cell flux θnun is small); however, it is of biological relevance to modelling tissue invasion after
implantation.
3.2 Cell-substrate interactions
In this subsection we investigate the influence of the properties of PLLA scaffold on the eventual construct composition, both in terms of its spatial distribution and its interactions with the cells.
First, we compare simulation results for whichχ=constant with those for which cell-scaffold adherence is governed by (11) and, in so doing, investigate how a disparity between cell-scaffold and cell-ECM attachment strength (due to the surface chemistry of the polymer scaffold) may in-fluence the composition of the developing construct. For clarity, we employ Equation (16a) to ini-tialiseθs, corresponding to a PLLA scaffold of initially uniform porosity; the combined influence
of cell-substrate interactions and scaffold heterogeneity on construct composition is investigated subsequently.
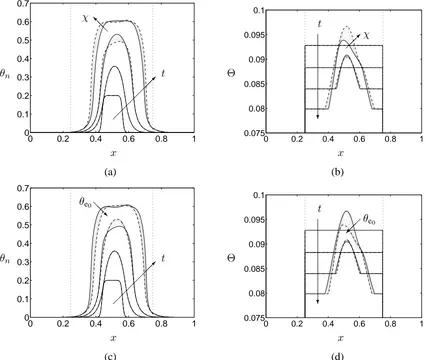
In Figures 6(a) and (b), we assume that the cells’ affinities for the PLLA scaffold and the de-posited ECM are identical; the figures show cell and scaffold phase distributions at illustrative time points for different values ofχ. Comparison of the construct composition whenχ= 0andχ = 5, suggests that cell migration up spatial gradients ofθs leads to a more sharply-defined cell volume
fraction profile; however, the maximal volume fraction is reduced. This is because cell movement is confined to the edge of the cell aggregate (at the centre∂Θ/∂x≈∂θn/∂x≈0).
Inspection of the cell volume fraction distribution at later times reveals more interesting be-haviour. Asθnincreases, advection of cells becomes more significant, leading to profiles which are
skewed in the downstream direction. For large cell volume fraction, the combination of advection and cell-cell and cell-substrate repulsion leads to cell migration away from the aggregate’s centre. This outward drift is balanced by inward movement of cells at the periphery of the densely populated region. In the case of strongly adherent cells, increased (inward) movement up spatial gradients of
Θcauses the cell volume fraction to peak at the periphery of the aggregate, with a flatter profile near the centre (see the final profile in Figure 6(a) in the caseχ = 5). For small values ofχ, a profile similar to that shown in Figure 4(a) is obtained.
Figures 6(c) and (d) show how the construct composition is influenced by differential adhesion between the porous scaffold and the deposited ECM. The cells’ adherent behaviour is modelled by Equation (11) so thatχvaries betweenχ0= 0andχ1 = 5in response to the ECM volume fraction.
0 0.2 0.4 0.6 0.8 1 0 0.1 0.2 0.3 0.4 0.5 0.6 0.7 θn x t
0 0.2 0.4 0.6 0.8 1
0 0.02 0.04 0.06 0.08 0.1 0.12 0.14 Θ x t ? (a) (b)
0 0.2 0.4 0.6 0.8 1
0 0.005 0.01 0.015 θe x t
0 0.2 0.4 0.6 0.8 1
−0.1 0 0.1 0.2 0.3 pw x t? (c) (d)
0 0.2 0.4 0.6 0.8 1
−0.04 −0.02 0 0.02 0.04 0.06 uw x t A A A A AK
0 0.2 0.4 0.6 0.8 1
[image:15.612.60.491.29.582.2]−0.1 −0.05 0 0.05 0.1 un x t (e) (f)
Figure 5: Results from a typical simulation showing the evolution of (a) the cell volume fraction (θn), (b) the scaffold phase volume fraction (θs), (c) the ECM volume fraction (θe), (d) the culture
medium pressure (pw), (e) the axial culture medium velocity (uw), and (f) the axial cell phase
velocity (un) in the regime of cell volume fraction dependent growth and degradation and uniform
cell-scaffold interaction properties at timest = 0−3(in steps of t=0.5). Parameters values: as in Table 1, exceptχ=χ1in place of (11). Initial conditions are given by (15), (16b) and (17). Vertical
additional predictive capability to the model. Henceforth, we return to the simplified model in whichχ=constant. We note that in this case, inspection of Equations (5) and (10) reveals that the influence of the cell-scaffold affinity strength on the model behaviour may only be studied in the presence of a spatially-heterogeneous substrate volume fraction; our previous work (O’Dea et al., 2010) therefore neglected its influence.
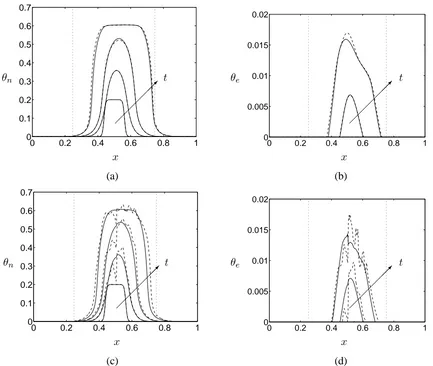
In Figure 7 we demonstrate how the combined effects of cell-substrate interactions (χ=constant) and the heterogeneity of PLLA scaffold volume fraction influences the construct composition. As indicated by Equation (18), strong cell-scaffold adherence enhances cell movement up scaffold and ECM gradients. Large, short-range spatial gradients of scaffold porosity exist in the experimental data we have employed to initialiseθs. We therefore observe large deviations in cell and ECM
dis-tributions, which mirror, and exaggerate, the underlying PLLA scaffold porosity distribution. Since the deposition of ECM (and other associated extracellular materials) enables the maintenance of the mechanical properties of the degrading PLLA scaffold, such heterogeneous ECM distributions have important implications regarding the structural suitability and suitability for implant of the resulting construct. With this in mind, in the following subsection we focus on the interplay between PLLA degradation and ECM deposition and the maintenance of substrate porosity during this process.
3.3 Scaffold degradation
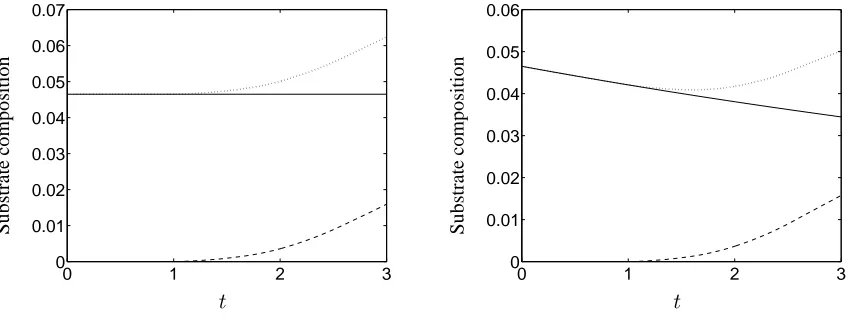
The maintenance of tissue construct material properties is crucially affected by achieving a match between the rates of scaffold degradation and deposition of ECM and other extracellular materials. In this section we indicate how our model may be employed to determine how the evolution of the substrate volume fraction depends on the model parameters. For clarity, in preference to the spatio-temporal distributions presented in§§3.1,3.2, we consider the evolution of the total substrate mass
Θ(t), and its PLLA and ECM componentsθs(t),θe(t), which are defined as follows:
Θ(t) =θs(t) +θe(t); θs(t) =
Z 1
0
θs(x, t)dx, θe(t) =
Z 1
0
θe(x, t)dx. (20)
The simulations presented in Figure 8 demonstrate that close control of scaffold degradation and ECM deposition is required in order to maintain substrate density. We do not present the corresond-ing cell volume fraction evolution since our focus here is on the tissue construct’s rigid, load-bearcorresond-ing components. In Figure 8(a), we consider a non-degrading scaffold, and the substrate volume frac-tion is therefore determined by the evolufrac-tion of the ECM phase. With the addifrac-tion of scaffold degradation (Figure 8(b)), we observe an initial decrease in substrate due to scaffold degradation; as the seeded cell population increases, Equation (14) leads to progression to an ECM-depositing phenotype and the substrate volume fraction increases. Our model predicts that, eventually, the cell volume fraction will increase to a point at which all cells in the scaffold enter apoptosis, at which point the substrate volume fraction achieves an equilibrium level. However, the timescale over which we perform our simulations is restricted by our wish to restrict tissue egress from the scaffold into the up- and downstream regionsx < a,x > b(see§3) and we therefore do not observe such equilibrium behaviour. Nevertheless, our simulation results indicate that the rate of scaffold degradation is a key experimental variable, and suggest that there is a threshold time, before which the construct’s mechanical properties are likely to be unsuitable for implantation.
4
Discussion
0 0.2 0.4 0.6 0.8 1 0
0.1 0.2 0.3 0.4 0.5 0.6 0.7
θn
x χ
@ @ I
t
0 0.2 0.4 0.6 0.8 1
0.075 0.08 0.085 0.09 0.095 0.1
Θ
x χ
t
?
(a) (b)
0 0.2 0.4 0.6 0.8 1 0
0.1 0.2 0.3 0.4 0.5 0.6 0.7
θn
x
t
θe0
@@R
0 0.2 0.4 0.6 0.8 1
0.075 0.08 0.085 0.09 0.095 0.1
Θ
x θe0
t
?
[image:17.612.64.490.101.461.2](c) (d)
Figure 6: The evolution of the construct composition (at timest= 0,1,2,3) in the regime of cell density dependent growth and degradation; arrows indicate the direction of increasing time. In (a) and (b) the predicted cell and substrate volume fractions are shown for various values of cell-substrate interaction parameter values:χ= 0−5(in steps ofχ= 1),δb = 0.05; the arrows indicate
the direction of increasingχ. In (c) and (d), the cell and substrate volume fractions are depicted in the case for which cell-substrate interactions are governed by (11) forθe0 =−1(χ= 5; solid line),
θe0 = 0−0.025in steps ofθe0 = 0.005(dotted lines) andθe0 = 1(χ= 0; dashed line). The arrows
indicate the direction of increasingθe0. Initial conditions are given by (15), (16a) and (17). Except
0 0.2 0.4 0.6 0.8 1 0
0.1 0.2 0.3 0.4 0.5 0.6 0.7
θn
x
t
0 0.2 0.4 0.6 0.8 1
0 0.005 0.01 0.015 0.02
θe
x
t
(a) (b)
0 0.2 0.4 0.6 0.8 1 0
0.1 0.2 0.3 0.4 0.5 0.6 0.7
θn
x
t
0 0.2 0.4 0.6 0.8 1
0 0.005 0.01 0.015 0.02
θe
x
t
[image:18.612.62.495.116.482.2]
(c) (d)
Figure 7: The evolution of the cell volume fraction (t = 0,1,2,3) and the ECM volume fraction (t = 2,3) in the case of cell volume fraction dependent cell proliferation and ECM deposition defined by Equations (12) and (14); arrows indicate the direction of increasing time. Plots are forχ = 1(solid line) andχ = 0(dashed line). In (a), (b) Initial conditions are given by Initial conditions are given by (15), (16a) and (17) and in (c), (d) Equation (16b) is employed to specify
θs(x,0). Except as stated, all parameters are as given in Table 1. Vertical dotted lines indicate the
0 1 2 3 0 0.01 0.02 0.03 0.04 0.05 0.06 0.07 S u b st ra te co m p o si ti o n t
0 1 2 3
[image:19.612.65.492.34.193.2]0 0.01 0.02 0.03 0.04 0.05 0.06 S u b st ra te co m p o si ti o n t
Figure 8: The evolution of the volume fraction of: the substrate, Θ (dotted line); the ECM,θe
(dashed line); and the PLLA scaffold,θs(solid line), over time for two different values of the PLLA
scaffold degradation rate,ks
d. In (a)kds = 0.0, (b)ksd= 0.1. An increased ECM deposition rate of
ke
m = 0.1is used to amplify the deposition of ECM. Initial conditions are given by (15), (16b) and
(17). Except as stated, all parameters are as given in Table 1.
PLLA scaffold and deposited ECM. The formulation employed is based on the general multiphase formulation proposed in Lemon et al. (2006) and extends the three phase model of O’Dea et al. (2010), where the PLLA scaffold was assumed to be spatially-homogeneous and inert. Many sim-ilar studies of tissue growth have employed this simplifying assumption, tacitly assuming that the importance of spatial variation of scaffold/ECM volume fraction is negligible. Here, we include ad-ditional mass conservation equations for the scaffold and ECM phases with which to model scaffold degradation and ECM deposition. This allows us to incorporate PLLA scaffold phase heterogene-ity, inhomogeneous deposition of ECM, and to consider explicitly the interactions between cells and their different supporting structures, while remaining within a simplified modelling framework. Comparison of our simulation results with our previous work (O’Dea et al., 2010) indicates that the predicted cell volume fraction and variables related to the mechanical environment are strongly affected by heterogeneous scaffold volume fraction distributions; for instance, the culture medium velocity shows strong short-range variation, which is likely to have a profound effect on the mechanical environment of the cells. Additionally, we have demonstrated that ECM deposition by the cells is highly localised in the regions of elevated cell volume fraction and that spatial variation in the PLLA scaffold volume fraction leads to large deviations in cell and ECM distributions.
gradients in scaffold distribution, this leads to cells and ECM profiles which mirror and exaggerate the underlying scaffold porosity. The heterogeneity of the resulting tissue construct has important ramifications for its structural stability and suitability for implant.
Our model associates scaffold degradation with a reduction in scaffold phase volume fraction, from which we infer deleterious effects on material properties, which are ameliorated by deposition of ECM (and other extracellular materials). The interplay between scaffold degradation and ECM deposition is therefore crucial in determining tissue construct material properties. The results of our simulations discussed above indicate that the production of scaffolds with uniform porosity may play an important role in producing tissue constructs with mechanical properties appropriate for implant.
We have extended our previous studies (O’Dea et al., 2008, 2010; Osborne et al., 2010), by accommodating spatial non-uniformity in scaffold and ECM volume fraction, demonstrating the importance of such a consideration; however, we have made a number of simplifying assumptions to enable analysis. We have restricted attention to a rigid scaffold and ECM phase (the remaining phases being modelled as viscous fluids) and so our formulation applies to those constructs whose solid characteristics are dominated by the rigidity of the scaffold and/or deposited materials. We note also that our simplified treatment of the PLLA scaffold and ECM means that the mechanics of our model are in fact accommodated within a three phase framework. Our model formulation is further simplified by exploiting the long-wavelength limit; our previous work (Osborne et al., 2010) has indicated that, while two-dimensional variation of mechanical stimulation has an important effect on construct growth, the long-wavelength limit provides a good approximation to the aver-aged behaviour of the two-dimensional model, even for bioreactors with large aspect ratio, such as that illustrated in Figure 1. Nevertheless, validation of our model results within a two-dimensional framework remains important future work. We have assumed that the scaffold degrades uniformly; however, it is known that bi-products of tissue growth can influence the mechanical and structural nature of tissue engineering scaffolds (see, e.g., Ahearne et al. (2010) and references therein). Con-sideration of such effects represents another interesting extension to our study.
We have employed our simplified formulation to make inferences regarding the likely composi-tion and mechanical integrity of engineered tissue constructs. Important further work includes ex-plicit modelling of the mechanical properties of the scaffold and ECM, considering, for example, a poroelastic (Roose et al., 2003) or poroviscoelastic (Byrne and Preziosi, 2003) model. Additionally, the robustness of our conclusions should be investigated by considering the addition of nutrient-limited growth to our formulation; methodologies for such investigations are given by Lewis et al. (2005) and Lemon and King (2007). Tissue engineers employ a number of different techniques to seed porous scaffolds with cells. We have restricted attention to an initial seeding which is highly lo-calised near the centre of the scaffold (via, e.g. injection of a cell suspension), to illustrate the model behaviour. With the inclusion of nutrient-limited growth, it is natural to investigate the influence of different experimentally-relevant cell seedings on the eventual construct morphology. Such studies allow for further incorporation of experimental data (via the initial seeding density, in addition to the scaffold porosity distribution) and lend themselves for validation against histological samples from relevant cell culture experiments.
5
Acknowledgements
KUK-013-04 made by King Abdullah University of Science and Technology (HMB). We are also grateful to E. Baas, ISTM, Keele University for the provision of experimental data.
A
Model derivation
We consider a bioreactor of lengthL∗ and widthh∗, modelled as a two-dimensional channel
con-taining a mixture of four interacting phases, representing cells, culture medium, PLLA scaffold and ECM and denote these via a subscript i = n, w, s, e, respectively. The viscosity of any fluid phase is denoted µ∗
i, and the typical timescale for tissue growth (comprising both cell
prolifera-tion and ECM deposiprolifera-tion) is denoted K∗. Asterisks distinguish dimensional quantities from their
dimensionless equivalents.
We introduce a Cartesian coordinate system L∗x = L∗(x, y) and time K∗tand the channel
occupies the dimensionless region 0 6 x 6 1, 0 6 y 6 h = h∗/L∗. The volume fraction of
each phase is denotedθi, while the dimensionless volume-averaged velocities, pressures and stress
tensors of the each phase are denoted K∗L∗u
i = K∗L∗(ui, vi), K∗µ∗wpi and K∗µ∗wσi. Tissue
growth, scaffold degradation and ECM deposition are captured via material transfer functionsK∗S i.
We assume that all dimensionless dependent variables are functions ofxandt.
The model is constructed by considering mass and momentum balances for each phase, as-suming that each phase is incompressible, with equal density, and neglecting inertial effects; the equations governing theithphase (with volume fractionθ
i) are as follows (see Lemon et al. (2006);
O’Dea et al. (2010); Osborne et al. (2010)):
∂θi
∂t +∇ ·(θiui) =Si(θk, pk,uk), (21)
∇ · θiσi+
X
j6=i
Fij =0. (22)
Additional conservation conditions may be obtained by summing over all phases and exploiting the no-voids conditionPiθi= 1.
In Equation (21)K∗S
iis the net material production term associated with phasei(mass
conser-vation demands thatPSi= 0); in (22),K∗µ∗w/L∗Fij is the interphase force exerted by phasejon
phasei, obeyingFij =−Fji. These interphase forces comprise interphase viscous drag (with drag
coefficientµ∗
w/L∗2k) and active forces, the latter being embodied within extra pressures which arise
due to cell-cell, cell-ECM and cell-scaffold interactions; interactions between the culture medium and scaffold phases are assumed to involve only viscous drag. The mechanics of this four phase for-mulation is simplified by lumping the scaffold and ECM components into a single ‘substrate’ phase, denotedθS =θs+θe, and modelled as a rigid porous material. For notational convenience, in this
Appendix, we employ the subscript S to denote the substrate, in preference toΘ. Separate mass conservation equations are nevertheless employed forθsandθeto track their individual evolution.
The cell population and culture medium are represented as distinct viscous fluids, modelled by standard viscous stress tensors; the rigidity of the substrate implies uS = 0. These constitutive
assumptions are embodied in the following equations.
σi=−piI+µi ∇ui+∇uTi −2
3(∇ ·ui)I, for i=n, w , (23)
Fij = (pw+ψij) (θj∇θi−θi∇θj) +kθiθj(uj−ui), for i, j=n, w, S , (24)
whereinµiare the dimensionless viscosities of each phase, andΣnandψnS are defined
Σn=−ν+
δaθn
θw
and ψnS =−χ+
δbθn
θw
. (26)
In Equation (26) ν, χ, δa, δb > 0 dictate the cells’ tendency to aggregate, their affinity for the
scaffold/ECM and the strength of cell-cell/cell-scaffold repulsion. In a more general formulation, the coefficient of viscous drag k between two phases i and j varies depending upon the phases under consideration and may depend upon their respective volume fractions or other state variables. A suitable representation is to replace kby, say, kij(θi, θj) (obeyingkij = kji). Full details and
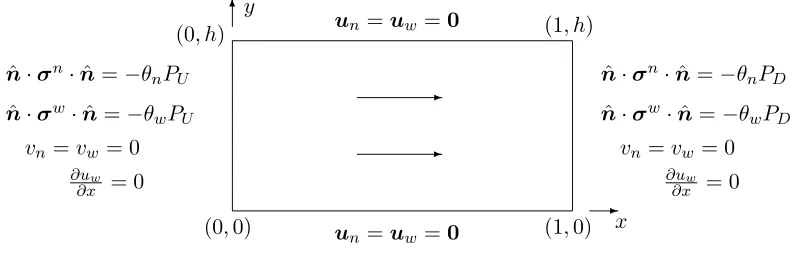
discussion of the above choice of interphase interaction terms may be found in Lemon et al. (2006). Figure 9 depicts the two-dimensional model of the bioreactor, together with appropriate bound-ary conditions. These correspond to no-slip and no-penetration of cells or culture medium through the channel walls, a pressure-driven flow imposed via up- and downstream pressuresK∗µ∗
wPUand
K∗µ∗wPD, partitioned normal stress conditions and fully-developed flow atx= 0,1.
-x
6y
(1,0)
(0, h) (1, h)
(0,0) un=uw=0
un=uw=0
ˆ
n·σn·nˆ =−θnPU
ˆ
n·σw·nˆ =−θwPU
vn=vw = 0
∂uw
∂x = 0
ˆ
n·σn·nˆ =−θnPD
ˆ
n·σw·nˆ =−θwPD
vn=vw= 0
∂uw
∂x = 0
-Figure 9: The two-dimensional domain, outward-pointing normalnˆ and associated boundary
condi-tions. The arrows indicate the perfusion direction in the case of dimensionless up- and downstream pressuresPU andPD obeyingPU > PD.
We now simplify the two-dimensional equations by considering the limit for which the aspect ratio of the bioreactor is asymptotically small (h ≪ 1). We remark that, since the culture medium volume fraction may be eliminated viaθw = 1−θn−θs−θeand the substrate is rigid, we need
consider momentum conservation equations for the fluid (cell and culture medium) phases, only. Following O’Dea et al. (2010), the reduced model is obtained by rescaling according to:
y =hy, vi =hvi, pi =pi/h
2
, (27)
and averaging across the channel in the transverse direction (imposing the boundary conditions at
y = 0, hdepicted in Figure 9). We find that the pressure and the volume fraction of each phase are functions ofxandtonly and the flow of cells and culture medium is unidirectional at leading order (vi = 0). Expressions for the averaged axial velocities huwiand huniare obtained from the
[image:22.612.101.497.254.383.2]pw(x, t):
∂θs
∂t =Ss, (28)
∂θe
∂t =Se, (29)
∂θn
∂t +
1 12
∂ ∂x
(1−θs−θe−θn)
∂pw
∂x
=Sn, (30)
∂ ∂x
(θn+µn(1−θs−θe−θn))
∂pw
∂x
+ ∂
∂x
∂(θ2 nΣn)
∂x + 2θnψnS
∂(θe+θs)
∂x +θn(θe+θs)
∂ψnS
∂x
= 0, (31)
in which µn is the relative viscosity of the cell and culture medium phases. The extra pressures
ΣnandψnS are scaled according to equation (27) so that these interactions are retained at leading
order, which implies(ν, δa, χ, δb) = (¯ν,δ¯a,χ,¯ δ¯b)/h2; the remaining parameters areO(1).
Equa-tions (28)–(31) embody conservation of mass for the ECM, PLLA scaffold and cell phases, and the multiphase mixture. Dropping the subscripts on the interaction functions Σnand ψnS gives the
equations stated in the main text.
Under the rescaling, (27), the boundary conditions shown in Figure 9 become:
pw =PU at x= 0, (32)
pw =PD at x= 1, (33)
∂θn
∂x = 0 at x= 0,1. (34)
References
T. Adachi, Y. Osako, M. Tanaka, M. Hojo, and S.J. Hollister. Framework for optimal design of porous scaffold microstructure by compututational simulation of bone regeneration. Biomat., 27: 3964–3972, 2006.
M. Ahearne, S.L. Wilson, K-K Liu, S. Rauz, A.J. El Haj, and Y. Yang. Influence of cell and collagen concentration on the cell-matrix mechanical relationship in a corneal stroma wound healing model. Exp. Eye Res., 91:584–591, 2010.
R.P. Araujo and D.L.S McElwain. A mixture theory for the genesis of residual stresses in growing tissues i: A general formulation. SIAM J. of App. Math., 65(4):1261–1284, 2005.
A. Bakker, J. Klein-Nulend, and E. Burger. Shear stress inhibits while disuse promotes osteocyte apoptosis. Biochem. Biophys. Res. Comm., 320:1163–1168, 2004a.
A. Bakker, J. Klein-Nulend, and E. Burger. Shear stress inhibits while disuse promotes osteocyte apoptosis. Biochem. Biophys. Res. Commun., 320(4):1163–1168, 2004b.
C.J.W. Breward, H.M. Byrne, and C.E. Lewis. The role of cell-cell interactions in a two-phase model for avascular tumour growth. J. Math. Biol., 45:125–152, 2002.
J.A. Burdick and R.L. Mauck, editors. Biomaterials for Tissue Engineering Applications: A Review
D.P. Byrne, D. Lacroix, J.A. Planell, D.J. Kelly, and P.J. Prendergast. Simulation of tissue differen-tiation in a scaffold as a function of porosity, Young’s modulus and dissolution rate: application of mechanobiological models in tissue engineering. Biomat., 28(36):5544–5554, 2007.
H.M. Byrne and L. Preziosi. Modelling solid tumour growth using the theory of mixtures. Math.
Med. Biol., 20(4):341–366, 2003.
S.H. Cartmell and A.J. El Haj. Mechanical bioreactors for tissue engineering. In J. Chaudhuri and M. Al-Rubeai, editors, Bioreactors for tissue engineering: Principles, Design and Operation, chapter 8, pages 193–209. Springer, Dordrecht, The Netherlands, 2005.
M.A.J. Chaplain, L. Graziano, and L. Preziosi. Mathematical modelling of the loss of tissue com-pression responsiveness and its role in solid tumour development. Math. Med. Biol., 23(3):197, 2006.
S.C. Cowin. Tissue growth and remodeling. Ann. Rev. of Biomed. Eng., 6(1):77–107, 2004. S.C. Cowin. How is a tissue built? J. Biomech. Eng., 122:553, 2000.
A. Curtis and M. Riehle. Tissue engineering: the biophysical background. Phys. in MEd. and Biol, 46:47–65, 2001.
D.A. Drew and L.A. Segel. Averaged equations for two-phase flows. Studies in Appl. Math., 50: 205–231, 1971.
A.J. El Haj, S.L. Minter, S.C. Rawlinson, R. Suswillo, and L.E. Lanyon. Cellular responses to mechanical loading in vitro. J. Bone and Min. Res., 5(9):923–32, 1990.
S.J. Franks and J.R. King. Interactions between a uniformly proliferating tumour and its surround-ings: uniform material properties. Math. Med. Biol., 20:47–89, 2003.
L.E. Freed and G. Vunjak-Novakovic. Culture of organized cell communities. Advanced Drug
Delivery Rev., 33:15–30, 1998.
L.E. Freed, G. Vunjak-Novakovic, R.J. Biron, D.B. Eagles, D.C. Lesnoy, S.K. Barlow, and R. Langer. Biodegradable polymer scaffolds for tissue engineering. Nat. Biotech., 12(7):689– 693, 1994.
Y.C. Fung. What are residual stresses doing in our blood vesels? Ann. Biomed. Eng., 19:237–249, 1991.
M.A. Haider, J.E. Olander, R.F. Arnold, D.R. Marous, A.J. McLamb, K.C. Thompson, W.R. Woodruff, and J.M. Haugh. A phenomenological mixture model for biosynthesis and link-ing of cartilage extracellular matrix in scaffolds seeded with chondrocytes. Biomech. Model.
Mechanobiol., pages 1–10, 2010. ISSN 1617-7959.
Y. Han, S.C. Cowin, M.B. Schaffler, and S. Weinbaaum. Mechanotransduction and strain amplifi-cation in osteocyte cell processes. Proc. Nat. Acad. of Sci., 101(47):16689–16694, 2004.
G.A. Holzapfel and R.W. Ogden. Mechanics of biological tissue. Springer-Verlag, Berlin, 2006. D.J. Kelly and P.J. Prendergast. Effect of a degraded core on the mechanical behaviour of
J. Klein-Nulend, J. Roelofsen, J.G. Sterck, C.M. Semeins, and E.H. Burger. Mechanical loading stimulates the release of transforming growth factor–beta activity by cultured mouse calvariae and periosteal cells. Journal of Cell Physiology, 163(1):115–119, 1995.
Wu L. and J. Ding. In vitro degradation of three-dimensional porous poly(d,l-lactide-co-glycolide) scaffolds for tissue engineering. Biomat., 25(27):5821–5830, 2004.
K.A. Landman and C.P. Please. Tumour dynamics and necrosis: Surface tension and stability. IMA
J. of Math. Appl. in Med. and Biol., 18(2):131–158, 2001.
G. Lemon and J.R. King. Multiphase modelling of cell behaviour on artificial scaffolds: effects of nutrient depletion and spatially nonuniform porosity. Math. Med. Biol., 24(1):57, 2007.
G. Lemon, J.R King, H.M. Byrne, O.E. Jensen, and K. Shakesheff. Multiphase modelling of tissue growth using the theory of mixtures. J. Math. Biol., 52(2):571–594, 2006.
M.C. Lewis, B.D. Macarthur, J. Malda, G. Pettet, and C.P. Please. Heterogeneous proliferation within engineered cartilaginous tissue: the role of oxygen tension. Biotech. and Bioeng., 91(5): 607–15, 2005.
S.R. Lubkin and T. Jackson. Multiphase Mechanics of Capsule Formation in Tumors. J. Biomech.
Eng., 124:237, 2002.
I. Martin, D. Wendt, and M. Heberer. The role of bioreactors in tissue engineering. Trends in
Biotechn., 22(2):80–86, 2004.
J. Nikolovski and D.J. Mooney. Smooth muscle cell adhesion to tissue engineering scaffolds.
Biomat., 21(20):2025–2032, 2000.
R.D. O’Dea, S.L. Waters, and H.M. Byrne. A two-fluid model for tissue growth within a dynamic flow environment. Eur. J. Appl. Math., 19(641):607–634, 2008.
R.D. O’Dea, S.L. Waters, and H.M. Byrne. A three phase model for tissue construct growth in a perfusion bioreactor. J. Math. Med. Biol., 27(2):95–127, 2010.
R.D. O’Dea, S.L. Waters, and H.M. Byrne. Modelling tissue growth in bioreactors: a review. In L. Geris, editor, Computational Modeling in Tissue Engineering. Springer-Verlag, 2012.
J.M. Osborne and J.P. Whiteley. A numerical method for the multiphase viscous flow equations.
Comput. Methods Appl. Mech. Engrg., 199:3402–3417, 2010. doi:10.1016/j.cma.2010.07.011.
J.M. Osborne, R.D. ODea, J.P. Whiteley, H.M. Byrne, and S.L. Waters. The influence of bioreactor geometry and the mechanical environment on engineered tissues. J. Biomech. Eng., 132(5), 2010. doi: 10.1115/1.4001160.
L. Preziosi and A. Tosin. Multiphase and multiscale trends in cancer modelling. Math. Model. Nat.
Phenom., 4(3):1–11, 2009. ISSN 0973-5348.
J. Roelofsen, J. Klein-Nulend, and E.H. Burger. Mechanical stimulation by intermittent hydrostatic compression promotes bone-specific gene expression in vitro. J. Biomech., 28(12):1493–1503, 1995.
J.A. Sanz-Herrera, J.M. Garc´ıa-Aznar, and M. Doblar´e. On scaffold designing for bone regenera-tion: A computational multiscale approach. Acta Biomat., Online PrePrint, 2008.
J.D. Sipe. Tissue Engineering and Reparative Medicine. Ann. of the New York acad. of Sci., 961: 1–9, 2002.
R. Skalak, S. Zargaryan, R.K. Jain, P.A. Netti, and A. Hoger. Compatibility and the genesis of residual stress by volumetric growth. J. Math. Biol., 34:889–914, 1996.
JPG Urban. The chondrocyte: a cell under pressure. Rheumat., 33(10):901–908, 1994.
J. VonNeumann and R.D. Richtmyer. A method for the numerical calculation of hydrodynamic shocks. J. Appl. Phys., 21:232, 1950.
Q.G. Wang, B. Nguyen, C.R. Thomas, Z. Zhang, A.J. El Haj, and N.J. Kuiper. Molecular profiling of single cells in response to mechanical force: comparison of chondrocytes, chondrons and encapsulated chondrocytes. Biomat., 31(7):1619–1625, 2010.
D.J. Wilson, J.R. King, and H.M. Byrne. Modelling scaffold occupation by a growing, nutrient-rich tissue. Math. Models Methods Appl. Sci., 17:1721, 2007.
Y. Yang and AJ El Haj. Biodegradable scaffolds – delivery systems for cell therapies. Expert Opin.
Biol. Ther., 6(5):485–498, 2006.
J. You, C.E. Yellowley, H.J. Donahue, Y. Zhang, Q. Chen, and C.R. Jacobs. Substrate deforma-tion levels associated with routine physical activity are less stimulatory to bone cells relative to loading–induced oscillatory fluid flow. Journal of Biomechanical Engineering, 122:377–393, 2000.
L. You, S.C. Cowin, M.B. Schaffler, and S. Weinbaum. A model for strain amplification in the actin cytoskeleton of osteocytes due to fluid drag on pericellular matrix. J. Biomech., 34(11):1375–86, 2001.
G. Yourek, A. Al-Hadlaq, R. Patel, S. McCormick, G.C. Reilly, and J.J. Mao. Nanophysical prop-erties of living cells. In Michael A. Stroscio, Mitra Dutta, and Bin He, editors, Biological
Nanos-tructures and Applications of NanosNanos-tructures in Biology, Bioelectric Engineering, pages 69–97.