Dynamic compression of foam supported plates impacted by high
velocity soil
T. Liu*, H.N.G. Wadley§ and V.S. Deshpande*
*Department of Engineering, University of Cambridge, Trumpington Street, Cambridge CB2 1PZ, UK.
§
Department of Material Science & Engineering,
School of Engineering and Applied Science, University of Virginia Charlottesville, VA 22903, USA.
Abstract
The response of back-supported buffer plates comprising a solid face sheet and foam core backing impacted by a column of high velocity particles (sand slug) is investigated via a lumped parameter model and coupled discrete/continuum simulations. The buffer plate is either resting (unattached) or attached to a rigid stationary foundation. The lumped parameter model is used to construct maps of the regimes of behaviour with axes of the ratio of the height of the sand slug to core thickness and the normalised core strength. Four regimes of behaviour are identified based on whether the core compression ends prior to the densification of the sand slug or vice versa. Coupled discrete/continuum simulations are also reported and compared with the lumped parameter model. While the model predicted regimes of behaviour are in excellent agreement with numerical simulations, the lumped parameter model is unable to predict the momentum transmitted to the supports as it neglects the role of elasticity in both the buffer plate and the sand slug. The numerical calculations show that the momentum transfer is minimised for intermediate values of the core strength when the so-called “soft-catch” mechanism is at play. In this regime the bounce-back of the sand slug is minimised which reduces the momentum transfer. For high values of the core strength, the response of the buffer plate resembles a rigid plate with nearly no impulse mitigation while at low values of core strength, a slap event occurs when the face sheet impinges against the foundation due to full densification of the foam core. This slap event results in a significant enhancement of the momentum transfer to the foundation. The results demonstrate that appropriately designed buffer plates have potential as impulse mitigators in landmine loading situations.
Keywords: fluid-structure interaction, discrete/continuum coupling, dynamic loading.
1. Introduction
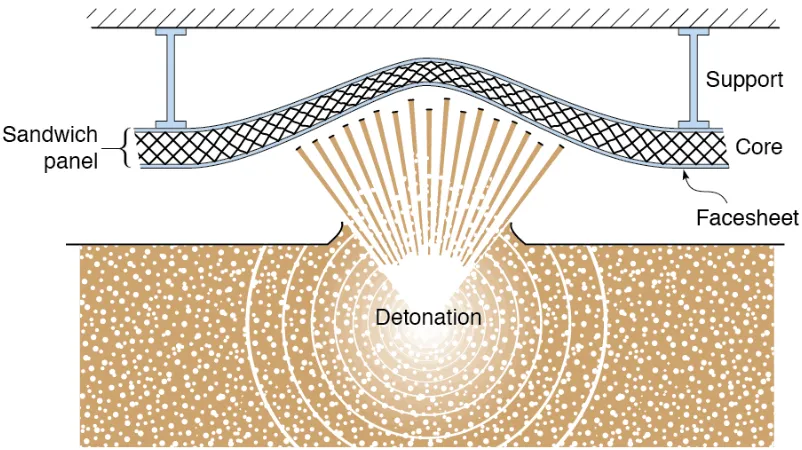
The air and water blast resistance of structures has recently received increased attention with the overall aim of designing lightweight, blast resistant structures. Several recent theoretical studies have shown that sandwich structures subjected to water blast outperform monolithic structures of equal mass, see for example Fleck and Deshpande [1] and Xue and Hutchinson [2]. Experiments reported by Wadley et al [3] and Wei et al [4] have confirmed these predictions. The enhanced performance is mainly due to fluid-structure interaction effects such that a smaller fraction of the impulse is transmitted into sandwich structures compared to their monolithic counterparts. By contrast, under air blast, sandwich structures provide smaller benefits over monolithic structures as fluid-structure interaction effects are more difficult to exploit [5]. The extension of these ideas to the design of structures against soil impact from say a landmine explosion (see Fig. 1) requires better insight into the dynamic interaction of soil with structures; the development of such a fundamental understanding is the focus of this article.
Significant understanding of fluid-structure interactions effects for underwater and air blast loading has been obtained via one-dimensional calculations. For example, following the classical work of Taylor [6] which quantified the underwater fluid-structure interaction effects for a free-standing rigid plate, Deshpande and Fleck [7] extended these ideas to sandwich plates. Deshpande and Fleck [7] predicted significant reductions in the momentum transfer to sandwich plates compared to monolithic plates of equal mass. These predictions were verified via simulated underwater blast experiments [8, 9] that involved the detonation of an underwater charge. Analogous predictions were also reported for air explosions by Kambouchev et al. [5] and Hutchinson [10] and subsequently investigated experimentally in [11,12]. Given the insight that has been gleaned from these studies, we develop here an analogous model to investigate the fluid-structure interaction between an impacting column of particles (representing the ejecta of a landmine) and a back-supported buffer plate.
A time sequence of the ejecta from a buried explosion is shown in Fig. 2a. It can be seen that the initially ejected soil forms a circular column with an approximately planar leading edge. Wadley and co-workers1 have recently investigated the response of back-supported sandwich structures impacted by model explosively accelerated “planar leading edge” sand columns. The experimental set-up used in their experiments is sketched in Fig. 2b and involves: (i) a sandwich panel bolted to a vertical pendulum at a stand-off S from the ground and (ii) a planar explosive sheet buried a depth h under a granular medium comprising water saturated mono-sized glass spheres. Detonation of the explosive results in a column of granular media with a planar front rising and impacting the sandwich panel. The experiments measure the permanent core compression of the sandwich panel and the momentum transferred by the panel into the underlying foundation via the rise of the vertical pendulum.
quasi one-dimensional problem. The model problem of course neglects a range of complicated phenomena that are at play in the experiments including: (i) edge effects due to the lateral flow of the granular media; (ii) interaction of the high velocity granular media with the surrounding air and (iii) velocity and density gradients within the impacting sand column. However, we restrict attention to this simplified model problem in order to gain an understanding of the key physical phenomena at play. Numerical methods to solve fluid/structure interaction problems have typically focussed on a coupled Eulerian/Lagrangian approach wherein the granular media is represented within an Eulerian setting and the structure within a Lagrangian setting. However, the successful implementation of this coupled Eulerian-Lagrangian computational framework has been elusive due to computational problems associated with the analysis of low density particle sprays; see for example Wang et al. [13] for a discussion of these numerical issues. An alternative modelling strategy has recently been employed by Borvik et al. [14] and Pingle et al. [15]. In this approach the low density soil is treated as an aggregate of particles with the contact law between particles dictating the overall aggregate behaviour. On the other hand, the structure is treated as a continuum within a Lagrangian finite element (FE) setting. The media described by the discrete and continuum approaches are coupled via an explicit scheme. This approach has several advantages: (i) there is no need to make a-priori assumptions about the constitutive response of the aggregate (this becomes an outcome of the simulations), (ii) it provides a fundamental tool to study the essential physics of the sand-structure interaction and (iii) given that the sand is represented by a discrete set of particles we do not face the usual numerical problems associated with solving the equations associated with the equivalent continuum descriptions. Pingle et al. [15] have recently investigated the response of a rigid target to impact by a column of particles while in a parallel study, Borvik et al. [14] analysed the response of monolithic plates to a spherically-expanding sand shell and compared their predictions with measurements. More recently Liu et al. [16,17] have used this technique to investigate the response of clamped beams and plates subject to impact by a column of particles. In this investigation we employ the coupled discrete/continuum approach of Liu et al. [16] to investigate the problem described above.
1.1 Approach and scope
Our aim is to develop overall fundamental understanding of the fluid-structure interaction between columns of granular media and back-supported buffer plates with foam cores. We first develop a semi-analytical lumped parameter for the problem and use the model to construct mechanism regime maps. Next we describe the numerical methods developed for the discrete particle calculations, and the Lagrangian finite element (FE) simulations. The numerical results are then presented and comparisons made with the lumped parameter model in terms regimes of behaviour, core compression and momentum transfer. By using both approaches we are able to identify the physical phenomena governing momentum transfer and the effect of a foam backing on this process.
2. Regimes of behaviour
the idealised boundary value problem sketched in Fig. 3a. Consider a compound buffer plate of width W with a front face sheet of thickness h with a material density
f
ρ and a cellular core of thickness c and and density ρc, as shown in Fig. 3b. The plate rests on a rigid foundation. We consider two limiting attachment conditions of the buffer plate:
(i) The plate rests on but is not attached to the rigid foundation so that only compressive stresses may be transmitted into the foundation. We shall subsequently refer to this case as the unattached buffer plate.
(ii) The buffer plate is bonded to the rigid foundation so that tensile stresses may be transmitted into the foundation with no failure of the interface between the buffer and foundation. We shall subsequently refer to this as the attached buffer plate case. A sand slug of height H impacts the front face of the buffer plate. The slug has a uniform spatial distribution of sand particles all travelling with an initial velocity vo in the negative x2 direction. The sand slug has an initial relative density ρ and comprises particles made from a solid with density ρS. As sketched in Fig. 3a we constrain the slug from spreading laterally and it impacts the sandwich plate over its entire span at time t=0. The constraint against lateral spreading is representative of the situation near the centre of a sandwich panel loaded by a sand spray with zero obliquity. In such a situation, the sand at the periphery constrains the lateral flow of the sand at the centre. With the sandwich properties assumed to be invariant in the x1 direction, the boundary value problem reduces to a quasi one-dimensional (1D) problem for panel widths W D, where D is the representative size of the sand particles.
2.1 A lumped parameter model
Before presenting full numerical simulations for the response of the buffer plates impacted by the sand slug as illustrated in Fig. 3a, we develop a simplified semi-analytical approach to understand the response over a wide range of parameters. This semi-analytical model is analogous to the one-dimensional “lumped parameter” model developed by Deshpande and Fleck [7] for the water blast response of free-standing sandwich plates and is based on idealised one-dimensional responses for the sandwich core, face sheets and the impacting sand.
of a rigid face sheet is acceptable when the transit time for multiple elastic wave reflections in the face sheets is much less than the time for wave propagation in the core. This is an acceptable approximation in most cellular core sandwich structures where the faces are much thinner than the core.
Recall that the impacting sand slug comprises a spatially uniform relative density ρ of particles all travelling at an initial velocity vo in the negative x2 direction. Since the lateral expansion of this slug is constrained, the notional quasi-static compressive stress versus nominal compressive strain response of the slug can be idealised by the curve sketched in Fig. 4b. In this case the slug compresses up to its densification strain εS at zero stress whereupon the particles come into contact. In this simplified analysis, we specify that the slug behaves in a rigid manner beyond this densification strain. Thus, the form of the quasi-static responses of the sand slug and the core are similar with the main difference being that prior to densification, the core has a strength σc while the sand slug has no strength prior to its densification.
The key simplification in this model is that elasticity is neglected both in the buffer plate and the sand slug. This assumption implies that the predictions of this model for both the attached and unattached boundary conditions mentioned above are identical. The numerical calculations discussed in Section 3 include the effects of elasticity in both the buffer plate and the sand slug; these numerical calculations will be subsequently employed to understand the limitations of this lumped parameter model. We now proceed to analyse this simplified one-dimensional problem.
At t=0 the buffer plate is stationary while the sand slug has a uniform velocity vo in the negative x2 direction. Two distinct cases exist:
Case (I): a plastic shock wave propagates into the core after the impact of the sand slug; and
Case (II): no plastic shock wave is initiated in the core.
We shall consider each case in turn and then derive conditions for their applicability.
2.1.1 Case (I): A plastic shock wave propagates into the core
After impact, a plastic shock wave is initiated both in the core and the sand slug. These plastic shocks travel at Lagrangian speeds cf and cs in the negative and positive x2 directions within the foam core and the sand slug, respectively as indicated in Fig. 4c. After time t, these shock fronts have travelled a distance sf and
s
Let the interfacial pressure between the sand slug and the front face of the buffer plate be p while σf and
σ
S are the stresses immediately downstream from the shocks in the core and sand slug, respectively. Recalling that the densified core and sand slugs behave as rigid bodies, the equations of motion for the common velocity v are given as(mf +ρcsf)v= p−σf (2.1)
and
ρρSsSv=σS− p (2.2)
where the overdot denotes differentiation with respect to time. Conservation of momentum across the plastic shocks in the core and the sand slug dictate that the downstream stresses σf and
σ
S are related to the shock speeds via the relationsf c c fc v
σ =σ ρ+ (2.3)
and
( )
S S Sc vo v
σ
=ρρ
− , (2.4)respectively. Mass conservation across the shocks gives the plastic shock velocities in the core and the sand slug as
cf ≡sf = v
εD (2.5)
and
cS ≡sS =vo−v
εS , (2.6)
respectively. Equations (2.1)-(2.6) are a set of coupled ordinary differential equations (ODEs) for the quantities v, sf and sS that can be solved numerically with initial conditions v s= f = =sS 0 in order to get the responses of both the buffer plate and sand slug.
We proceed to analyse this further by first presenting the equations in non-dimensional form. Introduce the non-non-dimensional loading parameters
σc≡ σcεS
ρρSvo2 and ψ ≡
ρρSH
mf (2.7)
where
σ
c is the ratio of the strength of the core to the pressure exerted by the sand on a rigid-stationary structure [15] while ψ is analogous to the Taylor [6] fluid-structure interaction parameter in water blast and is the ratio of the areal mass of the sand to the areal mass of the face sheet of the buffer plate. The buffer plate is characterised by the non-dimensional groupsH H
c
≡ and f
c m m
c ρ
≡ (2.8)
Introducing a non-dimensional time t ≡tv Ho/ and a non-dimensional velocity
/
v =ψmεD(1−v) 2−Hε
Sv 2−σ
cψmεD
HεDεSsf +ψmεDεSss+mεDεS (2.9)
sf = v
εD (2.10)
and
sS =1−v
εS (2.11)
where the overdot now denotes differentiation with respect to the non-dimensional time t while sf ≡sf /c and sS ≡s HS/ . These three coupled ODEs with initial conditions v =sf = =sS 0 at time t =0 are solved numerically2 to obtain the average through-thickness core compression εc ≡sfεD as a function of t . The equations presented in this section are valid for a core that is sufficiently weak to initiate a plastic shock wave. Employing the initial condition that v >0 at t =0+ we see from Eq. (2.9) that the condition for a plastic shock wave initiation is
σ
c <1.The above set of equations is valid if
σ
c <1 and until one of the following events occur:Event (i): The plastic shock wave in the core reaches the rear end of the core (i.e. 1
f
s = ) resulting in full densification of the core.
Event (ii): The plastic shock within the sand slug reaches the top free surface of the slug (i.e. sS =1) resulting in the complete densification of the sand slug.
We note in passing that with
σ
c <1, plastic shocks cannot arrest in either the core or the sand slug prior to the occurrence of one of the two events above. This is rationalised as follows:(a) The condition for the shock to arrest within the core is v =v =0. Substituting 0
v = in Eq. (2.9) and recalling that
σ
c <1 we observe that v >0 when v =0. Thus, the shock cannot arrest within the core while Eqs. (2.9) to (2.11) are valid.(b) The conditions that must be met for the shock to arrest within the sand slug are 1
v = with v =0. Substituting v =1 in Eq. (2.9), we observe that v <0 indicating that the shock cannot arrest within the sand slug while Eqs. (2.9) to (2.11) are valid. We shall now consider each of the above two events in turn.
2.1.2 Event (i): Governing equations after full densification of the core
Consider Event (i) described above such that a plastic shock reaches the rear end of the core at time t =t0 when sS =sS0 <1, i.e. the sand slug has not yet fully densified. With elasticity in the core and the face sheet neglected in this model we assume that the front face sheet is instantaneously brought to rest at time t =t0 and the buffer plate now behaves as a rigid body, i.e. v=0 with only plastic shock wave propagation within the sand slug. With v=0, Eqs. (2.2), (2.4) and (2.6) reduce to
2 The MATLAB function ode23 based on an automatic step-size Runga-Kutta-Fehlberg integration
2 o
S S
S
v p σ ρρ
ε
= = (2.12)
This equation is valid until the sand slug fully densifies at time t = +t0 H(1−sS0) /vo
whereupon the pressure p=0.
2.1.3 Event (ii): Governing equations after full densification of the sand slug.
Consider Event (ii) described above such that complete densification of the sand slug occurs at time t =t1 while the plastic shock wave is still propagating within the core. At time t1 the shock wave within the core is located at sf =sf1<1 and the common velocity upstream from the shock is v1. For times t >t1, we assume that the densified sand slug behaves as a rigid mass attached to the front face of the buffer plate. The equations governing the response of the buffer plate as given in Section 2.1.1 can then be simplified by not accounting for plastic shock wave propagation within the sand slug, i.e. Eqs. (2.1), (2.3) and (2.5) remain unchanged and Eq. (2.2) reduces to
ρρSHv=−p (2.13)
with
σ
S = =cS 0. In non-dimensional form the overall governing equations for the response of the buffer plate are then give as(m+ψm+Hsf)v =−(σcmψ
εS +sfHv) (2.14) and
sf = v
εD (2.15)
with initial conditions sf =sf1 and v v= 1 at time t1 when the sand slug was fully densified. Here again the overdot denotes differentiation with respect to the non-dimensional time t . Equations (2.14) and (2.15) are valid until one of the two following events occur:
Event (ii-a): The plastic shock arrests within the core, i.e. sf =0 with sf <1. At this instant the deformation ends with all components having been brought to rest.
Event (ii-b): The plastic shock wave impinges on the foundation, i.e. sf =1 with
sf >0. In line with the assumptions detailed in Section 2.1.2 we neglect any subsequent rebounding of the buffer plate and assume all components are instantly brought to rest when the plastic shock wave in the core reaches the rear end of the core.
2.1.4 Case (II): No plastic shock wave is initiated in the core
When
σ
c <1, no plastic shock wave is initiated in the core and the sand slug exerts the pressure given by Eq. (2.12) from t =0 until densification of the slug at time1
t = , whereupon the pressure drops to zero.
2.2 Regime maps
compression. The analysis of Section 2.1 suggests four regimes of behaviour based on the sequence of the compression of the core and the sand slug:
(i) Regime I: Densification of the core followed by densification of the sand slug. (ii) Regime II: Densification of the sand slug followed by densification of the core. (iii) Regime III: Densification of the sand slug followed by end of core
compression without complete densification of the core, (i.e. the plastic shock wave arrests within the core and does not reach the rear face).
(iv) Regime IV: Densification of the sand slug with no shock wave initiated in the core.
The final (or maximum) average through-thickness core compressive strain in the core max
D c
ε =ε in regimes I and II while max 0 c
ε = in regime IV. The maximum core compression varies over the range 0 max
c D
ε ε
≤ ≤ in regime III.
Consider a buffer plate with m=1, impacted by a sand slug with relative density
0.2
ρ = . Maps illustrating these regimes of behaviour with axes of non-dimensional core strength
σ
c and slug height H are plotted in Figs. 5a and 5b for the choices of the fluid-structure interaction parameter ψ =0.7 and 10, respectively. In plotting these maps we assumed that the core densification strainε
D =0.8 while the densification strain for the sand is given asmax 1 s ρ ε ρ
= − (2.16)
where
ρ
max is the maximum packing density of the sand particles. Here we takemax 0.9
ρ
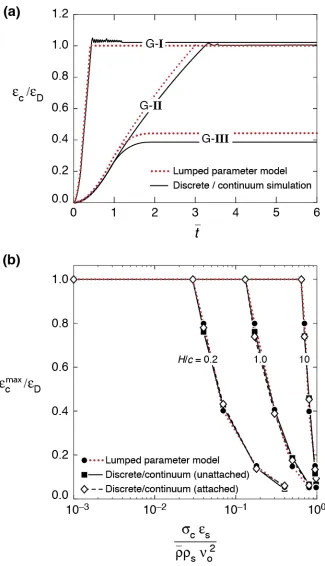
= so as to match the maximum packing density of an array of identical discs or cylinders; such discs are used in the numerical calculations reported in Section 3. The main effect of increasing the value of ψ from 0.7 to 10 is the area of the map occupied by regimes II and III shrinks with regime I now dominating the map. For a fixed face sheet mass per unit area, a higher value of ψ implies that the amount of sand impacting the plate increases, i.e. the length of the sand slug increases. This longer sand slug takes more time to fully densify and thus core compression is completed before densification of the sand slug over a larger portion of the map. In order to illustrate the core compression behaviour predicted by the lumped parameter model, we now consider the map in Fig. 5a and select four representative geometries in regimes I to IV, we shall refer to these as geometries G-I, G-II, G-III and G-IV, respectively. These geometries are marked by open circles in Fig. 5a. The predicted evolution of the normalised average through-thickness core compression/ D c
ε ε
with normalised time t is plotted in Fig. 6a. Geometries G-II and G-III have approximately equal initial compression rates but geometry G-III attains a maximum value max / 0.35c εD
ε ≈ while core compression in geometry G-II continues until there is complete densification of the core with max / 1
c D
ε ε = . The higher value of H for geometry G-I means that G-I undergoes a higher initial compression rate with core compression ending when max / 1
c D
ε ε = . Contours of the normalised core compression max /
D c
ε ε are included in regime III in Fig. 5(recall that max / 1
c D
ε ε = in
regimes I and II and max / 0
c D
ε ε = in regime IV) and indicate that max c
smoothly from max 0 c
ε = at the regime III and IV boundary to max / 1 c D
ε ε = at the boundaries between regimes III and regimes I and II.
In order to illustrate the effect of core strength on core compression more clearly, we plot the core compression max /
D c
ε ε as a function of
σ
c by taking three slices through the map in Fig. 5a at H =0.2, 1 and 10. These slices are included in Fig. 6b and indicate that while the transition from no compression ( max / 0c D
ε ε = ) to full core compression (εcmax /ε
D=1) occurs rather abruptly when σc decreases from 1 to 0.8
for the H =10 case. By contrast, the transition is much more gradual for the lower values of H. This arises becasue intermediate values of core compression occur only in Regime III and this regime is expanded by decreasing H; see Fig. 5a.
2.3 Momentum transfer
With elasticity in both the buffer plate and the sand slug neglected in the lumped parameter model we assume that no bounce-back of the buffer plate or sand slug occurs even for the unattached buffer plates. Thus, the model predicts the total areal momentum total
t
I transferred to the foundation equals the momentum Io =
ρρ
SHvo ofthe incoming sand slug, i.e. total / 1
t o
I I = in all cases. This is a major drawback of the lumped parameter model and we now develop coupled discrete/continuum simulations where elasticity effects in both the buffer plate and sand slug are included.
3. Coupled discrete particle/finite element calculations
The simplified lumped parameter model presented in Section 2 gives a broad overview of the response of back-supported buffer plates and makes predictions of the core compression. However, there are a number of simplifying assumptions in the model which include:
(i) Elasticity of the face sheet, core and densified sand aggregate is neglected. This implies that the model predicts that the momentum transmitted into the foundation is equal to the initial momentum of the sand slug over all values of the parameters in the problem.
(ii) The model cannot differentiate between the attached and unattached boundary conditions of the buffer plate.
In this section we present two-dimensional (2D) calculations where the sand slug is modelled by a large number of discrete identical cylindrical particles, while the buffer plate is modelled as a 2D continuum with an elastic face sheet and a foam core. These 2D calculations have the required level of sophistication to account for bounce-back effects of the buffer plate and the sand slug and thus provide an indication of the fidelity of the lumped parameter model and the regimes within which that simplified model provides accurate predictions.
3.1 Summary of the numerical procedure
strain Lagrangian finite element framework. We shall briefly describe each of these methodologies followed by details of the coupling of these two techniques.
Discrete particle calculations: The granular medium was modelled by a random array of 2D cylindrical particles, each of diameter D lying in the x1−x2 plane (unit thickness in the x3-direction); see Fig. 3a. The granular package in LAMMPS is based on the soft-particle contact model as introduced by Cundall and Strack [23] and extended to large scale simulations by Campbell and co-workers [24,25]. This soft-particle contact model idealises the deformation of two contacting soft-particles, each of mass mp, as depicted in Fig. 7. The contact law comprises:
(i) a linear spring Kn and a linear dashpot of damping constant γn in parallel, governing the normal motion and
(ii) a linear spring Ks and a Coulomb friction element of coefficient µ, in series, governing the tangential motion during contact.
The contact forces in the normal and tangential directions are now specified as follows. Write
r
as the separation of particle centres andδ
n =r D− as the interpenetration. During active contact(
δn <0)
, the normal force is given byFn=Knδn+meffγnδn (3.1) where meff is the effective or reduced mass of the two contacting bodies. We take
/ 2
eff p
m =m for impacts between particles, and meff =mp for impacts between a particle and the plate.
The tangential force Fs only exists during active contact, and opposes sliding. It is limited in magnitude to |Fs |<
µ
|Fn| as follows. Define δs as the tangential displacement rate between the contacting particles. Then, Fs is given by an “elastic-plastic” relation of Coulomb type;
Fs = Ksδs if |Fs|<µ|Fn| or Fsδs <0
0 otherwise ⎧
⎨ ⎪
⎩⎪ (3.2)
The value of damping constant γn dictates the loss of energy during normal collision and is directly related to the coefficient of restitution e according to
1/2
2 8
exp n 1
n p K e m π γ − ⎡ ⎛ ⎞ ⎤ ⎢ ⎥ = − ⎜⎜ − ⎟⎟ ⎢ ⎝ ⎠ ⎥ ⎣ ⎦
. (3.3)
The collision time for individual binary collisions te follows from (3.1) as 2 ln( )
e
n e t
γ
=− . (3.4)
translational and rotational motions of the particles were obtained by integration of the accelerations using a Verlet time-integration scheme (i.e. Newmark-Beta with β=0). The time-step within LAMMPS was typically taken to be te/10 in order to ensure accurate integration of the contact relations, Eqs. (3.1)-(3.2), and this value was also used to define the time steps for the finite element calculations, as described below.
2D finite element calculations: The 2D plane strain calculations were performed using an updated Lagrangian finite element (FE) scheme with the current configuration at time t serving as the reference. The co-ordinate xi denotes the position of a material point in the current configuration with respect to a fixed Cartesian frame, and vi is the velocity of that material point. For the plane strain problem under consideration, the principle of virtual power (neglecting effects of gravity) for a volume V and surface S is written in the form
σijδεijdV = S TiδvidS−
T
∫
V∫
ρδviδviV
∫
dV (3.5)where σij is the Cauchy stress, εij ≡0.5
(
vi,j+vj,i)
is the strain rate, Ti the tractions on the surface ST∈S due to the impacts of the particles while ρ is the material density in the current configuration. The symbol δ denotes arbitrary virtual variations in the respectively quantities. A finite element discretisation based on linear, plane strain three node triangular elements (i.e. constant strain triangles) is employed. When the finite element discretisation of the displacement field is substituted into the principle of virtual power (3.5) and the integrations are carried out, the discretised equations of motion are obtained as2 2 t ∂ = ∂ U
M F (3.6)
where U is the vector of nodal displacements, M is the mass matrix and F is the nodal force vector. An explicit time integration scheme based on the Newmark β-method with β =0 was used to integrate Eq. (3.6) to obtain the nodal velocities and the nodal displacements. A lumped mass matrix is used in (3.6) instead of a consistent mass matrix, since this is preferable for explicit time integration procedures, for both accuracy and computational efficiency.
Coupling of the discrete and finite element calculations: At time t, contact between the particles and the plate in its current configuration was detected. The displacement
n
positions and velocities of the particles in the discrete calculations and material points in the finite element calculations determined at time t+Δt.
3.2 Boundary value problem and material properties
In the numerical calculations we analysed the impact of the sand slug on the buffer plate comprising an elastic face sheet and a foam core as well as a reference elastic block as sketched in Figs. 3b and 3c, respectively. The calculations are carried out in a 2D setting with deformations of the plates occurring in the x1−x2 plane shown and unit thickness in the x3-direction.
Two boundary conditions are considered for both the elastic block and the buffer plate: (i) In the unattached case the structures (i.e. the elastic blocks or buffer plates) were assumed to rest on the rigid foundation with no penetration permitted into the foundation. However, the structures could loose contact with the foundation as the interface between the structures and the foundation was assumed to sustain no tensile stresses.
(ii) In the attached case the bottom surface of the elastic block as well as the buffer plate were fixed to the foundation, i.e. displacements u2=0 in the
2
x direction, were specified over the bottom surfaces of the structures.
The elastic block and buffer plate of width W (unit thickness in the x3 direction) are impacted by a sand slug also of width W and height H as shown in Fig. 3a. The slug comprises an initial spatially uniform relative density ρ of cylindrical particles and is constrained against lateral expansion by two rigid walls located at x1=(0, )W
as shown in Fig. 3a. Also consistent with this no lateral spreading constraint of the sand slug, we also prevent lateral expansion of the plates by imposing the displacement boundary condition u1=0 on x1=(0, )W for both the plate types.
Material properties: The sand slug comprised identical cylindrical particles of diameter D=200µm and unit thickness in the x3 all travelling with an initial velocity 400 ms 1
o
v = − in the negative x2 direction. The sand particles are made from a solid material of density 2700 kg m-3
s
ρ = . The normal stiffness between the particles was taken to be 7300 kNm-1
n
K = and the co-efficient of restitution for both impacts between the particles and the particles and the plates was taken to be e=0.7
(i.e. the value of γn for inter-particle contacts was twice that for impacts between the particles and the walls). Following Silbert et al. [26] we fixed the ratio K Ks/ n =2 / 7 and the reference value of the friction co-efficient was assumed to be µ=0.7. We note in passing that similar to the findings of Pingle et al. [15] for the impact of sand slugs against rigid targets, the results reported subsequently for impact of sand slugs against the buffer plates are also not sensitive to the choice of these inter-particle contact properties. Unless otherwise specified, the sand slug had a spatially uniform initial relative density ρ =0.2.
3
8000 kgm m
ρ = − , Young’s modulus E=210 GPa and Poisson’s ratio ν =0.3 which is representative of steel. The thickness cb of the block and the height H of the sand slug were varied in the parametric study reported in Section 3.3. The numerical calculations for the sand impact against the buffer plate were designed keeping in mind the regime maps presented in Section 2. In particular, in all the calculations reported here we kept ψ =0.7 , m=1 and ρ=0.2 fixed and varied the non-dimensional core height H and the core strength
σ
c varied over a wide range. This was achieved by varying the parameters H, c,ρ
c andσ
c which will be specified on a case by case basis. We now proceed to detail the properties that remain fixed in all the calculations reported.The buffer plate comprises a front face sheet of thickness h=10 mm made from the same material as the elastic block described above, i.e. an elastic material with density
3
8000 kgm m
ρ = − , Young’s modulus E=210 GPa and Poisson’s ratio ν =0.3, i.e. mf =8 kgm-2
. The core of density
ρ
c is modelled as a homogeneous compressible visco-plastic orthotropic foam-like material following Tilbrook et al. [27]. Assume the orthotropic axes xi of the core are aligned with the axes of the buffer plate as sketched in Fig. 3a, i.e x1 and x2 are aligned with the longitudinal and transverse directions, respectively. Introduce the stress and plastic strain matrices in the usual way asT
T ( , , , , , )
) , , , , ,
(σ1 σ2 σ3 σ4 σ5 σ6 ≡ σ11 σ22 σ33 σ13 σ23 σ12 =
σ , (3.7)
and T p p p p p p T p p p p p p
p ( , , , , , ) ( , , , , , ) 12 23 13 33 22 11 6 5 4 3 2
1 ε ε ε ε ε ε ε ε ε ε ε
ε ≡
=
ε , (3.8)
respectively. Assume complete decoupling of material response between the orthogonal material directions and define the plastic strain rate p
i
ε via an overstress relation as ⎪ ⎩ ⎪ ⎨ ⎧ > ⎟⎟⎠ ⎞ ⎜⎜⎝ ⎛ − = otherwise, 0 ) ( | | if ) ( | | p i i i p i i i p i Y Y ε σ η ε σ
ε (3.9)
where the yield strength ( p) i i
Y ε is a function only of the plastic strain p i
ε and the material viscosity η is taken to be a constant. The total strain rate εi is obtained by supplementing the above anisotropic plasticity model with isotropic elasticity such that ) over summation ( ) ( sign j L i p i j ij
i σ ε σ
ε = + . (3.10)
⎟ ⎟ ⎟ ⎟ ⎟ ⎟ ⎟ ⎟ ⎠ ⎞ ⎜ ⎜ ⎜ ⎜ ⎜ ⎜ ⎜ ⎜ ⎝ ⎛ + + + − − − = c c c c c c c c c c c c c c c E E E E E E E E E / ) 1 ( 2 0 / ) 1 ( 2 sym 0 0 / ) 1 ( 2 0 0 0 / 1 0 0 0 / / 1 0 0 0 / / / 1 ν ν ν ν ν ν L (3.11)
We employ an isotropic elastic response for simplicity; this suffices as the core response of dictated by the plastic branch. The above elastic-plastic constitutive relation is expected to be adequate to model sandwich cores such as the square-honeycomb core or the corrugated core; see for example Xue et al. [28].
In all the calculations reported here we assume an isotropic plastic response in the sense that the all the strengths Yi are assumed to be equal and strain hardening is neglected in all directions other than the transverse direction. The transverse strength
σc=Y2 is assumed to be independent of the plastic strain
p
2
ε
up to a nominal densification strainε
D: beyond densification a linear hardening behaviour is assumed with a very large tangent modulus Et =0.1E. In all the calculations reported here the modulus and Poisson’s ratio of the core were fixed at Ec =20 GPa andν
c =0.25, respectively and independent of the core densityρ
c. Further, consistent with the lumped parameter model calculations presented in Section 2 we assume that the densification strain is independent of the foam core density withε
D =0.8. Finally, we note that the viscosity η of the core was chosen such that the shock width (Radford et al., 2005)o c D v l ρ ηε
= , (3.12)
equals c/10, with vo interpreted as the initial impact velocity of the sand particles.
This prescription ensures that the shock width is always much less than the core depth yet is larger than the mesh size. Note that large gradients in stress and strain occur over the shock width and thus a mesh size smaller than l is required to resolve these gradients accurately.
The buffer plates were discretised using quadrilaterals comprising four constant strain triangles with elements of size h/ 5 and c/ 40 in the face sheet and core, respectively while the element size employed in the elastic block was cb/ 40.
3.3 Response of the reference elastic block
One of the drawbacks of the lumped parameter model was that it did not include the effect of elasticity of the sand slug or the buffer plate and hence was unable to differentiate between the attached and unattached boundary conditions. In this section we discuss the response of a sand slug impact both the attached and unattached elastic block so as to illustrate the effects of elasticity in a relatively simple setting.
2 , , , , , /
S t b o m
t
s o m s
p c v
p f t
v H E
ε ρ ρ ν
ρρ ρ ρ
⎡ ⎤
≡ = ⎢ ⎥
⎢ ⎥
⎣ ⎦, (3.13)
The spatial average pressure pf exerted by the sand slug over the impacted face of the elastic block is also a function of the same non-dimensional parameters and is thus given as
2 , , , , ,
/
S b o m
s o s
f f
m
p c v
p g t
v H E
ε ρ ρ ν
ρρ ρ ρ
⎡ ⎤
≡ = ⎢ ⎥
⎢ ⎥
⎣ ⎦. (3.14)
Here εS is the densification strain of the sand slug and given by Eq. (2.16) to a very high degree of accuracy. While pt is calculated directly from the reaction force R
exerted by the plate on the foundation, pt ≡R W/ where R is the reaction force exerted by the block per unit thickness in the x3-direction, pf is calculated as follows. At any time t, there are M sand particles in contact with the elastic block and pf is given as 2 1 ( ) M i i f F p t W =
=
∑
(3.15)where F2i is the contact force (per unit depth in the
3
x direction) in the x2 direction between the ith sand particle and elastic block.
The normalisations for the pressures in Eqs. (3.13) and (3.14) have been chosen so that pf = pt ≈1 over the duration 0≤t
ε
S ≤1 for impact of the slug against a rigid plate (recall that Pingle et al. [15] established that the steady-state pressure exerted by the sand slug on a rigid stationary target is approximately 2 /s ov S
ρρ ε and is exerted until the densification front reaches the distal end of the sand slug at time
/
S o
t H=
ε
v ). All results here are for a sand slug of height H=10 mm impacting the elastic block with material properties detailed in Section 3.2.First consider the unattached case. The predicted variation of the normalised pressures pf and pt versus the normalised time t
ε
S are plotted in Figs. 8a and 8b for the choices cb/H =0.4 and 50, respectively and a sand impact velocity1
400 ms o
v = − (i.e. vo/ E/ρm =0.08). As will be clarified subsequently, the cb/H =0.4 and 50 cases represent two limiting scenarios for the given sand slug
loading. In the cb/H =0.4 case, both pf and pt drop to zero at times t
ε
S >1. Over the period 0≤tε
S ≤1, pf and pt have an oscillatory response (the oscillations are larger in pf) but the mean values of both these pressure are approximately equal such that pf ≈ pt ≈13. These results indicate thatapproximately like a rigid body with multiple elastic wave reflections between the front and the rear end of the block resulting in approximate equilibrium conditions being attained, i.e. pf ≈ pt. Thus, the cb/H=0.4 case represents the limit where the loading time of the sand slug is much larger than the transit time for the elastic waves through the block. In this limit the elastic block may be approximated as a rigid body. Next consider the cb/H =50 case. Again, pf ≈1 over the 0≤t
ε
S ≤1 whereafter the pressure exerted by the sand slug reduces significantly. However, over this entire duration the transmitted pressure pt =0 as the elastic wave that initiates after the sand slug impacts the block at t=0 has not yet reached the rear end of the block at time tε
S =1. Infact, the elastic wave reaches the rear end of the block at timetεS ≈5, i.e. well after the sand slug has densified and bounced off the elastic block. This elastic wave then reflects from the block/foundation interface and thereby transmitting a pressure into the foundation equal to twice pf. The duration of this transmitted pressure is equal to the time taken for the sand slug to densify, i.e. the duration is approximately given by H
ε
S /vo. Hence over this period , Hε
S /vo, the momentum transmitted into the foundation is twice the momentum transferred by the sand slug into the elastic block. The reflected compressive wave then travels towards the front end of the elastic block and reflects as a tensile wave from the free surface. Upon reaching the rear of the block, the tensile wave results in loss of contact between the block and the foundation with the block “bouncing-off” the foundation (recall no tensile stresses can be transmitted across that interface in this unattached case). The final momentum transmitted into the supports is thus twice the momentum of the incoming sand slug, with the additional transferred momentum accounted for by the bounce-off of the elastic block. Thus, the cb/H=50 case represents the limit where the loading time of the sand slug is much less than the transit time for the elastic waves through the block. In this limit the loading may be approximated as impulsive and results in a significant rebound of the elastic block.Now consider the attached case. The temporal predictions of pf and pt are included in Figs. 9a and 9b for the cb/H =0.4 and 50, respectively. Consistent with the fact that the cb/H=0.4 behaves similar to a rigid block, the predictions of the pressures
f
attached and unattached cases are similar up to tεS ≈15. At this point the tensile stress wave impinges on the interface between the block and the support. In the unattached case this resulted in loss of contact between the block and the support with the block bouncing off the support. However, in the attached case the interface can sustain tension which results in a rectangular negative pt pulse with a magnitude and duration equal to the earlier compressive pulse. This pulse thus cancels out the momentum that was transmitted by that earlier compressive pulse resulting in the net momentum transmitted into the support temporarily reducing to zero just after the end of this tensile pulse. However, with no dispersion of the wave within the elastic block, the tensile and compressive pulses continue to get alternatively transmitted into the foundation.
The predictions of transmitted areal momentum
0
( ) t
t t
I t =
∫
p dt (3.16)normalised by the incoming momentum Io ( It ≡It/Io) of the sand slug are included in Figs. 10a and 10b for the cb/H =0.4 and 50 cases respectively for both the attached and unattached cases. Consistent with the transmitted pressure histories plotted in Figs. 8a and 9a for the cb/H =0.4 case, It increases monotonically and plateaus-out at I It / o≈1 with the extra 5% transmitted momentum due to rebound of the sand particles as discussed by Pingle et al. [15]. Further, the results are nearly identical for the attached and unattached cases expect for the small oscillations in the attached case about the steady-state value It/Io due to the fact that pt oscillates between positive and negative values due to internal reflections of elastic waves as seen in Fig. 9a. By contrast, the build-up of momentum It in the attached and unattached cb/H =50 blocks are markedly different. The I It / o curves are identical until the tensile elastic reflection discussed above reaches the rear end of the block at
tεS ≈15. Thereafter the unattached block loses contact with the foundation and the
momentum transferred into the foundation remains constant at I It / o ≈2. However, in the attached case the transmitted pressure is now tensile which results in a reduction in It to zero. The transmitted momentum I It / o then oscillates periodically between 0 and 2 in-sync with the compressive and tensile elastic wave reflections within the elastic block.
We define Itavg as the time-averaged transmitted momentum (where we average over
10 oscillations in the It versus time curves). Predictions of Itavg ≡I t
avg /I
o are plotted in Fig. 11 as a function of the quantity
S
b o m H E c v
ε τ
ρ
≡ . (3.17)
into the foundation, especially in the unattached case. Results are included in Fig. 11 for two values of the normalised sand impact velocity vo/ E/ρm =0.04 and 0.08 corresponding to vo=400 ms−1 and 200 ms−1, respectively for both the attached and unattached cases.
First consider the attached case. The transmitted momentum Itavg /I
o≈1 over the entire parameter range considered here, i.e. Itavg /I
o is independent of τ and / /
o m
v E ρ . Next consider the unattached case. Here Itavg /I
o displays a strong dependence on τ and the two limits discussed above are clearly seen: τ >10 corresponds to the rigid block limit with Itavg /I
o ≈1 while the τ <1 limit is impulsive limit with Itavg /I
o ≈2. At intermediate values of τ , It avg /I
o increases with
decreasing τ . Again, there is only a mild dependence on vo / E/ρm. Detailed numerical calculations were performed to confirm that Itavg /I
o is only dependent on the boundary conditions (viz. attached or unattached) and the ratio of time-scales τ but reasonably independent of all the other non-dimensional groups in Eqs. (3.13) and (3.14). We note in passing here that while Itavg /I
o differ for the attached and unattached cases in the τ <1 limit the maximum transmitted transient momentum are equal in both these cases with Itmax /I
o ≈2.
3.4 Selected numerical results for the buffer plate in the four regimes
We proceed to illustrate the responses of both the attached and unattached buffer plates by first presenting numerical calculations for the four geometries labelled G-I through G-IV in Fig. 5a, i.e. ρ =0.2, ψ =0.7 and m=1 the parameters are held fixed. In these calculations the sand slugs have a height H=ψmf / (ρρs)=10 mm
while the values of the parameters c,
ρ
c andσ
c for geometries G-I through G-IV are chosen to achieve the appropriate values of σc and H. All calculations were performed for a sand impact velocity vo =400 ms−1.We characterise the responses of buffer plates in terms of the following five quantities: (i) the core compression defined as
ε
c ≡ Δc c/ , where Δc is the reduction in the overall thickness of the core;(ii) the pressure pt at the interface between the foam core and the foundation;
(iii) the pressure pf exerted by the sand slug on the front face of the sandwich plate; and
(iv) the momentum It transferred into the foundation.
core). Hence results for geometry G-IV are not included in Fig. 6a. We now discuss in detail in responses of the unattached buffer plates and then subsequently illustrate the key differences that occur when the buffer plates are attached to the foundation.
Geometry G-I in regime I: The temporal variation of the normalised pressures pt≡ ptεs / (ρρsvo
2) and p
f ≡ pfεs/ (ρρsvo
2) are plotted in Fig. 12a for the unattached
case, while snapshots showing the deformation of the buffer plate and sand slug at four selected values of time t are included in Fig. 12b. For times t <0.3, both pf
and pt are approximately constant. During this time a densification wave traverses through the core and hence the buffer plate only transmits a stress pt ≈σc pf into the foundation. Further, the pressure pf exerted by the sand on the buffer plate is also approximately constant with ( 2) /
s
f s o
p ≈ ρρ v ε as the front face acquires a rather small velocity. At t ≈0.3, the densification front reaches the rear resulting in the so-called “slap” event where the front face slaps into the foundation through the now completely densified core. This results in a sudden increase in pt to levels significantly above ( 2) /
s ov s
ρρ ε . An elastic compressive wave now traverses from the rear to the front face. The wave then imparts a velocity in the positive x2-direction to the front face that results in the observed sudden increase in the interfacial pressure
f
p . This compressive wave reflects from the interface between the front face sheet and the sand slug as a tensile wave which upon reaching the rear face of the buffer plate results in the plate bouncing off the foundation. However, there is continued loading of the buffer plate by the sand slug which results in multiple impacts and rebounds of the densified buffer plate against the foundation. This continues until
1
t ≈ when the sand slug also densifies. Subsequently, the sand slug rebounds off the buffer plate and both the buffer plate and sand slug now acquire a steady-state velocity so that contact between the sand slug and the plate and between the plate and the foundation is not established again.
The corresponding temporal evolution of the normalised core compression
ε ε
c / D and transmitted momentum I It / o are included in Figs. 6a and 13a, respectively. We clearly observe that there is negligible momentum transfer prior to core densification at t ≈0.3. Subsequently, It builds-up in three distinct spurts corresponding to the spikes in pt seen in Fig. 12a, i.e. momentum transfer in geometry G-I is governed by the “slap” event and the subsequent impacts of the buffer plate against the foundation. However, the maximum momentum transferred to the foundation Itmax/Io ≈1, i.e. equal to the incoming momentum of the sand slug.
o
v . At t ≈1, the sand slug fully densifies as the densification front within the sand slug reaches the top of the slug and there is a sudden drop in the interfacial pressure pf. The densification front within the sand slug reflects from the top end as a tensile front resulting in sand spalling-off the top end of the slug; see Fig. 14b. Meanwhile, the densification wave initiated in the core continues to transverse towards the rear face resulting in continued core compression. During this time the buffer plate transmits a pressure pt ≈
σ
c to the foundation (recall that σc ρρSv02 that thus in
Fig. 14b it seems as if pt ≈0). At t ≈3, the densification front within the core reaches the rear end resulting in a “slap” event and a sudden increase in both pt and
f
p similar to that discussed for geometry G-I. Shortly thereafter, the buffer plate rebounds off the foundation and a steady-state (with no contact between the buffer plate and the foundation or the sand slug and the buffer plate) is attained. Unlike geometry G-I, multiple impacts between the buffer plate and the foundation do not occur as the sand slug had densified and hence stopped loading the plate prior to core densification. This results in the majority of the momentum transfer to the foundation occurring during the single slap event that occurs at the instant of full densification; see Figs. 14a and 13a. Note that the total momentum transfer is significantly higher compared to geometry G-I (in geometry G-II, Itmax/I
o ≈1.5 compared to It
max /I
o ≈1.1 for geometry G-I).
Geometry G-III in regime III: The temporal variation of the normalised pressures pt and pf are plotted in Fig. 15a while snapshots showing the deformation of the buffer plate and sand slug at four selected values of time t are included in Fig. 15b. Similar to geometry GII, the pressure pf reduces with time as the velocity vf increases and then suddenly drops to approximately zero at t ≈1 when the densification front within the sand slug reaches the top end of the slug. However, the stronger core in geometry G-III compared to geometry G-II, results in the deceleration of the front face and hence reloading of the buffer plate by the sand slug as seen in Fig. 15a. This reloading however results in significantly lower pressures compared to the loading prior to the densification of the sand slug. The pressure pt exerted by the buffer plate on the foundation is equal to the strength
σ
c of the foam core over the entire duration of the impact event- the densification front in the core arrests before it reaches the foundation and hence there is no dramatic increase in pt as in cases G-I and G-II. The deformation of the buffer plate without full densification (the maximum value ofc
ε is approximately 0.3 as seen from Fig. 3a) results in a “soft catch” mechanism whereby the buffer plate slowly brings the sand slug to rest. This reduces the spalling of the sand so that Itmax/I
o≈1 as seen in Fig. 13a, i.e. there is effectively a perfectly plastic collision between the sand slug and the buffer plate. We note in passing that momentum conservation dictates that Itmax/I
Geometry G-IV in regime IV: This geometry has a sufficiently strong core that no plastic deformation initiates within the core under these impact conditions. The problem thus reduces to the impact of the sand slug against an elastic plate resting on a rigid foundation. Thus, pf ≈1 until the sand slug fully densifies at t ≈1 where-after the pressure drops to zero (Fig. 16a). The transmitted pressure pt displays large oscillations with time due to elastic stress waves running between the front face and the foundation (Fig. 16a). These elastic stress waves also get partially transmitted into the sand slug and cause the low amplitude oscillations seen in the pf time traces. Snapshots showing the deformation of the sand slug included in Fig. 16b confirm that the situation is equivalent to the impact of the sand slug against a rigid plate.
For geometry G-IV, the maximum transmitted momentum into the foundation It
max/I
o ≈1.15 (Fig. 13a), and is equal to that transmitted into a rigid foundation (i.e. the elasticity does not affect the total momentum transfer to any significant extent as G-IV is in the τ ≈1 regime). As discussed above, the transmitted momentum is greater than Io due to the spalling of the sand which results in the sand slug bouncing off the buffer plate. There is no permanent core compression for geometry G-IV with the calculations predicting only elastic core compression strains less than about 1%. We thus do not include the core compression predictions in Fig. 3.
The main difference between the attached and unattached cases is that the attached buffers plates do not loose contact with the foundation and can transmit a tensile force. The front face pressures pf for the four attached geometries G-I through G-IV are nearly identical to the unattached cases plotted in Figs. 12a, 14a, 15a and 16a. However, the transmitted pressures differ, with the pressures in the attached case becoming tensile over the time intervals where pt =0 due to loss of contact between the buffer plate and the foundation in the unattached case. The corresponding predictions of the temporal evolution of the transmitted momentum I It / o are included in Fig. 13b. Unlike the unattached case (Fig. 13a), It can decrease with increasing time due to the transmission of tensile forces into the foundation. In fact, the steady-state situation always corresponds to an oscillating It versus time response due to continued elastic wave reflections within the buffer plate after the sand slug has lost contact with the plate.
3.5 Predictions of transmitted momentum
We now present detailed predictions of the transmitted momentum for the buffer plate geometries considered in the map in Fig. 5a, viz. ρ =0.2, ψ =0.7 and m=1. Predictions of Itavg /I
o as a function of the normalised core strength
σ
c are includedin Figs. 17a and 17b for the unattached and attached cases, respectively. (Recall that It
avg is defined as the average momentum over 10 periodic oscillations of the t
I
versus time curve.) The limit of the sand slug impacting the rigid stationary foundation is also included in Fig. 17 with Itavg/I
o ≈1.1 due to the rebound of the