Cafestol extraction yield from different coffee brew mechanisms
Chen Zhang, Robert Linforth, Ian D. Fisk
⁎
Division of Food Sciences, University of Nottingham, Sutton Bonington Campus, Sutton Bonington, Loughborough, Leicestershire, LE12 5RD, United Kingdom
a b s t r a c t
a r t i c l e i n f o
Article history:
Received 13 February 2012 Accepted 28 June 2012
Keywords: Coffee Extraction Beverage Food
The extraction yield of cafestol from roast and ground (R&G) coffee beans was evaluated using brews pre-pared by four brewing mechanisms (boiled, Turkish, French Press and Mocha Pot). The cafestol content of the R&G coffee and the resulting brews was measured and extraction yield calculated. The R&G coffee had an average cafestol content of 603 mg/100 g R&G coffee with a slight reduction at higher roast intensities. In the brews, preparation method had an impact on cafestol concentration with French, Turkish and boiled preparation methods producing the highest cafestol concentrations. The extraction yield of cafestol was shown to be dependent on the brew mechanism and roasting time, with the lightest roast coffee prepared by French press or boiled preparations having the highest cafestol extraction yield (6.5% and 5.84%) and dark roast Mocha and Turkish preparations had the lowest extraction yields of 2.42% and 2.88% respectively.
1. Introduction
Coffee is a globally consumed beverage and is prepared in a wide variety of formats including Scandinavian‐type boiled coffee, dripfi l-tered coffee, instant or soluble coffee and espresso. Within each class of brew preparation method, individual population groups consume coffee in a range of formats (e.g. 37 °C–88 °C Lee, Carstens, & O'Mahony, 2003), 0%–80% milk (Lee & O'Mahony, 2002), 0 g–16 g of sugar, 25 mL–880 mL in volume (Hsu & Hung, 2005), with or
with-out milk, foamed milk, cream, ice, flavourings, brew adjuncts or
co-adjuncts (Fisk, Massey, & Hansen, 2011; Massey, Fisk, & Henson, 2011).
Coffee brew contains a wide range of components including medium‐to long‐chain polysaccharides, melanoidins, volatile aroma compounds and lipid like compounds with a range of positive, nega-tive and neutral health benefits (Esquivel & Jiménez, 2012). Coffee also contains a number of diterpenes including cafestol, which has been shown to have cholesterol raising properties (Butt & Sultan, 2011) and is proposed to increase serum cholesterol by 1 mg/dL for each 2 mg of consumed cafestol, although this has not necessarily
been proven in all population groups (Weusten-van der Wouw et
al., 1994).
The varied format and highly variable size and frequency of con-sumption make prediction of risk factors, such as hypertension from caffeine consumption and elevated cholesterol levels from the con-sumption of diterpenes, challenging for health authorities and manufacturers.
The cafestol content of a standard cup of coffee varies depending on brew mechanism but is highest in unfiltered preparation methods
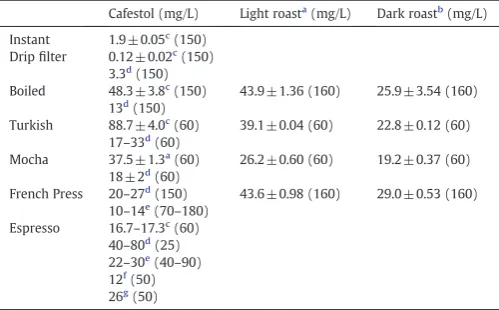
such as Scandinavian‐type boiled coffee and Turkish coffee with up to 88.7 mg/L in some Turkish brews (Table 1) (Gross, Jaccaud, & Huggett, 1997; Urgert et al., 1995). Filtered coffees such as drip-filter and soluble coffee contain negligible levels of cafestol in
the brew, as the paper filter in drip filtered coffee retains the
diterpenes and in soluble coffee the diterpenes are retained with the grounds during production (Gross et al., 1997).
Values for cafestol concentration by brew mechanism from previ-ous studies (Table 1) are often variable due to differing extraction parameters (Eulitz, Kolling-Speer, & Speer, 1999), grind sizes (Buchmann, Zahm, Kolling-Speer, & Speer, 2010; Kurzrock & Speer, 2001; Sehat, Montag, & Speer, 1993), coffee to water ratios (Buchmann et al., 2010), temperatures (Buchmann et al., 2010) and
brewing technologies e.g. coffee pads (Boekschoten, Van Cruchten,
Kosmeijer-Schuil, & Katan, 2006).
Cafestol is not extracted by a simple dissolution kinetics, when hot water interacts with R&G coffee a number of phenomena occur (Lee, Kempthorne, & Hardy, 1992; Merritt & Proctor, 1958),firstly the highly soluble components dissolve in the water phase and are
extracted, for example organic acids (Lentner & Deatherage,
1958), secondly less soluble or physically entrapped compounds
(e.g. arabinogalactan) (Redgwell & Fischer, 2006) are forced out by physical mechanisms, thirdly the heat leads to thermal degrada-tion making select components more soluble and therefore more available for extraction (e.g. galactomannan) and fourthly mobile water will physically lift and migrate coffeefines and emulsify
cof-fee oil into suspension (Escher, Schenker, Handschin, Frey, &
Perren, 2000; Eulitz et al., 1999); it is these components (coffee
fines and coffee oil) that contain the cafestol and deliver them to thefinal brew.
The process of extraction (coffee brew preparation), although fun-damentally simple for the consumer (mix then separate hot water
⁎Corresponding author. Tel.: +44 115 951 6037; fax: +44 115 951 6142. E-mail address:[email protected](I.D. Fisk).
doi:10.1016/j.foodres.2012.06.032
Contents lists available atSciVerse ScienceDirect
Food Research International
j o u r n a l h o m e p a g e : w w w . e l s e v i e r . c o m / l o c a t e / f o o d r e s
0963-9969
Open access under CC BY-NC-ND license. 2012 Elsevier Ltd.
©
Open access under CC BY-NC-ND license. 2012 Elsevier Ltd.
and ground roasted coffee) is complicated to predict and requires a number of technical approaches to cover each of the four brew mech-anisms tested (Oosterveld, Harmsen, Vorgen, & Schols, 2003; Thaler, 1978; Zanoni, Pagliarini, & Peri, 1992). In this study, cafestol is the compound of interest; cafestol is a lipophilic diterpene that generally resides within the oil phase of coffee and can thermally degrade to form other compounds (Kolling-Speer, Kurt, Thu, & Speer, 1997). The main driving force that needs to be considered when predicting the extraction of cafestol from R&G coffee to the brew is the process of oil emulsification and the removal of physical barriers that would prevent the migration of the emulsified oil (e.g. cell structures or long chain polysaccharide networks) into the brew. It is proposed, therefore, that both the brew mechanism and the physical structure of the coffee (Bell, Wetzel, & Grand, 1996) will impact cafestol brew yield.
The objective of this study was therefore to determine, for thefirst time, the extraction yield (%) of cafestol from R&GCoffea arabica
beans at various roasting intensities (roast time) in four brew mech-anisms (Scandinavian boiled, Turkish, French press, mocha). This has not previously been documented and will serve to be of value as a ref-erence point for the development of future brew mechanisms and the identification of technical routes to cafestol reduction, and to further explain the complex interaction of brew water and R&G coffee.
2. Materials and methods
2.1. Roast and ground (R&G) coffee
Green coffee beans (Coffea arabica) were spread evenly over
roasting trays (200 g per tray) and roasted at 190 °C ± 5 °C within a Mono convection oven (Mono, BX, UK). Samples were removed at
10‐min intervals to produce a range of products that had been
exposed to 190 °C for 0 min, 10 min, 20 min, 30 min, 40 min and 50 min, the resulting roasted coffee beans were designated as raw, I(1), I(2), I(3), I(4) and I(5) respectively to be comparable to light to medium roast intensities in small batch roasting conditions.
Samples were moved to ambient temperature to cool for 2 h then left to degas over 2 days. Roasted coffee beans were stored in folded aluminium bags at 4 °C until required, roasted coffee beans were sub-sequently ground in a KG 49 grinder (Delonghi, Australia) to a
uniform size and sieved (Endecotts, UK) to removefines and large
particulates, R&G coffee was stored at 4 °C until required and samples were analyzed within 5 days of roasting.
2.2. Coffee brew preparation
Turkish coffee was prepared using a traditional Turkish coffee pot (Grunwerg, Sheffield, UK) prepared with 40 g R&G coffee and 300 mL distilled water (Pur1te select, ONDEO, UK). The brew was heated until it had foamed twice, allowed to settle (5 min) then decanted for analysis. Individual cup size was 60 mL.
Scandinavian‐type boiled coffee was prepared by adding R&G cof-fee (40 g) to boiling distilled water (300 mL), allowed to settle (10 min) then decanted for analysis. Individual cup size was 160 mL. French press coffee was prepared by pouring boiling water (300 mL) on to R&G coffee (40 g) in a glass French press pot (Fisherbrand, US), allowed to stand for 5 min and the plunger was depressed to separate the brew from the grounds. Individual cup size was 160 mL.
Mocha‐style brewed coffee was prepared with 40 g R&G coffee and 300 mL distilled water in an aluminium Mocha-maker (Oroley, Spain). Individual cup size was 60 mL.
All coffee brews were prepared at sea level in an air‐conditioned room at 21 °C. Brews once prepared were frozen for 24 h at−18 °C and then placed in a Edwards Freeze Dryer Super Modulyo Pirani 1001 (Edwards, Crawley, UK) at−40 °C for 72 h or until a constant weight was achieved (Fisk, Gkatzionis, Lad, Dodd, & Gray, 2009).
2.3. Color
The color of the R&G coffee was measured, as per (Morales & Jiménez-Pérez, 2001) with slight modifications, in the CIE Lab scale (McLaren & Rigg, 1976) (L*,a*,b*) using a tristimulus colorimeter ColourQuest XE (HunterLab, US) after equilibration and calibration (8° standard angle).L* denotes black to white component, luminosity,
a* denotes + red‐to-green component, b* denotes + yellow‐to-blue component (Hunter, 1942) (Standard illumination: D65, colorimetric normal observer angle: 10°, ASTM E308 RSIN Mode, LAV, 1.00 Port, UV Nominal). Samples were placed in transparent square containers and reported as the mean offive determinations at 21 °C.
2.4. Tap density and bulk density
Tap density and bulk density were measured by the ratio of sam-ple weight to tap volume and bulk volume respectively. R&G coffee was poured into a 20‐mL cylinder and tapped three times. The vol-ume and weight were measured before and after tapping of the cylin-der on the table three times. Bulk density and tap density were then calculated.
The physical structure of the R&G coffee was affected by varying roast intensities. There was no change in the tap density (after com-paction), but there was a significant change in the bulk density (mea-sured after freeflow with no shaking or settling) (Table 2). Coffee that had been roasted to a L(5) roast intensity was less dense than the coffee roasted to a L(2) roast intensity. Therefore all subsequent experimentations were conducted on a weight basis, to exclude any volume effects on extraction efficiency.
2.5. Cafestol extraction
[image:2.595.35.285.77.232.2]Two milliliters of 2.5 M KOH (AnalaR, BDH Laboratory Supplies, UK) in 96% ethanol (Fisher Scientific, UK) was added to R&G coffee (200 mg) or freeze‐dried coffee brews (200 mg) and saponified at 80 °C for 1 h (GC 8000 series, FISONS instrument, Germany). After sa-ponification, distilled water (2 mL) was added and the water phase was extracted three times with diethyl ether (4 mL, laboratory regent
Table 1
Literature values for cafestol concentration in different brew mechanisms.
Cafestol (mg/L) Light roasta(mg/L) Dark roastb(mg/L)
Instant 1.9 ± 0.05c (150) Dripfilter 0.12 ± 0.02c
(150) 3.3d
(150) Boiled 48.3 ± 3.8c
(150) 43.9 ± 1.36 (160) 25.9 ± 3.54 (160) 13d(150)
Turkish 88.7 ± 4.0c
(60) 39.1 ± 0.04 (60) 22.8 ± 0.12 (60) 17–33d
(60) Mocha 37.5 ± 1.3a
(60) 26.2 ± 0.60 (60) 19.2 ± 0.37 (60) 18 ± 2d
(60) French Press 20–27d
(150) 43.6 ± 0.98 (160) 29.0 ± 0.53 (160) 10–14e
(70–180) Espresso 16.7–17.3c(60)
40–80d
(25) 22–30e
(40–90) 12f
(50) 26g
(50)
All literature values use different cup sizes therefore values are all converted to mg/L to facilitate comparison; cup volume is provided in parenthesis.
a
I(2) roast color. b
I(5) roast color. c
Gross et al., 1997. d
Urgert et al., 1995. eBuchmann et al., 2010. f Kurzrock & Speer, 2001. g
grade, Fisher Scientific, UK). Samples were shaken for 10 min at 250 oscillations/min (Denley Spiramix, Thermo Electron Corporation, US) and centrifuged for 5 min at 3000 RPM (CR3i Multifunction, JOUAN, US). Organic phases were pooled then evaporated (15 min,
70 °C, HC502, Bibby Scientific, UK), and residues were dissolved
with methanol (HPLC grade, Fisher Scientific, UK) to 25 mL and
stored at−40 °C in brown glass bottles with Teflon lids.
2.6. Cafestol quantification
Cafestol extracts were analyzed by HPLC-UV composed of an auto-matic injector (AS-2055 Plus intelligent sampler, JASCO, Japan), solvent pump (PU-980 intelligent HPLC pump, JASCO, Japan), variable-wavelength UV detector (RI-2031 Plus intelligent RI Detector, JASCO,
Japan) and a C18 reverse-phase column (250 mm × 4.6 mm, 5μm).
The mobile phase (85:15) was methanol (HPLC grade, Fisher Scientific, UK) and water with an isocraticflow rate of 0.7 mL/min and a detection wavelength of 230 nm (Benassi et al., 2010). The mobile phase was pre-pared and degassed for 30 min in an ultrasonic bath (F5300b, Decon, UK). Cafestol was quantified by retention time and peak area of authen-tic standards (ChromaDex, Irvine, USA) using a six‐point calibration curve. All samples were within the calibration curve range and repeat-ability was acceptable atR2> 0.99. All results are presented on a wet
weight basis (mg/L) or (mg/cup).
All samples were prepared in triplicate and analyzed in duplicate. Statistical differences were evaluated by ANOVA-LSD post hoc test (XLSTAT 2011, addinsoft, UK) at a significance level ofp≤0.05.
3. Results
[image:3.595.309.562.85.164.2]Coffee brews were prepared by four brewing mechanisms to in-vestigate the extraction efficiency of cafestol in each process, and the absolute concentration of cafestol within a brew is detailed in
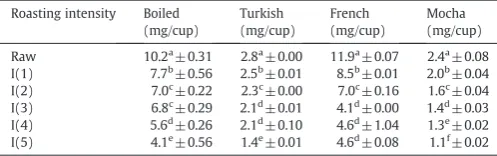
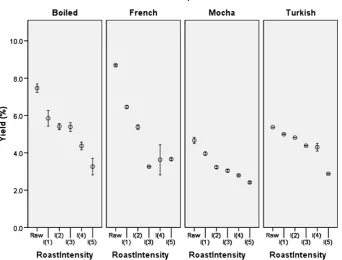
Table 3on a mg/L basis for each brew mechanism; this is then further detailed inTable 4on a mg/cup basis, to illustrate parity and to enable comparisons with previous literature. The extraction yield of cafestol from R&G coffee is subsequently shown inFig. 1for each roast color and brew preparation.
3.1. Impact of brew mechanism and roast time on cafestol brew concentration
The concentration of cafestol within the R&G coffee significantly reduced with higher roast intensities; this is detailed in Table 3. There was a significant reduction from raw green beans to the lightest roast intensity, I(1) and further roasting at levels I(4) and I(5) gave further reductions in the concentration of cafestol.
The concentration of cafestol in the coffee brews was dependent on both the roast color and the brewing method. The cafestol concen-tration of the brew ranged from 19.2 to 74.4 mg/L with the highest brew concentration found in the raw coffee sample for all brew prep-aration methods, further roasting reduced the cafestol brew
concentration. French press, boiled and Turkish preparation methods produced the highest cafestol brew concentration and the lowest concentration was found in the Mocha preparation method at all roast colors.
The relative differences in cafestol concentrations were further highlighted on a cup basis (Table 4) as the two highest cafestol brew concentration samples (French and Boiled) also had the highest cup volume. On a mg/cup basis French press and boiled coffee prepa-rations had the highest cafestol level per cup and mocha had the low-est caflow-estol per single cup serving.
3.2. Impact of brew mechanism and roast time on cafestol extraction yield
When directly comparing the brew extraction yields between dif-ferent brew preparation mechanisms (French press, Turkish, Mocha, boiled coffee), a marked and significant difference in extraction yield was identified.
Cafestol extraction yield was in the order French> boiled > Turkish >Mocha for both Raw and L(1) coffee, boiled = French > Turkish >Mocha for L(2), and boiled >Turkish >French= Mocha for L(3), boiled =Turkish=French> Mocha for L(4) and for L(5)
French >boiled = Turkish > Mocha as calculated by ANOVA-LSD
(p>0.05). There was also a strong correlation of roast intensity with cafestol extraction yield (Fig. 1), with green coffee and the lightest roasts having significantly greater cafestol extraction yields than the brews prepared with darker roast coffee (Fig. 1). Of the roasted samples L(1) French press and boiled preparations had the highest cafestol extraction yield (6.5% and 5.84%) and L(5) Mocha and Turkish preparations had the lowest extraction yields (2.42% and 2.88%).
4. Discussion
For all roast intensities, Mocha produced the lowest cafestol con-centration; this confirms the work byGross et al. (1997)who showed that Mocha has the lowest brew concentration when comparing boiled, Turkish and Mocha preparations (Table 1), but is contrary to
findings byUrgert et al. (1995)who showed that on a concentration
Table 2
Color parameters (lightness (L*),a*,b* value) and density (tap density and bulk density) of roast coffee by roast intensity.
Roasting intensity Tap density (kg/m3 ) Bulk density (kg/m3 )
L* a* b*
Raw 493a
± 0.01 415a
± 1.27 67.3e
± 1.04 0.66a
± 0.06 14.5e ± 0.42 I(1) 514a
± 0.03 404a
± 7.21 63.8d
± 0.48 8.03e
± 0.14 22.1f ± 0.41 I(2) 504a± 0.01 374b± 7.65 46.6c± 0.54 7.92e± 0.17 10.8d± 0.28 I(3) 497a
± 0.01 354b
± 14.7 44.2b
± 0.11 7.17d
± 0.15 8.82c ± 0.31 I(4) 490a
± 0.01 349bc
± 18.4 41.7a
± 0.43 6.26b
± 0.10 6.86a ± 0.12 I(5) 483a
± 0.02 322c
± 0.18 42.0a
± 0.31 6.59c
± 0.16 7.63b ± 0.30
[image:3.595.43.294.86.164.2]Mean ± standard deviation of values infive replicates. Different letters indicate a difference within a column (p≤0.05).
Table 3
Cafestol concentration of roast and ground coffee (mg/100 g) and coffee brews (mg/L) by roast intensity and brew mechanism.
Roasting intensity R&G (mg/100 g) Boiled (mg/L) Turkish (mg/L) French (mg/L) Mocha (mg/L)
Raw 642a
± 10.7 63.9a
± 1.94 45.9a
± 0.04 74.4a
± 0.42 40.0a ± 1.41 I(1) 619b
± 0.9 48.2b
± 3.47 41.3b
± 0.12 53.3b
± 0.68 32.7b ± 0.73 I(2) 608bc± 0.32 43.9c± 1.36 39.1c± 0.04 43.6c± 0.98 26.2c± 0.60 I(3) 593bc
± 5.68 42.5c
± 1.84 34.7d
± 0.12 25.8d
± 0.14 24.1d ± 0.52 I(4) 600c
± 12.4 35.0d
± 1.64 34.4d
± 1.67 29.0d
± 6.51 22.3e ± 0.27 I(5) 595c
± 5.56 25.9e
± 3.54 22.8e
± 0.12 29.0d
± 0.53 19.2f ± 0.37
[image:3.595.311.560.640.718.2]Mean ± standard deviation of values infive replicates. Different letters indicate a difference within a column (p≤0.05), R&G is roasted and ground coffee.
Table 4
Cafestol concentration (mg/cup) by roast intensity and brew mechanism.
Roasting intensity Boiled (mg/cup) Turkish (mg/cup) French (mg/cup) Mocha (mg/cup)
Raw 10.2a
± 0.31 2.8a
± 0.00 11.9a
± 0.07 2.4a ± 0.08
I(1) 7.7b
± 0.56 2.5b
± 0.01 8.5b
± 0.01 2.0b ± 0.04
I(2) 7.0c
± 0.22 2.3c
± 0.00 7.0c
± 0.16 1.6c ± 0.04
I(3) 6.8c
± 0.29 2.1d
± 0.01 4.1d
± 0.00 1.4d ± 0.03
I(4) 5.6d
± 0.26 2.1d
± 0.10 4.6d
± 1.04 1.3e ± 0.02
I(5) 4.1e
± 0.56 1.4e
± 0.01 4.6d
± 0.08 1.1f ± 0.02
basis, boiled coffee and French press had concentrations of 13 and 10–14 mg/L respectively and that Mocha had an intermediate cafestol brew concentration of 18± 2 mg/L when compared to Turkish prepara-tion method (17–33 mg/L). The low concentration of cafestol found in the Mocha preparation is presumed to be due to the fact that the coffee
fines and coffee oil (containing the diterpenes) are not significantly transferred to thefinal brew and are retained in the water tank. The geometry andfill volume will therefore impact transfer rate and may explain Urgert's results.
On both a cup and concentration basis boiled and French press‐
prepared brews had the highest cafestol concentration, this is due to the elevated levels of physical and thermal stresses imposed on the coffee grounds by these methods and subsequent release of oil and diterpenes into the brew. Turkish style‐prepared brews contain an intermediate level of cafestol due to the decanting procedure dur-ing preparation, but exceeded that of French press at intermediate roast intensities. BothUrgert et al. (1995)andGross et al. (1997)
showed that French press, boiled and Turkish extraction preparation method can produce high cafestol brew concentrations (boiled, Turk-ish, mocha and French were studied); Gross et al did not study French press, and found Turkish to be the highest whereas Urgert et al. found French press and Turkish to have the highest concentration. It should be noted that all the data inTable 1are not truly comparable due to differences in brew geometry, brew volumes and roast color, but do serve to highlight trends that support the generalfindings shown in
Table 3.
There is a small but statistically significant reduction in cafestol in the R&G coffee, with I(5) containing 96% the cafestol of the I(1) cof-fee, this is presumed to be due to thermal degradation of the cafestol with heating. When considering the coffee brews prepared from I(1) and I(5) roast intensities, the I(5) contains, on average, only 58% of the cafestol that brews prepared from I(1) contain. Given that the original coffee only has a slight reduction in cafestol levels due to thermal damage, there must be a significant impact of roast intensity on the physical release mechanisms occurring during extraction to drive this difference.Kurzrock and Speer (2001)and Urgert et al.
(1995)have previously shown only small or no changes in cafestol concentrations with roast intensity, which supports thisfinding, but do not elude to the impact of roast intensity on the extraction effi -ciency of cafestol during brewing.
The range of brew extraction yields is shown inFig. 1, the reason for the significant difference in extraction yield with roast intensity is pro-posed to be due to changes in the physical structure of the R&G coffee, making it entropically less favorable for the thermal and physical process-es to release and emulsify the entrapped oil. As this is driven by the roast intensity, there must therefore be a causal link between heating time and the physical availability of the internal oil reserves of the R&G coffee.
Previously Kurzrock and Speer (2001) and Speer, Hruschka,
Kurzrock, and Kolling-Speer (2000)summarized the work bySehat et al. (1993)and suggested that in a Scandinavian‐type brew up to 23% of the total diterpene esters are extracted from the coffee into the beverage, whereas, for espresso andfiltered coffee an extraction yield of 0.3% and 2.5% was found.
Sehat et al. (1993) demonstrated that for Scandinavian style brews there was an impact of grind size on extraction yield, with veryfine ground coffee having a greater extraction yield when com-pared to coffee precom-pared with coarse grind size, which serves to sup-port the conclusion that the physical availability of the cafestol within the R&G coffee has a significant impact on the cafestol extraction yield. Specific numerical comparisons cannot be carried out due to difference in choice of preparation method but the literature results do serve to indicate that the results shown (extraction yield of 2.5%–9.0%) are similar to those previously published (0.3%–23%).
[image:4.595.124.467.62.322.2]Although this study robustly evaluates the extraction yield of cafestol from within a defined number of samples, it does not address all technologies employed by the coffee industry to create R&G coffee. Future studies should therefore include a more comprehensive inves-tigation into coffee brew extraction kinetics to allow a full under-standing of the extraction physics which can then be applied to new brewing technologies (e.g. on demand home brew machines, self-service coffee machines) to control the extraction of cafestol to the brew and minimize consumption by the consumer.
5. Conclusion
Roasting time and choice of brew mechanism impact in-cup deliv-ery of cafestol with French press, boiled coffee and Turkish prepara-tion methods producing higher cafestol concentraprepara-tions than the mocha preparation method. Higher roasting times led to a 42% reduc-tion in cafestol concentrareduc-tion on a concentrareduc-tion basis within the brews.
The extraction yield of cafestol from R&G coffee is dependent both on the choice of brew mechanism and roasting time, with lighter roast coffee brews having a greater cafestol extraction yield and darker roast coffee brews having a lower cafestol extraction yield.
References
Bell, L. N., Wetzel, C. R., & Grand, A. N. (1996). Caffeine content in coffee as influenced by grinding and brewing techniques.Food Research International,29(8), 785–789. Benassi, M. D., Dias, R. C. E., Campanha, F. G., Vieira, L. G. E., Ferreira, L. P., Pot, D., & Marraccini, P. (2010). Evaluation of kahweol and cafestol in coffee tissues and roasted coffee by a new high-performance liquid chromatography methodology. Journal of Agricultural and Food Chemistry,58(1), 88–93.
Boekschoten, M. V., Van Cruchten, S. T., Kosmeijer-Schuil, T. G., & Katan, M. B. (2006). Negligible amounts of cholesterol-raising diterpenes in coffee made with coffee pads in comparison with unfiltered coffee.Nederlands Tijdschrift voor Geneeskunde, 150(52), 2873–2875.
Buchmann, S., Zahm, A., Kolling-Speer, I., & Speer, K. (2010). Lipids in coffee brews— impact of grind size, water temperature, and coffee/water ratio on cafestol and the carboxylic acid-5-hydroxytryptamides.ASIC(Bali).
Butt, M. S., & Sultan, M. T. (2011). Coffee and its consumption: benefits and risks. Critical Reviews in Food Science and Nutrition,51(4), 363–373.
Escher, F., Schenker, S., Handschin, S., Frey, B., & Perren, R. (2000). Pore structure of cof-fee beans affected by roasting conditions.Journal of Food Science,65(3), 452–457. Esquivel, P., & Jiménez, V. M. (2012). Functional properties of coffee and coffee
by-products.Food Research International,46(2), 488–495.
Eulitz, M., Kolling-Speer, I., & Speer, K. (1999). Effect of the water feeding onto a coffee brew and thefilter cake using a household coffee maker.ASIC 18th Colloque (Helkinki).
Fisk, I. D., Gkatzionis, K., Lad, M., Dodd, C. E. R., & Gray, D. A. (2009). Gamma-irradiation as a method of microbiological control, and its impact on the oxidative labile lipid component of cannabis sativa and helianthus annus.European Food Research and Technology,228(4), 613–621.
Fisk, I.D., Massey, A.T., & Hansen, N.A. (2011). Improvements in the preparation of beverage and liquid food products. UK patent number WO2011153065. Gross, G., Jaccaud, E., & Huggett, A. C. (1997). Analysis of the content of the diterpenes
cafestol and kahweol in coffee brews. Food and Chemical Toxicology, 35(6), 547–554.
Hsu, J. L., & Hung, W. -C. (2005). Packed coffee drink consumption and product attri-bute preferences of young adults in Taiwan.Food Quality and Preference,16(4), 361–367.
Hunter, R. S. (1942). Photoelectric tristimulus colorimetry with threefilters.Journal of the Optical Society of America,32(9), 509–538.
Kolling-Speer, I., Kurt, A., Thu, N., & Speer, K. (1997). Cafestol and dehydrocafestol in roasted coffee.Seventeenth International Scientific Colloquium on Coffee, Nairobi, July 20–25, 1997(pp. 201–204).
Kurzrock, T., & Speer, K. (2001). Diterpenes and diterpene esters in coffee.Food Reviews International,17(4), 433–450.
Lee, H. S., & O'Mahony, M. (2002). At what temperatures do consumers like to drink coffee? Mixing methods.Journal of Food Science,67(7), 2774–2777.
Lee, T. A., Kempthorne, R., & Hardy, J. K. (1992). Compositional changes in brewed coffee as a function of brewing time.Journal of Food Science,57(6), 1417–1419. Lee, H. -S., Carstens, E., & O'Mahony, M. (2003). Drinking hot coffee: why doesn't it
burn the mouth?Journal of Sensory Studies,18(1), 19–32.
Lentner, C., & Deatherage, F. E. (1958). Organic acids in coffee in relation to the degree of roast.Journal of Food Science,24(5), 483–492.
Massey, A.T., Fisk, I.D., & Henson, S. (2011). Beverage cartridge. UK patent number WO2011151626.
McLaren, K., & Rigg, B. (1976). Xii-the sdc recommended colour-difference formula: change to cielab.Journal of the Society of Dyers and Colourists,92(9), 337–338. Merritt, M. C., & Proctor, B. E. (1958). Extraction rates for selected components in coffee
brew.Journal of Food Science,24(6), 735–743.
Morales, F. J., & Jiménez-Pérez, S. (2001). Free radical scavenging capacity of maillard reaction products as related to colour andfluorescence.Food Chemistry,72(1), 119–125.
Oosterveld, A., Harmsen, J. S., Vorgen, A. G. J., & Schols, H. A. (2003). Extraction and charactorisation of polysaccharides from green and roasted coffea arabica beans. Carbohydrate Polymers,52, 283–296.
Redgwell, R., & Fischer, M. (2006). Coffee carbohydates.Brazilian Journal of Plant Physiology, 18(1), 165–174.
Sehat, N., Montag, A., & Speer, K. (1993). Lipids in the coffee brew.15th International Scientific Colloquium on Coffee,Vols. 1 and 2. (pp. 869–872).
Speer, K., Hruschka, A., Kurzrock, T., & Kolling-Speer, I. (2000). Diterpenes in coffee. In T. H. Parliment (Ed.), ACS Symposium—Caffeinated Beverages—Health Benefits, Physiological Effects and Chemistry(pp. 241–251). California: Oxford University Press.
Thaler, H. (1978). The chemistry of coffee extraction in relation to polysaccharides. Food Chemistry,4, 13–22.
Urgert, R., Van Der Weg, G., Kosmeijerschuil, T. G., Van De Bovenkamp, P., Hovenier, R., & Katan, M. B. (1995). Levels of the cholesterol-elevating diterpenes cafestol and kahweol in various coffee brews.Journal of Agricultural and Food Chemistry, 43(8), 2167–2172.
Weusten-van der Wouw, M. P. M. E., Katan, M. B., Viani, R., Huggett, A., Liardon, R., Lund-Larson, P. G., Thelle, D. S., Ahola, I., Aro, A., & Meynen, A. C. (1994). Identify of the cholesterol raising factor from boiled coffee and its effects on liver function enymes.Journal of Lipid Research,35, 721–733.