http://go.warwick.ac.uk/lib-publications
Original citation:
Roelofs, G. H. A., et al. Hubble space telescope parallaxes of AM CVn stars and
astrophysical consequences. Astrophysical Journal, 666(2), pp. 1174-1188.
Permanent WRAP url:
http://wrap.warwick.ac.uk/31484
Copyright and reuse:
The Warwick Research Archive Portal (WRAP) makes the work of researchers of the
University of Warwick available open access under the following conditions. Copyright ©
and all moral rights to the version of the paper presented here belong to the individual
author(s) and/or other copyright owners. To the extent reasonable and practicable the
material made available in WRAP has been checked for eligibility before being made
available.
Copies of full items can be used for personal research or study, educational, or
not-for-profit purposes without prior permission or charge. Provided that the authors, title and
full bibliographic details are credited, a hyperlink and/or URL is given for the original
metadata page and the content is not changed in any way.
Publisher’s statement:
‘© IOP Publishing 2012
DOI: 10.1086/520491
A note on versions:
The version presented here may differ from the published version or, version of record, if
you wish to cite this item you are advised to consult the publisher’s version. Please see
the ‘permanent WRAP url’ above for details on accessing the published version and note
that access may require a subscription.
arXiv:0705.3855v1 [astro-ph] 25 May 2007
Preprint typeset using LATEX style emulateapj v. 10/09/06
HST/FGS PARALLAXES OF AM CVN STARS AND ASTROPHYSICAL CONSEQUENCES∗
G. H. A. Roelofs1, P. J. Groot1, G. F. Benedict2, B. E. McArthur2, D. Steeghs3,4, L. Morales-Rueda1,
T. R. Marsh4, and G. Nelemans1
Draft version February 1, 2008
ABSTRACT
We present absolute parallaxes and relative proper motions for five AM CVn stars, which we ob-tained using the Fine Guidance Sensors on board theHubble Space Telescope. Our parallax measure-ments translate into distances dAM CVn = 606+135−93 pc; dHP Lib = 197+14−12 pc; dCR Boo = 337+44−35 pc;
dV803 Cen = 347+32−27 pc; anddGP Com = 75+2−2 pc. From these distances we estimate the space density of AM CVn stars and suggest that previous estimates have been too high by about an order of mag-nitude. We also infer the mass accretion rates which allows us to constrain the masses of the donor stars, and we show that relatively massive, semi-degenerate donor stars are favored in all systems except GP Com. Finally, we give updated estimates for their gravitational-wave signals, relevant for future space missions such as the proposed Laser Interferometer Space Antenna (LISA), based on their distances and the inferred masses of the binary components. We show that all systems but GP Com are excellent candidates for detection withLISA.
Subject headings: astrometry — interferometry — stars: distances — stars: individual (AM Canum Venaticorum, HP Librae, CR Bootis, V803 Centauri, GP Comae Berenices) — stars: cataclysmic variables
1. INTRODUCTION
The AM CVn stars are white dwarfs (WDs) accreting matter from a degenerate or semi-degenerate companion, constituted primarily of helium with traces of metals (but no hydrogen). Because of their evolved nature they ex-ist in ultra-compact configurations, with orbital periods ranging from about one hour down to ten, possibly even five, minutes. General overviews of this class of ultra-compact binary stars are given by Warner (1995) and, more recently, Nelemans (2005).
The formation of AM CVn stars is as yet poorly un-derstood, although several formation channels have been proposed to contribute significantly to the AM CVn pop-ulation. The first is stable Roche-lobe overflow in a (formerly detached) double white dwarf binary, when the two white dwarfs are brought together by angu-lar momentum loss due to the emission of gravitational waves (the WD channel; see Nelemans et al. 2001). The second is Roche-lobe overflow from a helium star onto a white dwarf, followed by a period minimum around ten minutes, caused by the quenching of helium fusion and the donor star becoming semi-degenerate – equiva-lent to the orbital period minimum in the hydrogen-rich Cataclysmic Variables (CVs) (the helium-star channel; e.g. Iben & Tutukov 1991; Nelemans et al. 2001). In
∗BASED ON OBSERVATIONS MADE WITH THE NASA/ESA
HUBBLE SPACE TELESCOPE, OBTAINED AT THE SPACE TELESCOPE SCIENCE INSTITUTE, WHICH IS OPERATED BY THE ASSOCIATION OF UNIVERSITIES FOR RESEARCH IN ASTRONOMY, INC., UNDER NASA CONTRACT NAS 5-26555
Electronic address: g.roelofs@astro.ru.nl
1Department of Astrophysics, Radboud University Nijmegen,
Toernooiveld 1, 6525 ED, Nijmegen, The Netherlands
2McDonald Observatory, University of Texas, Austin, TX 78712 3Harvard–Smithsonian Center for Astrophysics, 60 Garden
Street, Cambridge, MA 02138
4Department of Astrophysics, University of Warwick, Coventry
CV4 7AL, UK
a third scenario, a hydrogen-main-sequence star starts mass transfer onto a white dwarf right at the time when its core is becoming depleted of hydrogen, shifting the normal CV orbital period minimum down to, again, about ten minutes depending on the level of hydrogen depletion (the evolved-CV channel; Podsiadlowski et al. 2003).
Determining which of these evolutionary channels ac-tually produce AM CVn stars, and in what numbers, has been a long-standing problem. An important observable is the distance to known AM CVn stars: this helps in determining their space density, and their absolute mag-nitudes contain important information about the rate at which they accrete matter, which in turn constrains the masses of the donor stars.
well-studied CVs (e.g. Patterson et al. 1997, 2000). The outline of this paper is as follows. We describe the observations and data reduction in Section 2, and present the parallaxes and absolute magnitudes in con-venient tabular form in Section 3. We then discuss the implications of these results for the space density of AM CVn stars, for their mass accretion rates and the masses of the components, and for their gravitational-wave sig-nals in Section 4.
2. OBSERVATIONS AND DATA REDUCTION
Ten sets of astrometric data were acquired with the Fine Guidance Sensors on board HST for each of our five science targets. At each epoch we measured several reference stars and the target multiple times to correct for intra-orbit drift. We obtained these sets in pairs typi-cally separated by a week. Each complete data aggregate spans∼1.5 years, except for GP Com, where a servicing mission forced a one-year slip of an observation at one maximum parallax factor. Table 3 contains the epochs of observation and measured photometry for each AM CVn star. The data were reduced and calibrated as detailed in Benedict et al. (2002a, 2002b, 2005), McArthur et al. (2001), and Soderblom et al. (2005).
Because the parallaxes determined for the AM CVn stars have been measured with respect to reference frame stars which have their own parallaxes, we had to ei-ther apply a statistically derived correction from relative to absolute parallax (van Altena et al. 1995) or estimate the absolute parallaxes of the reference frame stars (listed in Table 4). We chose the second method, as it yields a more direct (less Galaxy-model dependent) way of deter-mining the reference star absolute parallaxes.
In principle, the colors, spectral type, and luminosity class of a star can be used to estimate the absolute mag-nitude,MV, andV-band absorption,AV. The absolute
parallax is then simply,
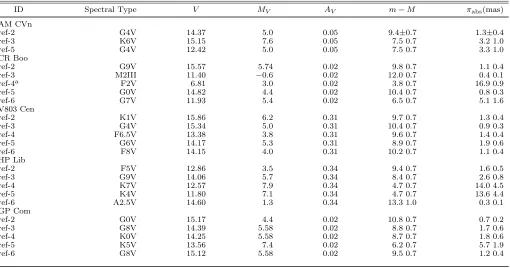
πabs = 10−(V−MV+5−AV)/5 (1) To obtain the spectral type and luminosity class of all reference stars, we combined existing photometric data from the Two-Micron All Sky Survey (2MASS), proper motions from the USNO CCD Astrograph Cat-alog (UCAC2), and ground-based spectroscopic follow-up from the 2.5-m Isaac Newton Telescope (with IDS), the 4.2-m William Herschel Telescope (with ISIS), the 6.5-m Magellan–Baade telescope (with IMACS), and the FLWO 1.5-m (with FAST), where the acronyms in paren-theses are the names of the spectrographs used. The spectra typically had a∼5 ˚A resolution and a wide spec-tral range, suitable for classification purposes from early-to late-type stars. Table 5 lists the spectral types and lu-minosity classes we obtained for our reference stars based on their independent photometric and spectroscopic clas-sifications. Estimated classification uncertainties were used to obtain the errors on the m−M values in that table.
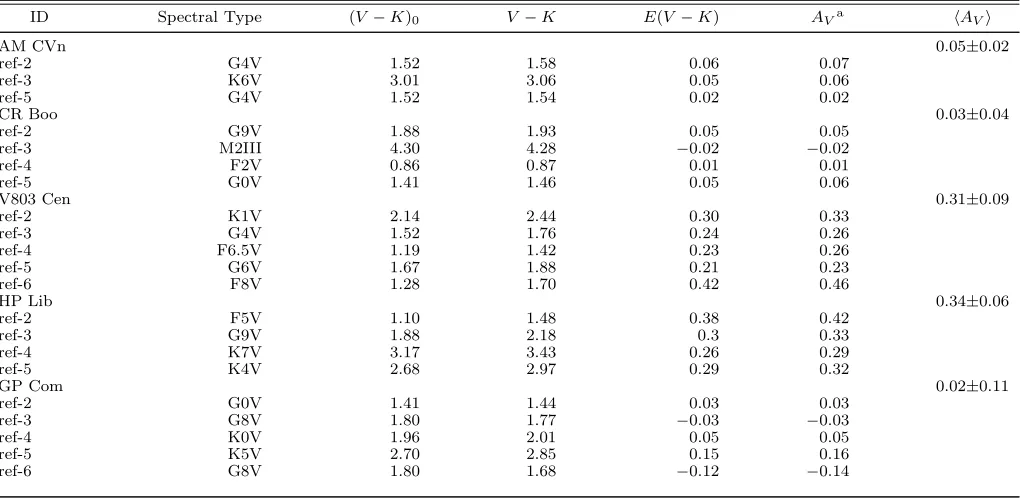
Assuming anR= 3.1 Galactic reddening law (Savage & Mathis 1979), we derivedAV values by comparing the
measured colors (Table 6) with intrinsic (V−K)0colors from Bessell & Brett (1988) and Cox (2000). The result-ing AV values are collected in Table 7, from which we
calculated a field-wide averageAV to be used in
Equa-tion 1. The resulting reference star parallax estimaEqua-tions are listed in Table 5.
3. RESULTS
3.1. Parallaxes and Absolute Magnitudes
Table 1 lists the absolute parallaxes, proper motions, and absolute magnitudes we obtained for the five AM CVn stars. To determine the average absolute magni-tudes, we first derived average values for the apparent magnitudes of our objects. AM CVn, HP Lib and GP Com have never been observed to show brightness vari-ations much larger than about a tenth of a magnitude around their mean, and it is commonly assumed that their accretion disks are in stable states of high (AM CVn, HP Lib) or low (GP Com) mass transfer, such that the thermal instabilities that may trigger transitions be-tween different brightness states do not occur. We could therefore use our accurate FGS photometry (Table 3), which consists of 10 visits per object well separated in time, to directly derive average apparent magnitudes for these three systems. The two other objects, V803 Cen and CR Boo, are known to show complex brightness vari-ations, as also evidenced by our FGS photometry (Table 3). For these we used the results of extensive photomet-ric monitoring campaigns conducted by Patterson et al. (1997, 2000) to estimate time-averaged apparent magni-tudes, by simply averaging the flux levels reported for these systems over the multiple years of observations. For all systems, we have made the crucial assumption that the average flux levels at which they have been ob-served since their discovery are representative for their longer-term average flux levels. The results are collected in Table 1.
When using a trigonometric parallax to derive absolute magnitudes for a class of objects, a correction is usu-ally made for the Lutz–Kelker (LK) bias (Lutz & Kelker 1973). This LK bias occurs when the number of stars in a population significantly increases (or decreases) with dis-tance around the measured disdis-tance for a certain object in the population, both due to an increase in the sampled volume with distance and a decrease in the population space density with distance. This can be corrected for if one knows the scale height of the population under con-sideration. For the AM CVn stars, the scale height is not known and has to be estimated.
We model the space density of this population with a thin disk component of moderate age, with a scale height
hz,thin = 300 pc, plus an older thick disk component of scale height hz,thick = 1250 pc that contributes 2% at
z= 0 pc, wherezis the distance from the Galactic Plane:
ρ(z)
ρ(0) = 0.98 sech (z/300 pc) + 0.02 sech (z/1250 pc) (2)
We then calculate the LK bias ∆πnumerically, as this allows for a relatively easy derivation of the LK bias cor-rection (see below on how we apply this) for an arbitrarily complicated distribution of starsρ(π) by evaluating
∆π(LK) =π−
R
π′dπ′ρ(π′)
π′4 exp
−(π′−π)
2 2σ2
π
R
dπ′ ρ(π′)
π′4 exp
−(π′2−σ2π)2
π
(3)
whereρ(π) will in general depend on the coordinates (but in our model population, only on the Galactic latitude) of the object under study, and theπ−4dπterm is simply the increase in (phase) space withπ. We perform this con-volution integral betweenπ±5σπ; for parallax
measure-ments with σπ/π ≥0.2, an LK bias correction will
be-come increasingly unrealistic (e.g. Lutz & Kelker 1973), although in our case the decreasingρ(π) withπ→0 due to the finite population scale height keeps the integral well-behaved. The fact that our sample is, essentially, magnitude limited, causes an additional suppression of the population density ρ(π) towardsπ →0 (e.g. Smith 2003; also Lutz & Kelker 1973). However, the object for which this potentially matters due to its relatively large measurement error (i.e. AM CVn; σπ/π = 0.18) is at
high Galactic latitude such that the assumed finite scale height has already effectively killed off the population
ρ(π) at smallπ.
GP Com, for which we assumed a halo origin, essen-tially represents the limiting caseρ(π)→constant since its observed distance is much smaller than any reasonable choice of scale height for the halo.
The resulting LK bias corrections on the absolute mag-nitudes, ∆M(LK), are given in Table 1. We have used them to convert the inferred absolute magnitude for e.g. AM CVn, based on its measured distance, to the average absolute magnitude that a sample of objects exactly like AM CVn would have:
MV =hVi −(m−M)−AV + ∆M(LK) (4)
That is, we apply the LK bias correction to theMV’s of
the individual objects in our sample. In practice, these ∆M(LK)’s are actually quite small compared to the ‘raw’ measurement uncertainties in the distance modulim−M. The errors on these corrections, also given in Table 1, have been estimated by varying the modeled thin disk scale height from 200–500 pc. All results, including the final absolute magnitudes we obtain for the five stars, are listed in Table 1.
4. DISCUSSION
4.1. Previous Distance Measurements
4.1.1. Ground-based parallax measurements
Two of our targets (AM CVn and GP Com), as well as one other member of the AM CVn class (V396 Hya) have a measured ground-based parallax. Thorstensen (2003)
derived a parallax for GP Com of 14.8±1.3 mas, translat-ing into a distance of 68+7−6 pc, in good agreement with our determination. For V396 Hya, J. R. Thorstensen (private communication) derives a parallax of 12.9±1.4 mas, translating into a distance of 76+11−8 pc, very close to the distance found for GP Com.
A ground-based absolute parallax of 4.25±0.43 mas is derived for AM CVn itself (C. Dahn 2004, as quoted by Nelemans et al. 2004), translating into a distance of 235 pc. This is in disagreement with our measurement at the 5-σ level. The origin of this rather significant discrepancy is not clear. We have no reason to question the FGS measurements, but we do note that there were only three suitable reference stars in the field of AM CVn, whereas we used five for the other sources. This makes AM CVn’s measurement more susceptible to errors in the reference star grid. On the other hand, if AM CVn really were at 235 pc, it seems highly unlikely that we should not have detected a much larger signal.
None of the other AM CVn stars have a ground-based parallax determination sofar. A lower limit to the dis-tance to CR Boo is set by C. Dahn (2004, as quoted by Espaillat et al. 2005) of dCR Boo > 250 pc, fully consis-tent with our measurement.
4.1.2. Model-based distances
A number of accretion disk modeling studies have been done, where the observed optical spectra, in particular the shapes of the spectral lines and the overall slope of the spectrum, are fitted to accretion disk models to derive a number of parameters, including the distance. Estimates include: dES Cet = 350 pc (Espaillat et al. 2005); dCR Boo = 469±50 pc, dHP Lib = 188±50 pc,
dV803 Cen = 405±50 pc, dAM CVn = 288±50 pc (all from Nasser et al. 2001); and dAM CVn = 420±80 pc,
dCR Boo = 206±15 pc (El-Khoury & Wickramasinghe 2000).
Comparing these values with our parallaxes, the large discrepancy with the distance to AM CVn is again strik-ing, whereas the values for CR Boo scatter around our parallax value, and the determination for HP Lib is dead-on target. The different model predictidead-ons for AM CVn and CR Boo differ quite a bit, the difference being for-mally significant at the 5-σlevel for CR Boo.
Based on our HST/FGS parallaxes, it would thus ap-pear that ground-based parallaxes up to at least 75 pc can give quite reliable results, whereas ground-based par-allaxes at several hundred pc as well as distances ob-tained from disk modeling remain uncertain.
4.2. Space Density of AM CVn Stars
Based on an estimated MV = 9.5 for the AM CVn
stars in their high states, and the resulting distancesd <
100 pc for five of the six AM CVn stars known at the time, Warner (1995) derived a local space densityρ(0)∼
3×10⁻⁶pc−3 for the systems that are (mostly) in a high state.
Our HST parallaxes show that the absolute magni-tude in the high states is close to MV = 6, significantly
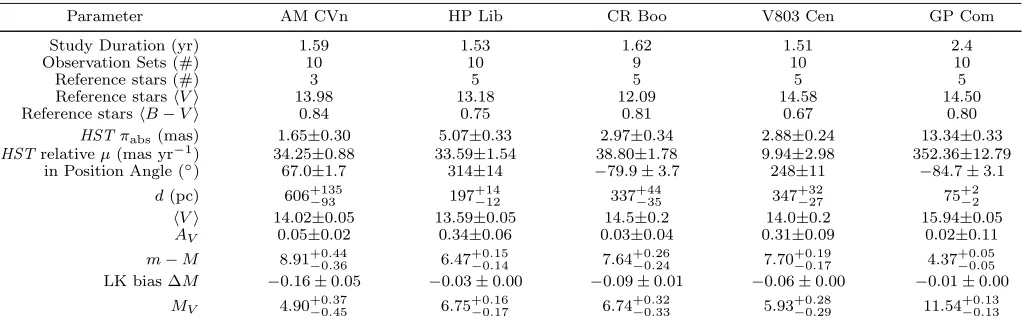
TABLE 1
AM CVn Parallaxes, Proper Motions, and Absolute Magnitudes
Parameter AM CVn HP Lib CR Boo V803 Cen GP Com
Study Duration (yr) 1.59 1.53 1.62 1.51 2.4
Observation Sets (#) 10 10 9 10 10
Reference stars (#) 3 5 5 5 5
Reference starshVi 13.98 13.18 12.09 14.58 14.50
Reference starshB−Vi 0.84 0.75 0.81 0.67 0.80
HSTπabs(mas) 1.65±0.30 5.07±0.33 2.97±0.34 2.88±0.24 13.34±0.33 HSTrelativeµ(mas yr−1) 34.25±0.88 33.59±1.54 38.80±1.78 9.94±2.98 352.36±12.79
in Position Angle (◦) 67.0±1.7 314±14 −79.9±3.7 248±11 −84.7±3.1
d(pc) 606+135−93 197
+14
−12 337
+44
−35 347
+32
−27 75
+2
−2
hVi 14.02±0.05 13.59±0.05 14.5±0.2 14.0±0.2 15.94±0.05
AV 0.05±0.02 0.34±0.06 0.03±0.04 0.31±0.09 0.02±0.11
m−M 8.91+0−0..4436 6.47 +0.15
−0.14 7.64 +0.26
−0.24 7.70 +0.19
−0.17 4.37 +0.05
−0.05 LK bias ∆M −0.16±0.05 −0.03±0.00 −0.09±0.01 −0.06±0.00 −0.01±0.00
MV 4.90+0 .37
−0.45 6.75 +0.16
−0.17 6.74 +0.32
−0.33 5.93 +0.28
−0.29 11.54 +0.13
−0.13
of known systems that have high states of mV ≤ 14.5
is still four. It would thus seem that we can lower the estimates by Warner (1995) that were based on this sam-ple. We employ the “1/Vmax” method of Schmidt (1975), generalized to include the variation of space density with Galactic height:
ρ(0) = 1 4πβ
X
obj
1
Rrmax
0 r2dr ρ(z)/ρ(0)
(5)
Here rmax is the maximum distance at which an object would still just belong to the sample at mV = 14.5
given its MV, and 0 < β ≤ 1 is an (unknown)
com-pleteness parameter that corrects for the systems that would have belonged to our sample had they been dis-covered. The decrease in space density with Galactic height z=rsinb, i.e. the termρ(z)/ρ(0), is modeled as in Section 3.1 (Eq. (2)). Summing over the four known objects in our sample then leads to a local space density of ρ(0) = 2×10⁻⁸β−1 pc−3 for the short-period AM CVns that have high states. Assuming a sample com-pleteness β of only 10%, based on the notion that there are still large parts of the sky such as the Galactic Plane that are poorly surveyed, our result is still an order of magnitude lower than Warner’s (1995) estimate for this population.
If we combine the above result with the notion that AM CVn stars with orbital periodsPorb.2000 s are observed to be in a high state at least some of the time, and we compare with evolutionary predictions that only about 2% of the local AM CVn population should currently be at these or shorter orbital periods (Nelemans et al. 2001, 2004), we arrive at a local space density estimate
ρ(0)≈1×10⁻⁶β−1pc−3 (6) for the entire AM CVn population, including the old and dim ones at long orbital periods.
If we again allow for a sample completenessβ of only 10%, our space density for the entire population is still an order of magnitude lower than predictions from popu-lation synthesis models by Nelemans et al. (2001, 2004), which indicate ρ(0) ∼ 1×10⁻⁴pc−3 (there is a small dependency of our ‘observed’ space density on the pop-ulation models, because the 2% fraction of systems at
Porb <2000 s was derived from them). It thus appears
that space density estimates – both of the bright, short-period ones and of the entire population – have so far been too high by about an order of magnitude. The sample completeness estimateβ is nevertheless still very uncertain, and a more homogeneous sample of AM CVn stars will be needed to bring down the corresponding un-certainty in the space density (Roelofs et al. 2007b).
4.3. Mass Accretion Rates
From the absolute magnitudes we can estimate the mass accretion rates, ˙M, in our AM CVn stars, assum-ing that the observed flux is dominated by the accretion luminosity. For this we need to estimate what fraction of the total accretion luminosity of the stars is emitted in theV band; that is, we need the bolometric correction.
We first derive aminimum bolometric correction (BC) for AM CVn by summing all theobserved fluxes, without extrapolating beyond the observed wavelengths. This yields a lower limit of BC≤ −2.2. We then have to es-timate how much additional flux is beyond the observed wavelengths. By far the largest part of this flux will be at wavelengths shorter than the observed range. From the slopes of the far-UV spectra, which do not appear to be flattening off that much towards shorter wavelengths, we estimate that they continue as 30 kK blackbodies. With this estimated extra flux the total bolometric correction becomes BC =−2.5±0.3, where the error has been es-timated by considering a 40 kK instead of a 30 kK black-body. Given the similarity of the SEDs, we assume this bolometric correction for all systems (although CR Boo’s IUE spectrum has a lower UV flux compared to its aver-age optical flux, we assume that this is due to its outburst behavior).
The exception is GP Com, which is thought to be in a stable state of low mass transfer. Its SED has been shown to match rather well with a Teff = 11 kK blackbody, which is expected to be the accreting white dwarf (Bildsten et al. 2006), plus helium emission lines from the accretion disk which appears optically thin in the continuum. We have therefore used a bolomet-ric correction appropriate for an 11±1 kK blackbody: BCGP Com = −0.5±0.2. Since the temperature of the accreting white dwarf we see today is probably set by ac-cretion heating that occurred a long time ago, when GP Com was a much shorter-period binary with much higher
˙
M (Bildsten et al. 2006), we can only put an upper limit to GP Com’s present-day accretion rate.
For a given system with a given BC, we can derive the bolometric luminosity,L, and compare with the value
L=1
2M˙2 Φ(L1)−Φ(R1)
(7)
expected for conservative mass transfer through a Keple-rian (i.e. virialised) disk, where Φ is the Roche potential, at the inner Lagrange point L1 and the surface of the accreting starR1. Since the accreting white dwarf is ex-pected to be rather hot due to accretion-induced heating (Bildsten et al. 2006), at least for the four bright sys-tems, we use accretor radii that are 5–10% (depending on mass) larger than the idealized zero-temperature radii, based on the mass–radius relations given by Panei et al. (2000). These correspond to a core temperature of about 3×10⁷K in the models of Bildsten et al. (2006, 2007).
We can then link the mass transfer rate to the compo-nent masses by assuming that gravitational-wave losses drive the evolution of the system, as is commonly as-sumed (e.g. Deloye et al. 2005; Marsh et al. 2004), and requiring that the secondary fill its Roche lobe. This gives an equilibrium mass transfer rate
˙
M2
M2 = ˙
J J
2
ζ2+ 5/3−2q (8) where the angular momentum loss due to the emission of gravitational waves is given by
˙
J J =−
32 5
G3
c5
M1M2(M1+M2)
a4 (9)
(Landau & Lifschitz 1971),q≡M2/M1is the mass ratio of the binary,ais the separation between the donor mass
M2 and the accretor massM1, and
ζ2≡
d logR2
d logM2. (10)
expresses the mass–radius relation of the mass-losing star. The latter may range from ζ2 ≈ −0.06 for a semi-degenerate helium object based on evolutionary calcula-tions by Tutukov & Fedorova (1989) as parameterized by Nelemans et al. (2001), to ζ2 ≈ −1/3 for an (idealized) zero-temperature white dwarf.
For a given mass ratioqand a choice of mass–radius re-lation for the secondary starζ2, the mass of the secondary
M2 is now fixed by the observed bolometric luminosity, if one makes the crucial assumption that the present-day accretion rate corresponds to the binary’s equilib-rium rate for gravitational-wave-driven mass transfer. At present only GP Com (Steeghs et al. in preparation) and AM CVn (Roelofs et al. 2006b) have a directly measured mass ratio; for the other three we can either estimate the primary’s mass, or the mass ratio. In Roelofs et al. (2006b) we derive a primary massM1≈0.7M⊙ for AM CVn, and combined with the mass distribution of single white dwarfs (e.g. Bergeron et al. 1992), it would seem reasonable to adopt a similar canonical white dwarf mass for the accretors in HP Lib, CR Boo, and V803 Cen.
We do, however, have one additional piece of in-formation on these three systems: they all show ‘su-perhump’ periods (Psh) in time-series photometry (e.g. Patterson et al. 1997, 2000, 2002), which are thought to be due to a tidal resonance between the accretion disk and the secondary star. Observationally and theoreti-cally, it has been found that there exists a (roughly lin-ear) relation between the superhump period excessǫ, de-fined as
ǫ≡ Psh−Porb
Porb
(11)
and the mass ratioq, at least for the hydrogen-rich Cat-aclysmic Variables (Patterson et al. 2005; Whitehurst 1988; Whitehurst & King 1991; Hirose & Osaki 1990). To date, there is only one AM CVn star for which we have both a kinematically derived mass ratio and a superhump period excess, namely AM CVn itself (Skillman et al. 1999; Roelofs et al. 2006b). We may estimate mass ra-tios for HP Lib, CR Boo, and V803 Cen by assuming a linearǫ(q) relation,
ǫ(q) = 0.12q (12)
for them, based on q = 0.18, ǫ = 0.0218 measured for AM CVn. The resulting mass ratios for HP Lib, CR Boo and V803 Cen are shown in Table 2. The first two of these are about twice as large as those used by Deloye et al. (2005), who employ an ǫ(q) relation that is based on fits to numerical simulations of accretion disks in hydrogen-rich CVs, as given by Warner (1995). Adopting instead the empirical ǫ(q) for hydrogen-rich CVs from Patterson et al. (2005) already yields larger mass ratios than the ones used in Deloye et al. (2005), but still smaller than ours. Our mass ratio estimate for V803 Cen is also much larger relative to the other sys-tems than the one used by Deloye et al. (2005); this is due to a new robust measurement of V803 Cen’s orbital period, as will be discussed in section 4.5. Although our
CVn (see also Pearson 2007 for a recent discussion), it is probably the best we can do until independent mass ratio measurements become available for more AM CVn stars. We choose to employ this ǫ(q) relation combined with the known superhump excesses for HP Lib, CR Boo, and V803 Cen to estimate their individual mass ratios, rather than assume a canonical primary mass for all three.
Lastly, a correction has to be made for the inclination
i of the binary, since the ‘apparent absolute magnitude’ (Warner 1995) depends on the inclination. We thus link the observed absolute magnitude MV from Table 2 to
the presumed accretion luminosityMbol(M1, M2) due to gravitational-wave radiation via
MV =Mbol(M1, M2)−BC + ∆MV(i) (13)
where
∆MV(i) =−2.5 log
cosi
0.5
(14)
is the correction due to the observer observing a differ-ent area of the disc than the direction-averaged value,
hcosii= 0.5 (the unknown effect of limb darkening is not taken into account). For HP Lib and V803 Cen the in-clination is constrained by spectroscopic measurements of the velocity amplitude of the ‘bright spot’ (the pre-sumed accretion stream–accretion disk impact region) in these systems (Roelofs et al. 2007a; see also section 4.5). We make the assumption that the radial velocity semi-amplitude of the donor star is equal to that of the bright spot, which is usually a good estimate. Similar data does not exist for CR Boo and we thus adopt the value of i= 30◦ derived from spectral line modeling by
Nasser et al. (2001), with the sidenote that their model-derived inclinations for AM CVn, HP Lib, and V803 Cen are in excellent agreement with the kinematically derived values. Table 2 lists the inclinations we employ for all systems.
With the above assumptions we have all the ingredients needed to solve for the masses and mass transfer rates of our AM CVn stars: for a given mass ratioq, there is only one set of M1 and M2 for which the resulting ac-cretion luminosity driven by gravitational-wave emission matches with the observed luminosity. For AM CVn, which has a kinematically measured mass ratio, the dom-inant contributions to the error on the mass transfer rate are the error on its absolute magnitudeMV and the
un-certainty in the bolometric correction. For HP Lib, CR Boo, and V803 Cen, we consider the uncertainty on their true mass ratios to be the most important factor. The errors on the mass transfer rates for these systems are es-timated by varyingqby±50% from the ‘best estimates’ given in Table 2. The resulting lower limits then corre-spond to the low mass ratios employed by Deloye et al. (2005), while the resulting upper limits correspond toqs that are such that qHP Lib coincides with our kinemati-cally measuredqAM CVn, which one might expect if they share a similar evolutionary history, given their similar orbital period. Note that these ranges inqgive ranges of
M2 and M1 (see Table 2) that are anti-correlated. For GP Com, as mentioned, we can put upper limits on the accretion rate by assuming that the accretion luminosity has to be less than the observed luminosity (the latter of which is probably due in part to the accreting white dwarf). This leads to upper limits on M1,2 under the
assumption that the mass transfer rate is set by the rate of gravitational-wave emission. The lower limits onM1,2 correspond to the minimum mass a Roclobe-filling he-lium object can have at the observed orbital period of GP Com.
We can compare our values to those obtained by Nasser et al. (2001) from spectral modeling of the ac-cretion disks in these systems. With our larger distance for AM CVn, the accretion rate based on their models should be a bit larger than our value, at ˙MAM CVn ∼ 1×10⁻⁸M⊙/yr (J.-E. Solheim, private communication). For the other systems they find ˙M ∼4×10⁻⁹M⊙/yr, which is again larger than our values of M˙ ∼ 1 ×
10−9M⊙/yr. El-Khoury & Wickramasinghe (2000) on the other hand find ˙MAM CVn ∼ 2×10⁻⁹M⊙/yr, also from spectral modeling of the accretion disk, which is lower than our value. Their value of ˙MCR Boo ∼ 1× 10⁻⁹M⊙/yr is close to ours.
4.4. The Nature of the Donor Stars
The most surprising result of ourHSTparallaxes is the large distance to AM CVn, which exceeds every previous estimate. The resulting large luminosity of AM CVn al-ready suggests a relatively high mass accretion rate. In addition to the large distance found here, AM CVn’s recently measured mass ratio, too, was found to be sig-nificantly larger than previously thought (Roelofs et al. 2006b). With these two pieces of information we could solve self-consistently for the masses of the components (within the assumptions outlined in Section 4.3), and provide strong evidence that the donor star in AM CVn is a relatively massive, semi-degenerate helium object.
For HP Lib, CR Boo, and V803 Cen, there is a larger uncertainty in the masses of the components due to the larger uncertainties on their mass ratios, as discussed in the previous section. Nevertheless, if we compare the data with evolutionary predictions for fully-degenerate and semi-degenerate donors (see Figure 2), the data are seen to favor rather massive, semi-degenerate donor stars in all systems but GP Com. This agrees qualitatively with the accretion disk models of Nasser et al. (2001), but disagrees with El-Khoury & Wickramasinghe (2000) who find a fully-degenerate donor in AM CVn.
It should be noted that there is a selection effect against fully-degenerate donor stars, since AM CVn stars with semi-degenerate donors are expected to be brighter at short orbital periods due to the higher mass accre-tion rates. At long orbital periods this is partially offset by the fact that semi-degenerate systems evolve to lower accretion rates more quickly. If we evolve a fully-degenerate and a semi-degenerate system, based on the parameterization of Nelemans et al. (2001), we see that semi-degenerate donors are in a bright state about twice as long, where we take ‘bright state’ to be
˙
M2∼10−8−10−10M⊙/yr, i.e. a state corresponding to the four bright AM CVns under consideration here. See Figure 3.
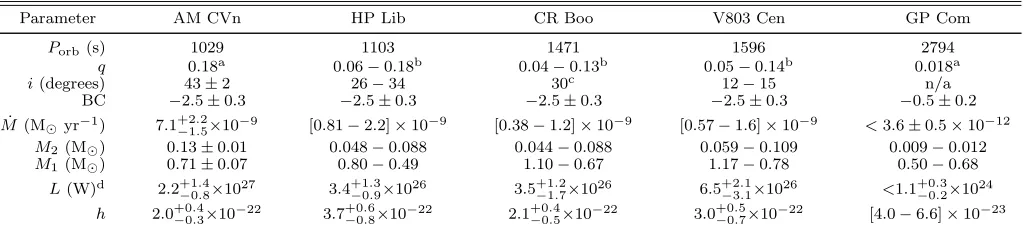
TABLE 2
Apparent Mass Accretion Rates, Inferred Masses, and Gravitational-Wave Strain Amplitudes
Parameter AM CVn HP Lib CR Boo V803 Cen GP Com
Porb(s) 1029 1103 1471 1596 2794
q 0.18a 0.06−0.18b 0.04−0.13b 0.05−0.14b 0.018a
i(degrees) 43±2 26−34 30c 12−15 n/a
BC −2.5±0.3 −2.5±0.3 −2.5±0.3 −2.5±0.3 −0.5±0.2 ˙
M (M⊙yr−1) 7.1+2
.2
−1.5×10⁻⁹ [0.81−2.2]×10−9 [0.38−1.2]×10−9 [0.57−1.6]×10−9 <3.6±0.5×10⁻¹²
M2 (M⊙) 0.13±0.01 0.048−0.088 0.044−0.088 0.059−0.109 0.009−0.012
M1 (M⊙) 0.71±0.07 0.80−0.49 1.10−0.67 1.17−0.78 0.50−0.68
L(W)d 2.2+1.4
−0.8×1027 3.4 +1.3
−0.9×1026 3.5 +1.2
−1.7×1026 6.5 +2.1
−3.1×1026 <1.1 +0.3
−0.2×1024
h 2.0+0.4
−0.3×10
−22 3.7+0.6
−0.8×10
−22 2.1+0.4
−0.5×10
−22 3.0+0.5
−0.7×10
−22 [4.0−6.6]×10−23 aMeasured from kinematics.bInferred from superhump period; note the differences with Table 1 of Deloye et al. (2005).cFrom Nasser et al.
(2001).dInferred accretion luminosity, Eq. (7).
cold, degenerate ones. AM CVn stars with such hot, semi-degenerate donors are expected naturally from the helium-star channel (Nelemans et al. 2001), but a frac-tion of AM CVn progenitors in the WD channel are also expected to still have hot donors upon coming into con-tact (Deloye et al. 2005). Conceivably, it could be pre-dominantly this hot fraction of systems that survive as AM CVn stars in the WD channel, since the mass trans-fer rate upon Roche-lobe overflow can be up to two or-ders of magnitude lower than for cold, degenerate donors (Nelemans et al. 2001; Deloye et al. 2005, 2007). An-other possibility would be that cold white dwarf donors in the WD channel are reheated at some stage, for in-stance by tidal heating close to orbital period minimum (e.g. Iben et al. 1998) or in a thermonuclear event such as those proposed by Bildsten et al. (2007). Interpreta-tion of our results in terms of the evoluInterpreta-tionary history of the systems requires a more detailed study of these effects. Of particular interest would be a comparison be-tween HP Lib and AM CVn, whose donor stars appear to have a different level of degeneracy despite their other-wise identical appearance (Roelofs et al. 2006b, 2007a). A kinematic measurement of HP Lib’s mass ratio would be needed to determine whether its donor star is truly more degenerate.
We remark that there is one, but really only one, cru-cial assumption in our analysis that leads us to conclude that the donor stars in AM CVns are semi-degenerate objects, namely, that the mass transfer rate is set by the emission of gravitational waves. If there should be an ad-ditional, dominant driver of mass transfer, we could be overestimating the masses enough (based on the observed luminosities) that the donors could in reality be fully de-generate. Within the assumption of gravitational-wave-driven mass transfer, the result that the donors are semi-degenerate is quite robust. This is a consequence of the accretion luminosity due to gravitational waves being strongly dependent on the masses of the stars, as can readily be judged from Eqs. (7)–(9). The uncertainty in the inferred masses is therefore small compared to the uncertainties in the bolometric luminosities of the sys-tems.
The possibility of the mass transfer rate (due to gravi-tational waves) being out of equilibrium cannot be ruled out, but we do remark that it is quite difficult to change the donor star’s radius by for instance irradiation, since
the structure of the donor star is largely set by degen-eracy pressure (C. Deloye, private communication). At late times (Porb &45 min) a hot, semi-degenerate donor may start to cool and contract towards a fully-degenerate state, which could cause the mass transfer rate to go down temporarily (Deloye et al. 2007). This may be rel-evant for GP Com.
4.5. The Mass Ratio of V803 Cen
The small mass ratio of V803 Cen,qV803 Cen = 0.016, implied by the small superhump period excess as ob-tained from Patterson (2001) by Deloye et al. (2005) and others, leads to a necessarily large accretor mass close to the Chandrasekhar limit, and a small donor mass close to the minimum mass for a Roche-lobe filling sec-ondary (corresponding to a cold, fully-degenerate ob-ject). This was already noted by Deloye et al. (2005). Given these implications, it should be noted that V803 Cen is the one system for which the photometric super-hump period excess appeared to be uncertain due to an uncertain identification of the 1611-second orbital period (see also Patterson et al. 2000), which has nevertheless entered the literature (Patterson 2001, Patterson et al. 2002, Woudt & Warner 2003, Deloye et al. 2005).
We have recently measured a significantly shorter or-bital period,PV803 Cen= 1596.4±1.2 seconds, from VLT spectroscopy (Roelofs et al. 2007a). The mass ratio we use in this paper is the one we obtain from the corre-sponding (larger) superhump period excess, via relation (12), again with a±50% range. Since it is not completely clear whether the 1618 s superhump period or the 1611 s period (both from Patterson et al. 2000) is the more ap-propriate one to use for calculating the superhump period excess, we have used the average of the two.
The resulting mass ratio qV803 Cen = 0.05−0.14 lifts the strong constraints on the mass of the donor (cf. Deloye et al. 2005). A semi-degenerate donor is then strongly favored, as shown in Section 4.3, and the accre-tor does not have to be very close to the Chandrasekhar mass in order to explain the observed luminosity of the system.
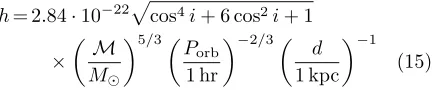
4.6. AM CVn Stars as Sources of Gravitational Waves
Fig. 1.—Observed spectral energy distributions of AM CVn, HP Lib, CR Boo, and V803 Cen, compiled from archivalIUE spectra (small dots), the optical V-band fluxes from table 1 (left-most large dot), and the near-infrared J-, H-, and K-band fluxes from 2MASS (three right-most dots). The solid lines are blackbody spectra ofTeff= 10−35 kK in steps of 5 kK (bottom to top) to get an idea of the temperatures. For CR Boo and V803 Cen, we selected the apparent high-state spectra from theIUEarchives; however, we cannot exclude that they represent slightly lower intermediate states. For CR Boo this was definately the case for its short-wavelength (1150–2000 ˚A) spectrum; we scaled it up to match the overlapping long-wavelength (1850–3350 ˚A)IUEspectrum. Its UV flux still seems low with respect to the average optical flux and the 2MASS snapshots. The data have been corrected for extinction according to Cardelli et al. (1989) and assuming anRV = 3.1 extinction law.
waves in the frequency regime covered by space-borne gravitational-wave detectors such asLISA.
The masses of the stars, inferred from their luminosi-ties, can be used to estimate the gravitational-wave strain amplitudes of our five AM CVns. The gravitational-wave strain amplitude his given by (see Roelofs et al. 2006b, after Timpano et al. 2006)
h= 2.84·10−22p
cos4i+ 6 cos2i+ 1
×
M
M⊙
5/3P
orb 1 hr
−2/3 d
1 kpc
−1
(15)
where M = (M1M2)3/5/(M1+M2)1/5 is the so-called chirp mass, and d the distance to the star. Figure 4 shows the resulting strain amplitudes of our five systems.
Fig. 2.—Constraints on the masses and radii of the donor stars, compared to degenerate and semi-degenerate evolutionary tracks from Nelemans et al. (2001). The dotted diagonals represent the Roche-lobe filling solutions for the different systems. The solid-line regions represent the constraints on the masses from Table 2. We see that, apart from GP Com, the donors appear to be rather semi-degenerate.
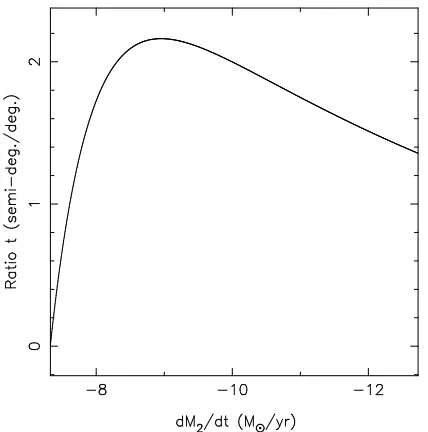
Fig. 3.—Ratio of the integrated times spent at a given mass transfer rateor higher, for a 0.6M⊙white dwarf accreting from a
fully degenerate (0.25M⊙) and a semi-degenerate (0.2M⊙) donor
star as modeled by Nelemans et al. (2001). Semi-degenerate sys-tems are seen to spend about twice as long at phases of relatively high mass transfer, 10−10.M˙
2.10−8M⊙/yr, corresponding to
the mass transfer rates found for AM CVn, HP Lib, CR Boo and V803 Cen.
note that, as long as the uncertainty about the orbital frequency is larger than the frequency resolving power of LISA (∆f ∼ t−1
obs ∼ 10
−8Hz, for a mission duration
tobs= 1 yr), the chances of confusion with Galactic noise sources decrease greatly with more accurately known or-bital periods for these systems. The oror-bital period of AM CVn is known to an accuracy of better than one part
[image:10.612.328.551.74.285.2]per million from large time-base photometric monitoring
Fig. 4.—Predicted gravitational-wave strain amplitudeshand frequenciesf of the five AM CVn stars for which we obtained an HST parallax. The upper and lower dashed lines show the de-sign sensitivities ofLISAfor a signal-to-noise ratio of 5 and 1, re-spectively, in one year of data-collecting (Larson et al. 2000). The solid line is a population synthesis prediction for the confusion-limited Galactic background, also for a mission duration of one year (Nelemans et al. 2004).
(PAM CVn = 1028.7322±0.0003 s, Skillman et al. 1999), and the orbital period of HP Lib also seems quite secure (PHP Lib = 1102.70±0.05 s, Patterson et al. 2002), but the orbital periods of especially V803 Cen and CR Boo seem to be less well-known. It would be worthwhile to measure the orbital periods of these systems with greater accuracy.
[image:10.612.69.283.358.574.2]REFERENCES
Anderson, S.F. et al. 2005, AJ, 130, 2230 Benedict, G.F. et al. 2002a, AJ, 123, 473 Benedict, G.F. et al. 2002b, AJ, 124, 1695
Benedict, G.F., & McArthur, B.E. 2005, IAU Colloq. 196: Transits of Venus: New views of the Solar system and the Galaxy, 333 Bergeron, P., Saffer, R.A., & Liebert, J. 1992, ApJ, 394, 228 Bessell, M. S. & Brett, J. M. 1988, PASP, 100, 1134
Bildsten, L., Townsley, D., Deloye, C. J., & Nelemans, G. 2006, ApJ, 640, 466
Bildsten, L., Shen, K.J., Weinberg, N.N., & Nelemans, G. 2007, ApJL, accepted (astro-ph/0703578)
Cardelli, J.A., Clayton, G.C., & Mathis, J.S. 1989, ApJ, 345, 245 Cox, A. N. 2000, Allen’s astrophysical quantities, 4th ed. Publisher:
New York: AIP Press, Springer, 2000. Edited by Arthur N. Cox. (AQ2000)
Deloye, C. J., Bildsten, L. & Nelemans, G. 2005, ApJ, 624, 934 Deloye, C. J., Taam, R.E., Winisdoerffer, C., & Chabrier, G. 2007,
ApJ, submitted
El-Khoury, W. & Wickramasinghe, D. 2000, A&A, 358, 154 Espaillat, C., Patterson, J., Warner, B., & Woudt, P. 2005, PASP,
117, 189
Greenstein, J.L., & Matthews, M.S. 1957, ApJ, 126, 14 Hirose, M., & Osaki, Y. 1990, PASJ, 42, 135
Iben, I.Jr. & Tutukov, A.V. 1991, ApJ, 370, 615
Iben, I.Jr., Tutukov, A.V., & Fedorova, A.V. 1998, ApJ, 503, 344 Landau L. D., & Lifschitz E. M. 1971, The Classical Theory of
Fields (Reading, MA: Addison-Wesley)
Larson, S.L., Hiscock, & W.A., Hellings, R.W. 2000, Phys. Rev. D, 62, 062001
Lutz, T. E. & Kelker, D. H. 1973, PASP, 85, 573
Marsh, T. R., Horne, K., & Rosen, S. 1991, ApJ, 366, 535 Marsh, T. R. 1999, MNRAS, 304, 443
Marsh, T. R., Nelemans, G. & Steeghs, D. 2004, MNRAS, 350, 113 McArthur, B. E., et al. 2001, ApJ, 560, 907
Morales-Rueda, L., Marsh, T. R., Steeghs, D., Unda-Sanzana, E., Wood, J. H., & North, R. C. 2003, A&A, 405, 249
Nather, R.E., Robinson, E.L., & Stover, R.J. 1981, ApJ, 244, 269 Nasser, M. R., Solheim, J.-E., & Semionoff, D. A. 2001, A&A, 373,
222
Nelan, E., & Makidon, R. in HST Data Handbook, version 4.0, ed. B. Mobasher, Baltimore, STScI
Nelemans, G., Portegies Zwart, S.F., Verbunt, F., & Yungelson, L.R. 2001, A&A, 368, 939
Nelemans, G., Yungelson, L. R., & Portegies Zwart, S. F. 2004, MNRAS, 349, 181
Nelemans, G. 2005, in ASP Conf. Ser. 330, The Astrophysics of Cataclysmic Variables and Related Objects, ed. J.-M. Hameury & J.-P. Lasota (San Francisco: ASP), 27
O’Donoghue, D., Menzies, J.W., Hill, P.W. 1987, MNRAS, 227, 347
O’Donoghue, D., Kilkenny, D., Chen, A., Stobie, R.S., Koen, C., Warner, B., & Lawson, W.A. 1994, MNRAS, 271, 910
Panei, J.A., Althaus, L.G., & Benvenuto, O.G. 2000, A&A, 353, 970
Patterson, J. 2001, PASP, 113, 736
Patterson, J., Walker, S., Kemp, J., O’Donoghue, D., Bos, M., & Stubbings, R. 2000, PASP, 112, 625
Patterson, J., et al. 1997, PASP, 109, 1100 Patterson J., et al. 2002, PASP, 114, 65 Patterson J., et al. 2005, PASP, 117, 1204
Pearson J.K. 2007, MNRAS, accepted (astro-ph/0705.0141v1) Podsiadlowski, Ph., Han, Z., & Rappaport, S. 2003, MNRAS, 340,
1214
Roelofs, G.H.A., Groot, P.J., Marsh, T.R., Steeghs, D., Barros, S.C.C., & Nelemans, G. 2005, MNRAS, 361, 487
Roelofs, G.H.A., Groot, P.J., Marsh, T.R., Steeghs, D., & Nelemans, G. 2006a, MNRAS, 365, 1109
Roelofs, G.H.A., Groot, P.J., Nelemans, G., Marsh, T.R., & Steeghs, D. 2006b, MNRAS, 371, 1231
Roelofs, G.H.A., Groot, P.J., Nelemans, G., Marsh, T.R., & Steeghs, D. 2007a, MNRAS, accepted (astro-ph/0705.0402v1) Roelofs, G.H.A., Nelemans, G., & Groot, P.J. 2007b, MNRAS,
submitted
Savage, B. D. & Mathis, J.S. 1979, ARA&A, 17, 73 Schmidt, M. 1975, ApJ, 202, 22
Skillman, D.R., Patterson, J., Kemp, J., Harvey, D.A., Fried, R.E., Retter, A., Lipkin, Y., & Vanmunster, T. 1999, PASP, 111, 1281 Smith, H. 2003, MNRAS, 338, 891
Soderblom, D.R., Nelan, E., Benedict, G.F., McArthur, B., Ramirez, I., Spiesman, W., & Jones, B.F. 2005, AJ, 129, 1616 Stroeer, A., & Vecchio, A. 2006, Classical and Quantum Gravity,
submitted (astro-ph/0605227) Thorstensen, J.R. 2003, AJ, 126, 3017
Timpano, S.E., Rubbo, L.J., Cornish, N.J. 2006, Phys. Rev. D, 73, 122001
Tsugawa, M. & Osaki, Y. 1997, PASJ, 49, 75
Tutukov, A.V., & Fedorova, A.V. 1989, Soviet Ast., 33, 606 van Altena, W. F., Lee, J. T., & Hoffleit, E. D. 1995, Yale Parallax
Catalog (4th ed.; New Haven, CT: Yale Univ. Obs.) (YPC95) Warner, B. 1995, Cataclysmic Variable Stars (Cambridge:
Cambridge University Press) Whitehurst, R., 1988, MNRAS, 232, 35
Whitehurst, R., & King, A., 1991, MNRAS, 249, 25
Wood, M.A., Winget, D.E., Nather, R.E., Hessman, F.V., Liebert, J., Kurtz, D.W., Wesemael, F., & Wegner, G. 1987, ApJ, 313, 757
APPENDIX
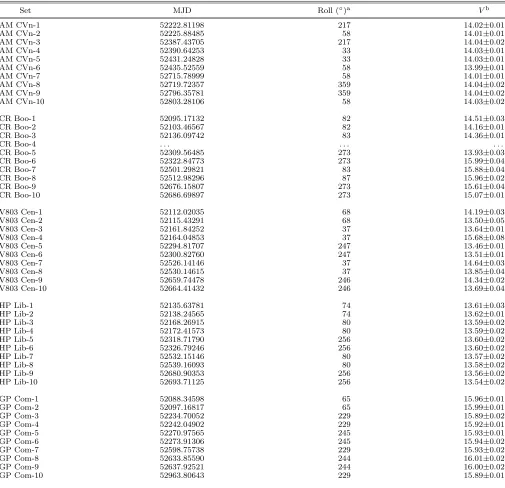
TABLE 3
Log of Observations and FGS Photometry
Set MJD Roll (◦)a Vb
AM CVn-1 52222.81198 217 14.02±0.01
AM CVn-2 52225.88485 58 14.01±0.01
AM CVn-3 52387.43705 217 14.04±0.02
AM CVn-4 52390.64253 33 14.03±0.01
AM CVn-5 52431.24828 33 14.03±0.01
AM CVn-6 52435.52559 58 13.99±0.01
AM CVn-7 52715.78999 58 14.01±0.01
AM CVn-8 52719.72357 359 14.04±0.02
AM CVn-9 52796.35781 359 14.04±0.02
AM CVn-10 52803.28106 58 14.03±0.02
CR Boo-1 52095.17132 82 14.51±0.03
CR Boo-2 52103.46567 82 14.16±0.01
CR Boo-3 52136.09742 83 14.36±0.01
CR Boo-4 . . . .
CR Boo-5 52309.56485 273 13.93±0.03
CR Boo-6 52322.84773 273 15.99±0.04
CR Boo-7 52501.29821 83 15.88±0.04
CR Boo-8 52512.98296 87 15.96±0.02
CR Boo-9 52676.15807 273 15.61±0.04
CR Boo-10 52686.69897 273 15.07±0.01
V803 Cen-1 52112.02035 68 14.19±0.03
V803 Cen-2 52115.43291 68 13.50±0.05
V803 Cen-3 52161.84252 37 13.64±0.01
V803 Cen-4 52164.04853 37 15.68±0.08
V803 Cen-5 52294.81707 247 13.46±0.01
V803 Cen-6 52300.82760 247 13.51±0.01
V803 Cen-7 52526.14146 37 14.64±0.03
V803 Cen-8 52530.14615 37 13.85±0.04
V803 Cen-9 52659.74478 246 14.34±0.02
V803 Cen-10 52664.41432 246 13.69±0.04
HP Lib-1 52135.63781 74 13.61±0.03
HP Lib-2 52138.24565 74 13.62±0.01
HP Lib-3 52168.26915 80 13.59±0.02
HP Lib-4 52172.41573 80 13.59±0.02
HP Lib-5 52318.71790 256 13.60±0.02
HP Lib-6 52326.79246 256 13.60±0.02
HP Lib-7 52532.15146 80 13.57±0.02
HP Lib-8 52539.16093 80 13.58±0.02
HP Lib-9 52680.90353 256 13.56±0.02
HP Lib-10 52693.71125 256 13.54±0.02
GP Com-1 52088.34598 65 15.96±0.01
GP Com-2 52097.16817 65 15.99±0.01
GP Com-3 52234.70052 229 15.89±0.02
GP Com-4 52242.04902 229 15.92±0.01
GP Com-5 52270.97565 245 15.93±0.01
GP Com-6 52273.91306 245 15.94±0.02
GP Com-7 52598.75738 229 15.93±0.02
GP Com-8 52633.85590 244 16.01±0.02
GP Com-9 52637.92521 244 16.00±0.02
GP Com-10 52963.80643 229 15.89±0.01
aSpacecraft roll as defined in Chapter 2, FGS Instrument Handbook (Nelan & Makidon 2002).b Average of 2 to 4 observations at each
TABLE 4
Reference Star Positions
ID ξa ηa
AM CVnb
ref-2 −77.5390 0.0003 −137.4972 0.0002
ref-3 159.3017 0.0003 −173.8572 0.0002
ref-5 60.260 0.0003 −88.9279 0.0002
CR Booc
ref-2 −192.2319 0.0003 −49.5013 0.0002
ref-3 −242.6593 0.0002 −3.4712 0.0001
ref-4 304.3653 0.0003 -16.0044 0.0002
ref-5 250.2984 0.0006 19.8065 0.0004
ref-6 437.8449 0.0009 9.7262 0.0006
V803 Cend
ref-2 78.2233 0.0003 42.8896 0.0002
ref-3 −119.9175 0.0003 −26.1711 0.0002
ref-4 −55.0075 0.0002 110.9745 0.0002
ref-5 −122.0958 0.0002 67.3278 0.0002
ref-6 137.4346 0.0002 39.0072 0.0002
HP Libe
ref-2 89.3402 0.0003 −66.1514 0.0002
ref-3 249.1257 0.0003 −18.3677 0.0002
ref-4 9.8453 0.0004 77.8612 0.0003
ref-5 −4.4333 0.0003 55.4678 0.0002
ref-6 −311.6452 0.0003 −13.1930 0.0002
GP Comf
ref-2 81.0209 0.0002 33.9032 0.0001
ref-3 88.3580 0.0002 95.1984 0.0001
ref-4 80.9519 0.0002 −73.6567 0.0001
ref-5 105.5746 0.0003 30.4648 0.0002
ref-6 −103.6979 0.0002 101.5386 0.0002
a ξandηare relative RA and Dec in arcsecondsb 12h34m54s.58, +37◦37′43.′′4, J2000, epoch 2002.44c 13h48m55s.29, +07◦57′34.′′8, J2000,
[image:14.612.53.563.460.728.2]epoch 2002.14d 13h23m44s.51, −41◦44′30.′′4, J2000, epoch 2002.07e 15h35m53s.08, −14◦13′12′′.3, J2000, epoch 2002.14f 13h05m42s.85, +18◦01′02′′.6, J2000, epoch 2001.99
TABLE 5
Reference Star Spectrophotometric Parallaxes
ID Spectral Type V MV AV m−M πabs(mas)
AM CVn
ref-2 G4V 14.37 5.0 0.05 9.4±0.7 1.3±0.4
ref-3 K6V 15.15 7.6 0.05 7.5 0.7 3.2 1.0
ref-5 G4V 12.42 5.0 0.05 7.5 0.7 3.3 1.0
CR Boo
ref-2 G9V 15.57 5.74 0.02 9.8 0.7 1.1 0.4
ref-3 M2III 11.40 −0.6 0.02 12.0 0.7 0.4 0.1
ref-4a F2V 6.81 3.0 0.02 3.8 0.7 16.9 0.9
ref-5 G0V 14.82 4.4 0.02 10.4 0.7 0.8 0.3
ref-6 G7V 11.93 5.4 0.02 6.5 0.7 5.1 1.6
V803 Cen
ref-2 K1V 15.86 6.2 0.31 9.7 0.7 1.3 0.4
ref-3 G4V 15.34 5.0 0.31 10.4 0.7 0.9 0.3
ref-4 F6.5V 13.38 3.8 0.31 9.6 0.7 1.4 0.4
ref-5 G6V 14.17 5.3 0.31 8.9 0.7 1.9 0.6
ref-6 F8V 14.15 4.0 0.31 10.2 0.7 1.1 0.4
HP Lib
ref-2 F5V 12.86 3.5 0.34 9.4 0.7 1.6 0.5
ref-3 G9V 14.06 5.7 0.34 8.4 0.7 2.6 0.8
ref-4 K7V 12.57 7.9 0.34 4.7 0.7 14.0 4.5
ref-5 K4V 11.80 7.1 0.34 4.7 0.7 13.6 4.4
ref-6 A2.5V 14.60 1.3 0.34 13.3 1.0 0.3 0.1
GP Com
ref-2 G0V 15.17 4.4 0.02 10.8 0.7 0.7 0.2
ref-3 G8V 14.39 5.58 0.02 8.8 0.7 1.7 0.6
ref-4 K0V 14.25 5.58 0.02 8.7 0.7 1.8 0.6
ref-5 K5V 13.56 7.4 0.02 6.2 0.7 5.7 1.9
ref-6 G8V 15.12 5.58 0.02 9.5 0.7 1.2 0.4
TABLE 6
FGS and Near-IR Reference Star Photometry
ID V K J−H J−K V −K
AM CVn
ref-2 14.37 0.1 12.79 0.03 0.44 0.04 0.43 0.03 1.58 0.10
ref-3 15.15 0.1 12.09 0.02 0.74 0.04 0.82 0.03 3.06 0.10
ref-5 12.42 0.1 10.88 0.02 0.41 0.04 0.42 0.03 1.54 0.10
CR Boo
ref-2 15.57 0.1 13.64 0.05 0.47 0.05 0.48 0.05 1.93 0.11
ref-3 11.4 0.1 7.13 0.05 0.91 0.02 1.13 0.05 4.28 0.11
ref-4 14.8 0.1 5.93 0.01 0.21 0.04 0.22 0.02 0.87 0.05
ref-5 6.8 0.1 13.54 0.05 0.34 0.05 0.27 0.06 1.46 0.11
ref-6 11.89 0.1 . . . .
V803 Cen
ref-2 15.86 0.1 13.42 0.04 0.53 0.04 0.62 0.04 2.44 0.11
ref-3 15.34 0.1 13.58 0.04 0.45 0.04 0.43 0.05 1.76 0.11
ref-4 13.38 0.1 11.96 0.02 0.29 0.03 0.33 0.03 1.42 0.10
ref-5 14.17 0.1 12.29 0.02 0.42 0.03 0.51 0.03 1.88 0.10
ref-6 14.15 0.1 12.45 0.03 0.35 0.03 0.36 0.04 1.70 0.10
HP Lib
ref-2 12.88 0.1 11.40 0.02 0.30 0.03 0.34 0.03 1.48 0.10
ref-3 14.11 0.1 11.93 0.02 0.51 0.03 0.51 0.03 2.18 0.10
ref-4 12.6 0.1 9.17 0.02 0.69 0.03 0.84 0.03 3.43 0.10
ref-5 11.84 0.1 8.87 0.02 0.66 0.03 0.77 0.03 2.97 0.10
ref-6 14.6 0.1 . . . .
GP Com
ref-2 15.17 0.1 13.73 0.05 0.34 0.04 0.36 0.06 1.44 0.11
ref-3 14.39 0.1 12.62 0.03 0.43 0.03 0.46 0.03 1.77 0.10
ref-4 14.25 0.1 12.24 0.03 0.46 0.03 0.54 0.03 2.01 0.10
ref-5 13.56 0.1 10.71 0.02 0.67 0.02 0.74 0.03 2.85 0.10
[image:15.612.52.563.461.710.2]ref-6 15.12 0.1 13.44 0.04 0.40 0.04 0.53 0.05 1.68 0.11
TABLE 7
FieldAV from Reference Star Spectrophotometry
ID Spectral Type (V−K)0 V −K E(V −K) AVa hAVi
AM CVn 0.05±0.02
ref-2 G4V 1.52 1.58 0.06 0.07
ref-3 K6V 3.01 3.06 0.05 0.06
ref-5 G4V 1.52 1.54 0.02 0.02
CR Boo 0.03±0.04
ref-2 G9V 1.88 1.93 0.05 0.05
ref-3 M2III 4.30 4.28 −0.02 −0.02
ref-4 F2V 0.86 0.87 0.01 0.01
ref-5 G0V 1.41 1.46 0.05 0.06
V803 Cen 0.31±0.09
ref-2 K1V 2.14 2.44 0.30 0.33
ref-3 G4V 1.52 1.76 0.24 0.26
ref-4 F6.5V 1.19 1.42 0.23 0.26
ref-5 G6V 1.67 1.88 0.21 0.23
ref-6 F8V 1.28 1.70 0.42 0.46
HP Lib 0.34±0.06
ref-2 F5V 1.10 1.48 0.38 0.42
ref-3 G9V 1.88 2.18 0.3 0.33
ref-4 K7V 3.17 3.43 0.26 0.29
ref-5 K4V 2.68 2.97 0.29 0.32
GP Com 0.02±0.11
ref-2 G0V 1.41 1.44 0.03 0.03
ref-3 G8V 1.80 1.77 −0.03 −0.03
ref-4 K0V 1.96 2.01 0.05 0.05
ref-5 K5V 2.70 2.85 0.15 0.16
ref-6 G8V 1.80 1.68 −0.12 −0.14
aA