MASTER THESIS
CHATBOTS’ PERCEIVED
USABILITY IN
INFORMATION RETRIEVAL
TASKS: AN EXPLORATORY
ANALYSIS.
Gunay Tariverdiyeva
S1857509
DEPT. OF COGNITIVE PSYCHOLOGY AND ERGONOMICS EXAMINATION COMMITTEE
Dr. Simone Borsci
Prof. Dr. Frank Van Der Velde
DOCUMENT NUMBER -
Chatbots’ Perceived Usability in Information Retrieval Tasks: An Exploratory Analysis. Master Thesis
Gunay Tariverdiyeva (s185759)
Dept. of Cognitive Psychology and Ergonomics University of Twente
Examination Committee: Dr. Simone Borsci Prof. Dr. Frank Van Der Velde
Abstract
Despite many benefits, a substantial number of chatbots struggle to satisfy users. To understand what factors influence interaction with a chatbot and how to assess those factors, the present study aimed to; (a) explore the factors that are essential for user satisfaction, (b)
investigate UMUX-Lite scale as a usability measure of a chatbot, and to (c) propose a design approach for a potential usability questionnaire. The research consisted of three phases: a
systematic literature review, an online survey, and an interaction test. A comprehensive literature review identified 27 factors that influence interaction with a chatbot. Further, the initial list was filtered via the online survey in which 11 experts and 9 end-users participated. Next, the
interaction test with 15 participants was conducted to get the perspective of users who just had experience with chatbots and to assess UMUX-Lite as a usability measure for chatbots. The online survey and interaction test distinguished 18 factors as important for satisfactory chatbot interactions. Furthermore, the current study found that UMUX-Lite is reasonably sensitive and a reliable measure of usability. However, as UMUX-lite does not include all the aspects important for measuring the perceived usability of the chatbot there is a concern about the extent of the sensitivity and validity of the scale. These findings suggest a need for a post-test questionnaire that will be able to capture more aspects of interaction with chatbots. Therefore, the present study recommends the development of a new questionnaire that will incorporate UMUX-Lite and proceed further on the basis of the key factors established in this study.
Table of Contents
1. INTRODUCTION ... 4
1.1 Conversational Agents ... 4
1.2 The Rise of Chatbots ... 5
1.3 Study Aims and Outline ... 6
2. SYSTEMATIC LITERATURE REVIEW ... 8
2.1 Methods ... 8 2.2 Results ... 10 3. ONLINE SURVEY ... 11 3.1 Methods ... 11 3.1.1 Participants ... 11 3.1.2 Apparatus ... 12
3.1.3 Design and Procedures ... 12
3.1.4 Data Analysis ... 12 3.2 Results ... 13 3.2.1 Experts ... 13 3.2.2 End-users ... 16 4. INTERACTION TEST ... 17 4.1 Methods ... 17 4.1.1 Participants ... 17 4.1.2 Apparatus ... 17
4.1.3 Design and Procedures ... 18
4.1.4 Data Analysis ... 19
4.2 Results ... 20
4.2.1 UMUX-Lite and Comparative Analysis of Test Pairs ... 20
4.2.2 Post-test survey ... 21
4.2.3 Debrief results ... 23
5. FINAL LIST OF FACTORS ... 25
6. DISCUSSION ... 27
6.1 Key Factors ... 27
6.2 UMUX-Lite as Measure of Usability and Its Limitations ... 27
6.3 General Limitations ... 29 6.4 Recommendations ... 29 7. CONCLUSION ... 30 References ... 31 Appendix A ... 38 Appendix B ... 40 Appendix C ... 70
1. INTRODUCTION
Communication between humans through natural language is fascinating. It is not surprising that the way humans communicate with each other and perceive this communication has been studied for centuries. For example, by now it is well established that the style in which information is expressed can influence how we perceive information that is being communicated (Tubbs, 2013). However, what happens when our conversation partners are conversational agents (CAs)––bots developed to mimic human interaction? How do we perceive communication style that is so similar to the natural language we use, yet different? In contrast to humans, conversing in natural language is not an innate capability of robots––it is something that is programmed into them through complex programming techniques. Even though it is possible to track patterns in a conversation and create conversation schemas (McTear, Callejas, Barres, 2016) in order to teach machines how to chat with humans, it is often not enough to withstand the volatile nature of the natural language. Nevertheless, the “natural” aspect of the language–– the possibility of the users to interact with technology in natural language––is what makes conversational agents so
appealing. Use of the natural language as a mode of interaction can make technology much more accessible and effortless (Gnewuch, Morana, & Maedche, 2018). This is why studying the ways humans perceive interaction with conversational agents is important.
1.1 Conversational Agents
Conversational agents can be described as a "software that accepts natural language as an input and generates natural language as an output, engaging in a conversation with the user" (Griol, Carbó, & Molina, 2013). An interaction between the user and the agent happens through the conversational interface (CI). A conversational interface provides front-end to the CA and enables a user to interact with software by using speech, text, touch, and various other input and output modes (McTear, 2017). McTear, Callejas and Barres (2016) divided CIs into categories based on the communities that historically worked on CIs: spoken dialogue systems (SDSs), voice user interface (VUIs), embodied conversational agents (ECA), and chatbots. These communities often worked independently of each other and the types of CIs they developed differed in their goals and methods. Chatbots are CAs that simulate a conversation in natural language via text input and automatic text output (McTear, Callejas, & Barres, 2016). Originally chatbots were developed to try and fool users to believe that they are talking to another human. They were designed to maintain a small-talk and used a stimulus-response approach where users input is matched against a large set of stored patterns to generate a response (McTear et al.,
2016). Consequently, such an approach made chatbots more reliant on the user's input and less likely to initiate conversation.
Demand on chatbots is growing (Nguyen, 2017)and due to this demand, areas of application are expanding as well (e.g. education, information retrieval, customer service, e-commerce, health, finance). This creates new requirements that push chatbots to broaden their boundaries further and incorporate features from other types of conversational interfaces. Currently, many chatbots deploy more complex techniques, more initiative, are embodied (avatar, talking animation), use speech output that are characteristics to other CA communities. 1.2 The Rise of Chatbots
Dialogue-based systems have been around for a relatively long time, and programmers started to work on advancing speech-enabled interactive systems from the late-’80s (McTear et al., 2016). However, the rise and tipping point of chatbot development can be observed from 2016 (McTear, 2017). Only within launch year of bot platform on Facebook Messenger, the number of developed bots surpassed 100,000 and currently marks over 300,000 (Johnson, 2018). Rapid development in this area has been influenced by several points (a) advances in artificial intelligence (AI), (b) the availability of big data, (c) increased connectivity of devices and cloud-based resources, (d) advances in Speech Recognition and Natural Language Processing (McTear, 2017). Furthermore, many major tech companies opened their platforms to CAs and started investing heavily into technologies like artificial intelligence, deep learning, natural language processing, that are essential for building a system that can interact with the user in natural language (McTear, 2017). Apart from the technological breakthroughs and investment of big tech companies’, interest to the CAs was also sparked by the shift in user behaviour towards messaging. In 2015 four top messaging apps exceeded four top social media networks with respect to global monthly active users (Nguyen, 2017).
Moreover, ease of implementation caused by technological developments and attention shift towards messaging platforms created a chance for the companies to reach their users in a new, more efficient, cost-effective and direct way (Toplin, 2017). WeChat, one of the most used apps in the Asian market, opened its platform for bots in 2013, and since then chatbots became one of the favourite ways for Chinese businesses to decrease workload that falls on the customer interaction (Van Eeuwen, 2017). In China WeChat enables its users to transfer money, order food, order a taxi, book a flight, all within its native app (Van Eeuwen, 2017). Even though adoption of chatbots is slower in the other parts of the world, there are still numerous cases
where chatbots succeeded and brought significant benefits both to the users and organisations around the world, for example:
• Sephora saw 11% increase in their makeover appointments (Kojouharov, 2018). • More than 70% of orders that 1–800-Flowers gets over Facebook Messenger chatbot are from the new customers (Kojouharov, 2018). • KLM raised customer interactions by 40% and helped 15% of customers to get their boarding passes (Kojouharov, 2018). • Swedbank’s chatbot, engages in 40,000 conversations in a month and solves 81% of them (Kojouharov, 2018). • JPMorgan Chase saved over 360,000 hours of manpower in less than a year (Kojouharov, 2018).
1.3 Study Aims and Outline
Despite many success stories and hypothesised benefits, there is a substantial number of chatbots that struggle to deliver on their promise and disappear from the web (Araujo, 2018; Gnewuch et al., 2018). This raises a question––why do some chatbots succeed and others fail? The growth and failures CIs have experienced last five years opened an opportunity for new discussions and created further questions to answer. Currently, researchers are only catching up on the new challenges (Araujo, 2018). Moreover, an ambition to integrate CIs into the daily lives of the users has introduced novel challenges. Nevertheless, work on CAs promises to change the interaction of humans with technology as we know it today (Følstad & Brandtzaeg, 2017).
One question that needs more exploration is perceived usability of chatbots and its assessment. At present, there is a lack of literature on the tools that can be used to evaluate perceived usability of chatbot from user’s perspective, that is practical and can be directly applied to the development process. For reasons beyond the scope of this thesis, there exists a communication gap between practitioners and academia and consequently, there is a lack of cohesive information on what factors are essential to designing a successful chatbot. Current academic literature is mostly focused either on the architecture and assessment of chatbot architecture or on very narrow aspects of the interaction between user and chatbot (e.g., Chakrabarti & Luger (2015); Huang, Li, Lin, & Yang (2015); Meira & Canuto (2015); Peeters (2016)). Such studies are not sufficient enough to inform and guide the developers throughout
design process. There is a need for studies that give a more extensive overview and practical tools that can be applied by designers on a daily basis.
RQ 1. What are the key factors that affect perceived usability in interaction with chatbots?
Furthermore, the literature review conducted in the present study did not identify a questionnaire or instrument specialised on evaluating perceived usability in interaction with chatbots that could be directly applied to the design process. Although there are generic tools to assess the usability of the system, thus fur not all these tools have been tested and shown to be valid and reliable in measuring the usability of chatbots. Therefore, it would be neglectful to assume that these tools are reliable and valid measures of usability in chatbots without testing. Further, the existence of standardised tools for usability assessment does not imply that there is no room for new methods and tools. New methods and tools can be designed to benefit from existing standardised tools and expand on them to fit specific requirements of CAs.
RQ 2. Is standardized usability questionnaire such as UMUX-Lite (Lewis, Utesch, & Maher, 2013) enough to inform about perceived usability of a chatbot?
The goal of this exploratory study is to identify a list of key factors that shape the
perception of usability in interaction with chatbots and propose direction for the development of the new tool based on the key factors and existing tools. To reach this goal present study aims to:
A. Review factors that play a role in chatbots’ perceived usability by examining present literature.
B. Examine the reliability and validity of UMUX-Lite (Lewis, Utesch, & Maher, 2013) in measuring perceived usability of a chatbot.
C. Inform the development of a potential new tool that will be more suited for the assessment of chatbots’ perceived usability.
Overall research can be divided into three phases: the systematic literature review, the online survey, and the interaction test. Following sections will discuss these phases in more details. Section 2 will discuss the systematic literature review and its results. Section 3 will cover the methods and results (expert and end-user results) of the online survey. Section 4 describes the interaction test phases (pre-test, test, post-test), methods, and results (UMUX-Lite, Comparative Analysis of Test Pairs, post-test survey, debrief). Section 5 is intended to present the final list of the factors that were vetted based on the online survey and the interaction test. Finally, Section 6 will discuss results and general findings of the study.
2. SYSTEMATIC LITERATURE REVIEW
The literature review was conducted to explore aspects that influence a user's perception of the chatbot. It was a pivotal part of the study as discovered factors were planned to be used in
the online survey and the interaction test. Subsequently, once the list was formed, it was presented to experts and general end-users by means of an online survey and to participants in an interaction test. As each group has a different perspective and motive towards chatbots, it can
help to identify factors that are important in shaping perceived usability of the user. 2.1 Methods
The systematic literature review was qualitative and followed the phenomenological method (Randolph, 2009). Cooper's (1988) Taxonomy of Literature Reviews was used to plan and create a frame for the literature review. The rationale was to identify factors that contribute to the perceived usability in interaction with CA. Thus, the review focused on the studies that include findings and theories on factors that can potentially influence perceived usability of CA and studies that include assessment methods that might inform about criteria used during the assessment. Data was collected from journal databases (Scopus, Web of Science), Google Scholar and Google search engines, industry leaders' websites (Google, Amazon), and subject-specific professional websites. Search terms used in the search queries are: "conversational interface", "conversational agent", "chatbot", "interaction", "quality", "satisfaction". Considering the ever-evolving nature of the study subject and rapid growth in the interest towards CAs, database search included articles within the past ten years. Search query was also configured to limit results to journal articles and conference proceedings. A database search on Scopus was initially configured to exclude studies about virtual assistants and voice-controlled devices as they have qualities that do not coincide with another CAs and specifically with chatbots.
However, further review of the literature proved that such sources also could contribute to the list of factors. Thus, the rest of the review did not exclude studies about virtual assistants and voice-controlled devices. More details of the database search are reflected in the search query syntaxes included in Appendix A.
Data from Scopus and Web of Science were compiled in reference management software (EndNote X8, Boston, MA, USA) and duplicates were removed. After duplicates were removed, abstracts of the documents were screened. Documents that described technical aspects and measurements of the CA and records that did not inform about CA's interactive characteristics were excluded from the list of eligible papers. The items in the literature review were analysed
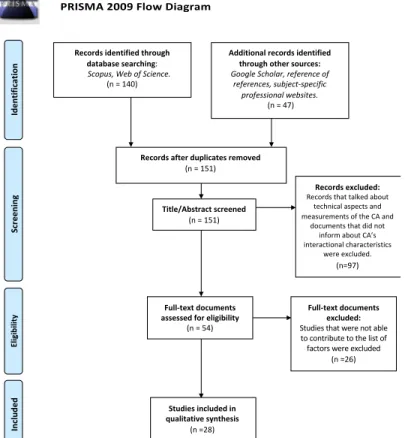
based on the abstract and introduction to establish compliance with inclusion and exclusion criteria. After the screening, the remaining full text of the documents was assessed to determine the eligibility of the papers. When the list of qualified materials and factors were identified, they were examined more closely to create an initial pool of factors. During this stage, documents eligible for the study were used to form items for the list of factors. A PRISMA 2009 Flow Diagram was used to present the flow throughout the different stage of a systematic review (Moher, Liberati, Tetzlaff, Altman, & PRISMA Group, 2009) (see Figure 1).
The review started from research in journal databases. However, it was not as fruitful as expected, so the research continued in the references of the relevant papers and Google Scholar. Only one study, written by Radziwill & Benton (2017), attempted to compile a comprehensive list of factors. The list from this study was used as a groundwork to the later developed list in Figure 2. Each factor from Radziwill and Benton's (2017) list was reviewed for relevance to the current study and tracked to its source. In the review process, new factors and sources were added, and some were excluded. Factors that were excluded were mainly the ones that affected the overall quality of the CA but were not that relevant to the perceived quality of the interaction.
Figure 1. PRISMA 2009 Flow Diagram
PRISMA 2009 Flow Diagram
Title/Abstract screened
(n = 151)
Records after duplicates removed
(n = 151)
Records identified through database searching: Scopus, Web of Science.
(n = 140) Sc re e ning Inc lude d Eligibility Ide ntif ic ation
Additional records identified through other sources: Google Scholar, reference of
references, subject-specific professional websites.
(n = 47)
Records excluded: Records that talked about
technical aspects and measurements of the CA and
documents that did not inform about CA’s interactional characteristics
were excluded.
(n=97)
Full-text documents assessed for eligibility
(n = 54)
Full-text documents excluded:
Studies that were not able to contribute to the list of factors were excluded
(n =26)
Studies included in qualitative synthesis
2.2 Results
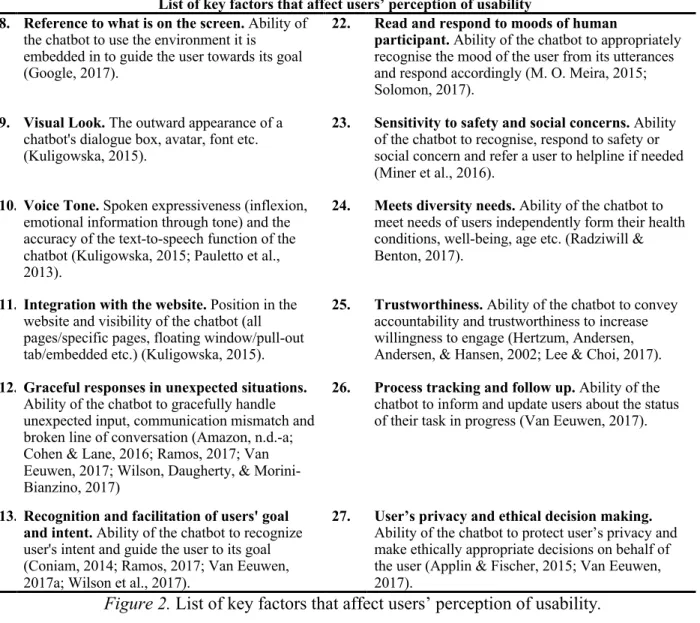
The rationale behind systematic literature was to identify and compile a list of factors that had contributed to the perceived usability in interaction with CAs. The literature review showed that many factors could affect the perception of the users. Forty-seven factors were identified from the literature. As a result, 47 factors that might affect the perception of interaction with CA were identified. Later similar factors were grouped in one broader factor, reducing number of factors to 27. These factors were compiled into a list along with their interpretations (Figure 2). Later, these factors were used to learn the opinion of developers, participants and end-users.
List of key factors that affect users’ perception of usability 1. Response Time. Ability of the chatbot to
respond timely to users' requests (Amazon, n.d.-b).
15. Perceived ease of use. The degree to which a
person believes that to interact with a chatbot would be free of effort (Van Eeuwen, 2017).
2. Multi-thread conversation. Ability of the
chatbot to recognise and process multiple parallel topics simultaneously (Staven, 2017)
16. Engage in on-the-fly problem solving. Ability of
the chatbot to solve problems instantly on the spot (Solomon, 2017).
3. Maxim of quantity. Ability of the chatbot to
respond in an informative way without adding too much information (Gnewuch et al., 2018; Google, 2017).
17. Themed discussion. Ability of the chatbot to
maintain a conversational theme once introduced and to keep track of the context to understand the user’s utterances (Google, 2017; Kirakowski, Odonnell, & Yiu, 2009; Kuligowska, 2015).
4. Maxim of quality. Ability of the chatbot to
avoid false statements/information (Gnewuch et al., 2018; Google, 2017).
18. Breadth of knowledge. Ability to exhibit
knowledge that it is out of its immediate domain during a conversation (Cohen & Lane, 2016; Kirakowski, Odonnell, & Yiu, 2009; Vetter, 2002)
5. Maxim of manners. Ability of the chatbot to
make it is purpose clear and communicate without ambiguity (Gnewuch et al., 2018; Google, 2017).
19. Initiative. Ability of the chatbot to initiate
conversation (or offer cues) for further discussion by presenting its functionality, offering suggestions etc. (Amazon, n.d.-c; Google, 2017; Kirakowski et al., 2009; Kuligowska, 2015; Staven, 2017)
6. Maxim of relation. Ability of the chatbot to
provide the relevant and appropriate contribution to people needs at each stage (Gnewuch et al., 2018; Google, 2017).
20. Personality. Ability of the chatbot to convey
personality, warmth, and authenticity by providing greetings, self-introductory, empathy, information etc. (Amazon, n.d.-a; Kirakowski et al., 2009; Kuligowska, 2015; Lee & Choi, 2017; Solomon, 2017)
7. Appropriate degrees of formality. Ability of
the chatbot to use appropriate language style for the context (Kirakowski et al., 2009).
21. Interaction enjoyment. Chatbot is perceived as
enjoyable and engaging to operate regardless of whether it provides in terms of information (Lee & Choi, 2017; Van Eeuwen, 2017).
List of key factors that affect users’ perception of usability 8. Reference to what is on the screen. Ability of
the chatbot to use the environment it is embedded in to guide the user towards its goal (Google, 2017).
22. Read and respond to moods of human
participant. Ability of the chatbot to appropriately
recognise the mood of the user from its utterances and respond accordingly (M. O. Meira, 2015; Solomon, 2017).
9. Visual Look. The outward appearance of a
chatbot's dialogue box, avatar, font etc. (Kuligowska, 2015).
23. Sensitivity to safety and social concerns. Ability
of the chatbot to recognise, respond to safety or social concern and refer a user to helpline if needed (Miner et al., 2016).
10. Voice Tone. Spoken expressiveness (inflexion,
emotional information through tone) and the accuracy of the text-to-speech function of the chatbot (Kuligowska, 2015; Pauletto et al., 2013).
24. Meets diversity needs. Ability of the chatbot to
meet needs of users independently form their health conditions, well-being, age etc. (Radziwill & Benton, 2017).
11. Integration with the website. Position in the
website and visibility of the chatbot (all pages/specific pages, floating window/pull-out tab/embedded etc.) (Kuligowska, 2015).
25. Trustworthiness. Ability of the chatbot to convey
accountability and trustworthiness to increase willingness to engage (Hertzum, Andersen, Andersen, & Hansen, 2002; Lee & Choi, 2017).
12. Graceful responses in unexpected situations.
Ability of the chatbot to gracefully handle unexpected input, communication mismatch and broken line of conversation (Amazon, n.d.-a; Cohen & Lane, 2016; Ramos, 2017; Van Eeuwen, 2017; Wilson, Daugherty, & Morini-Bianzino, 2017)
26. Process tracking and follow up. Ability of the
chatbot to inform and update users about the status of their task in progress (Van Eeuwen, 2017).
13. Recognition and facilitation of users' goal and intent. Ability of the chatbot to recognize
user's intent and guide the user to its goal (Coniam, 2014; Ramos, 2017; Van Eeuwen, 2017a; Wilson et al., 2017).
27. User’s privacy and ethical decision making.
Ability of the chatbot to protect user’s privacy and make ethically appropriate decisions on behalf of the user (Applin & Fischer, 2015; Van Eeuwen, 2017).
Figure 2. List of key factors that affect users’ perception of usability.
3. ONLINE SURVEY
An online survey was designed to compare the opinions of the experts and end-users. Opinions of the experts and users were used to formalise the list of key factors essential for the
evaluation of perceived usability. 3.1 Methods
3.1.1 Participants
The survey respondents were 20 European participants and comprised of 11 end-users and 9 experts. Two of the 20 participants were female the rest were male. The average age of respondents was 38 with a standard deviation of 9.4 years An Italian company supported this project in kind (UserBot.ai) and they helped in the diffusion of the survey. Thus, about 95% of
the participants were Italian. Five out of nine experts have two or fewer years of experience with chatbots, three have two to five years, and one has more than five years of experience. All end-users hold at least a high school education and use chatbots at least once a week. Each participant has been presented a consent form that included information about the study and the contact details of researchers at the beginning of the survey. Respondents who answered to less than ten factors were excluded from the sample, leaving 9 expert and 8 end-user data useful for the analysis.
3.1.2 Apparatus
The primary tool used in this part of the study was an online survey. The online survey was created through an online survey platform (Qualtrics, Provo, UT, USA) that can generate anonymous links which users can use to access the survey and fill it in. The survey consisted of: (a) consent form with study information, (b) personal and professional information, (c) 27 factors with descriptions on 7-point Likert scale with statements ranging from "Strongly disagree" to "Strongly Agree", (d) sorting task in which 27 factors can be categorised into ‘core’, ‘dependent’ and ‘marginal’ aspects (experts only), (e) survey feedback, (c) contact information in case
respondent is willing to participate in further research (Appendix B). The reinforced an informed consent form that was inserted to the beginning of the of the survey (Appendix B). Consent form template was retrieved from the University of Twente website and modified to meet the needs of this study.
3.1.3 Design and Procedures
The survey was exploratory and was administered online. The aim of the survey was mainly to get the opinion of the experts along with the interaction test participants. However, the survey was also open for the end-users who might want to fill in the survey. The survey included explanations for the factors and item descriptions to make sure respondents understood what was expected of them. The survey was configured in a way to show relevant questions based on whether the user is expert or end-user. The main difference in survey composition for these two groups was that end-users were not asked professional questions and were not presented with the sorting task. For more details on the individual survey items and structure refer to Appendix B.
3.1.4 Data Analysis
Data entered to the online survey was gathered and exported through survey management software (Qualtrics, Provo, UT, USA). Next data was cleaned and prepared for the analysis. Analysis started from 27 statements on a 7-point Likert scale that represented each factor. The
data file was split into two, based on the status of the respondents (expert or end-user).
Consequently, the statistical output was generated separately for each group. Median scores for each factor were calculated to discriminate the statements for which response results fall above and below 50 per cent of the scale. Interquartile ranges (IQRs) were used to interpret the spread of the data and to estimate the level of agreement per factor (Polisena et al., 2019).
Analysis of sorting task started with Fleiss’ Kappa method which is used to measure consensus between raters (experts) and rules out consensus by chance. In sorting task participants could assign factors into three categories; "marginal aspects", "core aspects", or "dependent aspects". In Fleiss’ Kappa method it is important that each case is evaluated the equal amount of times. Thus, Fleiss’ Kappa analysis was conducted with 7 experts since one expert did not fill in the sorting task at all and another one missed first 10 questions. Fleiss’ Kappa was calculated using an online calculator (Randolph, 2008). Further, to extrapolate factors with the strongest consensus, factors and categories were placed in rows and columns, forming a matrix. The number of times raters placed a factor to the specific category was inserted into the
corresponding cell. Then each factor was labelled based on which category had more counts. If there was a factor with the same number of counts for two categories, it was compared to the results from scale to decide which category it belongs to.
3.2 Results
3.2.1 Experts
Along with the demographic questions, scales and sorting questions, experts were also asked about their opinion on the following questions:
● On the basis of your knowledge, in your field which are the most frequently used
approaches applied by other companies to test quality perception of the end-users in interaction with chatbot?
● Which approaches do you usually use to test the quality perception of the end-users in
interaction with chatbot?
● Please briefly list, what are the main aspects which you take into account when you
design chatbots?
Majority of experts reported (a) observation of user’s interaction, (b) remote log analysis, (c) usability test with small groups to be most commonly used approaches applied by other companies to test the end-users perceived quality of the interaction with a chatbot. Whereas, majority experts noted personally using (a) observation of the user’s interaction, (b) conversation
analysis, (c) usability test with small groups, (d) interviews as an assessment method in their company. Before experts moved to the factors scale, they answered the question: what are the main aspects you take into account when you design chatbots? Experts replied the following:
● Expert 1: User experience, clear conversation flows, AI training.
● Expert 2: Efficiency, accuracy in the answers, the ability to understand the needs of the
user, speed in providing answers.
● Expert 3: Usability according to end user’s behaviour.
● Expert 4: Available data for training, the domain of application, available time for
realization, available computational power.
● Expert 5: Mobility Interaction Cleaned Design.
● Expert 6: Topic/general purpose, user category, UX design.
● Expert 7: The personality, the ability to give an answer to "non-conventional" words or
provocations, the possibility to establish an emphatic conversation, the ability to avoid loop answers.
● Expert 8: We take care to guide the user with buttons, hints and try to follow users’
intents in natural language processing with conversational hints.
The answers of the experts reflect differences in their perspectives and aspects they find important. These differences seem to originate from the roles they hold (i.e. developer, head of operations, researcher, designer). To determine which 27 factors expert reached strong
consensus––criteria for strong agreement and disagreement was established for the responses on a 7-point Likert scale. Factors with a median of ≤ 3 (i.e., factors that scored from "Somewhat disagree" to "Strongly disagree") and IQR in the range from 3 to 1 were regarded to have reached concurrence on a strong disagreement. Factors with a median ≥ 5, (i.e., factors that scored from "Somewhat agree" to "Strongly agree") with an IQR within range of 5 and 7 were considered to have reached consensus on a firm agreement with the suggested factor. The factors which IQRs did not fall between the range of 5 and 7 but had a median of ≥ 5 were excluded from the list in Figure 3. Median and IQR score for each factor is reported in Table 1.
Online survey results for each factor statement No. Factor Experts End-users Median (IQR) No. of participants (%) Median (IQR) No. of participants (%) F1 Response time 6 (5-6.5) 9 (100%) 6 (5-6.75) 8 (100%) F2 Multi-thread conversation 5 (4-6) 9 (100%) 5 (4-6) 8 (100%) F3 Maxim of quantity 6 (5-6) 9 (100%) 6 (4.25-6.75) 8 (100%) F4 Maxim of quality 7 (7-7) 9 (100%) 6 (4.5-7) 8 (100%) F5 Maxim of manners 7 (6-7) 9 (100%) 6 (4.25-6) 8 (100%) F6 Maxim of relation 6 (6-7) 9 (100%) 6 (5-6) 8 (100%) F7 Appropriate degrees of formality 6 (5.5-6) 9 (100%) 5 (3.5-5.75) 8 (100%)
F8 Reference to what is on the screen
7 (6-7) 9 (100%)
6 (4.25-6.75) 8 (100%)
F9 Visual Look 6 (4-6) 9 (100%) 4.5 (3-5.75) 8 (100%)
F10 Voice Tone 5 (4-6) 9 (100%) 4.5 (4-6) 8 (100%)
F11 Integration with the
website 6 (6-7) 8 (87.5%) 5 (5-6) 7 (87.5%) F12 Graceful responses in unexpected situations 6 (6-7) 8 (87.5%) 6 (6-7) 7 (87.5%) F13 Recognition and
facilitation of users' goal and intent
7 (6-7) 8 (87.5%)
6 (5-7)
7 (87.5%)
F14 Variation of responses 5 (4.25-5.75) 8 (87.5%) 4 (3-5) 7 (87.5%)
F15 Perceived Ease of Use 6 (4-6.75) 8 (87.5%) 6 (5-6) 7 (87.5%)
F16 Engage in on-the-fly problem solving 6 (5.25-7) 8 (87.5%) 6 (5-6) 7 (87.5%) F17 Themed discussion 6 (5.25-6.75) 8 (87.5%) 5 (4-7) 7 (87.5%) F18 Breadth of knowledge 5 (4-5) 8 (87.5%) 5 (4-7) 7 (87.5%) F19 Initiative 5 (4.25-6) 8 (87.5%) 5 (3-5) 7 (87.5%) F20 Personality 6 (5-7) 8 (87.5%) 5 (4-6) 7 (87.5%) F21 Interaction enjoyment 4.5 (2.50-5.75) 8 (87.5%) 4.50 (2.50-5.25) 6 (75%)
F22 Read and respond to
moods of human participant
5.5 (5-6) 8 (87.5%) 5 (4-6) 6 (75%)
F23 Users' privacy and ethical
decision making
7 (6-7) 8 (87.5%) 7 (6-7) 6 (75%)
F24 Sensitivity to safety and
social concerns
6.5 (5-7) 8 (87.5%) 5.5 (3.75-6.25)
6 (75%)
F25 Meets neurodiverse needs 6 (5-6.75) 8 (87.5%) 5 (3.75-6.25) 6 (75%)
F26 Trustworthiness 6 (5-6) 8 (87.5%) 4.50 (3.75-6.25)
6 (75%)
Online survey results for each factor statement
follow up
Table 1. Online survey results for each factor statement.
Analysis of median scores and IQRs of 27 factors on 7-point Likert scale showed
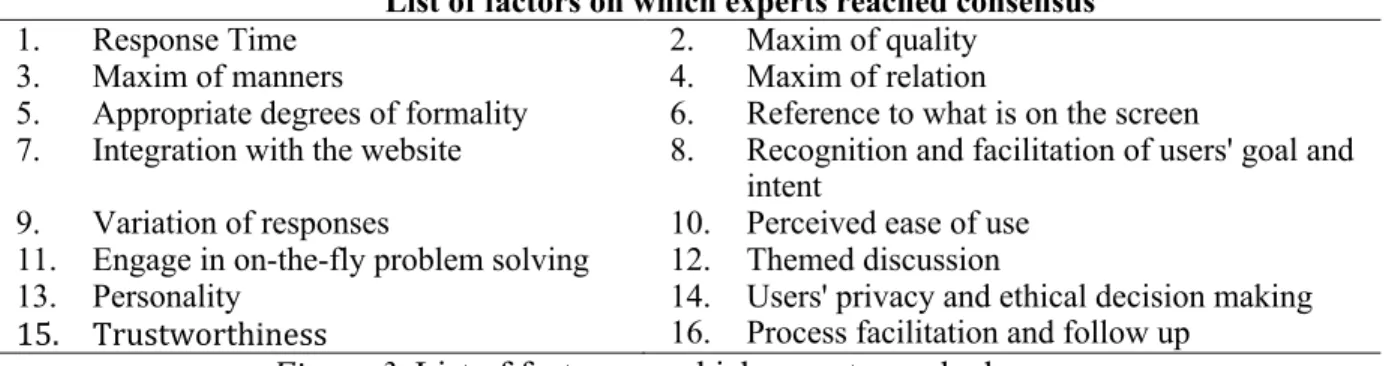
agreement on 19 factors. Analysis of the sorting task revealed that not all the factors that experts strongly agreed on in response to the scales are indeed important. On the contrary, some factors that experts did not strongly agree in their responses to the scales are perceived to be important. Inter-rater reliability for the sorting task showed slight agreement between raters, k= 0.12 (7 items) with 42% overall agreement. Which indicates that results obtained from the sorting task are reliable enough to be used in the analysis. Subsequently, results of the sorting task helped to refine the list of 16 factors that experts find important in the assessment of chatbots perceived usability (Figure 3).
Figure 3. List of factors on which experts reached consensus 3.2.2 End-users
End-users were also presented 27 factors with descriptions on the 7-point Likert scale. Selection procedure of the factors that will be included in the list was similar to the experts. Factors with a median ≥ 5, (i.e., factors that scored from "Somewhat agree" to "Strongly agree") with an IQR within range of 5 and 7 were considered to have reached consensus on a firm agreement and were added to the list. The factors which IQRs did not fall between the range of 5 and 7 but had a median of ≥ 5 were excluded from the lists in Figure 4. Median and IQR score for each factor is reported in Table 2. Analysis of median scores and IQRs from Table 1 showed that end-users reached firm consensus on 11 factors that are reported in Figure 4.
List of factors on which end-users reached consensus
1. Response time 2. Recognition and facilitation of users' goal and intent
3. Maxim of relation 4. Perceived Ease of Use
5. Appropriate degrees of formality 6. Engage in on-the-fly problem solving 7. Reference to what is on the screen 8. Users' privacy and ethical decision making
List of factors on which experts reached consensus
1. Response Time 2. Maxim of quality 3. Maxim of manners 4. Maxim of relation
5. Appropriate degrees of formality 6. Reference to what is on the screen
7. Integration with the website 8. Recognition and facilitation of users' goal and intent
9. Variation of responses 10. Perceived ease of use 11. Engage in on-the-fly problem solving 12. Themed discussion
13. Personality 14. Users' privacy and ethical decision making 15. Trustworthiness 16. Process facilitation and follow up
9. Integration with the website 10. Process facilitation and follow up 11. Graceful responses in unexpected
situations
Figure 4. List of factors on which end-users reached consensus.
4. INTERACTION TEST
The interaction test was designed and conducted for the following two reasons: (a) get perspective of the users with recent experience (reduce memory biases) and (b) check the reliability of the UMUX-Lite (Lewis, Utesch, & Maher, 2013) as a measurement of satisfaction
during the interaction with chatbots. 4.1 Methods
4.1.1 Participants
The interaction test involved 16 participants in total. Two out of 16 participants were pilot participants. Records of the first pilot participants were lost due to a technical issue, therefore, they were not included in the study leaving a total of 15 participants of which seven were female and eight male. Participants were students of the University of Twente and were recruited through the test-subject pool system or via convenience sampling. There was no screening of the participants each participant that signed up was admitted for participation, however, signees were notified beforehand that they would require a good command of English before they signed up. Subjects recruited through test-subject pool system received credit points for their participation.
The mean age of participants was 23 with a standard deviation of 3.8 years. Eight of the participants were male, and seven female and they were from the Netherlands, Germany, Britain, Colombia, India, USA, Mexico, and Spain. All participants have obtained at least a high school diploma and have at least intermediate level of English. Majority of participants were from Engineering and Psychology background however there was one person with Philosophy and one with Computer Science background. Even though all participants stated that they were familiar with chatbots to a certain degree, five participants also stated that they did not use chatbots before.
4.1.2 Apparatus
The experiment was conducted in a quiet lab room. Lab room included essential
equipment as desk, chairs, desktop computer and a webcam. To administer the surveys this part of the study also used online research platform (Qualtrics, Provo, UT, USA). Usability test software was used to record the interaction test as a whole. Only data from debriefing was used
in the qualitative analysis of the data. Materials used during the interaction test were the informed consent form, test script, pre-test survey, task cards, UMUX-Lite (Lewis et al., 2013) and post-test survey. Materials can be found in Appendix C.
4.1.3 Design and Procedures
The interaction test had two conditions "Chatbot" and "Web Navigation." The experiment had a 2x6 within-group design. Tasks were paired, which means that a participant executed the same scenario once with chatbot and once with web navigation. Moreover, tasks were
randomised and efforts were taken to ensure that paired tasks did not follow each other. During the interaction test, participants were instructed to think aloud and to fill in the UMUX-Lite scale (Lewis et al., 2013) after the end of each task. Scenarios were divided into three categories: embodied chatbots (2 tasks), text chatbots (2 tasks), messenger chatbots (2 tasks).
The interaction test can be divided into three phases: pre-test, test, and post-test. Pre-test phase started by greeting the participant, giving study information and shortly explaining
chatbots if the participant is unsure what is a chatbot. After all the essential information has been verbally presented, the participant was given two copies of the consent form. One copy had to be signed and returned and the participant kept the second copy. After the participant signed the consent form, he or she was presented with a pre-test survey on a computer screen.
Pre-test phase was followed by the test phase where participants had to perform a series of tasks with chatbots and web navigation. First, a more detailed explanation of the test was given. Participants were briefed on (a) how to use tools, (b) how to fill in the survey, (c) how to act, (d) how to think aloud, and (e) how to interact with test administrator. To clarify what is expected of the participant, the think-aloud protocol was demonstrated to the participant as an example. The administrator also emphasised that there is no right, or wrong answer and every comment of the participant is a valuable contribution.
When a participant had no questions and was ready to start, the test administrator started recording the test. Before actual test scenarios were given to the participants, they were asked to interact with a chatbot called Mitsuku (https://www.pandorabots.com/mitsuku/) to practice for 1-2 minutes. Mitsuku is a chatbot that was designed to imitate a teenager and converses with users on general topics. Once the participants were ready to move onto the main tasks, the test
administrator presented the first task card to the user. Participants were encouraged to ask questions if the scenarios were unclear. Task cards were organised in two decks based on conditions and were shuffled before each participant or when two same tasks followed each
other. Right after participants notified of the completion of the task, they filled in UMUX-Lite (Lewis et al., 2013) and marked the task code that was given on the task card. Participants repeated the procedure until all the tasks were finished.
Post-test phase consisted of a debrief and post-test questionnaire (Appendix C). After the last task was completed, the participants were asked to answer questions about the experience they had today interacting with chatbots (Appendix C). All participants answered the same set of questions. Test administrator stopped recording after debriefing. Debrief was followed by the post-test questionnaire where participants had to express their agreement about statements that represented each factor (Appendix C). Participants were encouraged to ask questions if any statement was unclear. When participants were done with filling in the survey, they were thanked for participation and were notified about the end of the experiment.
4.1.4 Data Analysis
Data entered into the pre-test, post-test survey and UMUX-Lite was gathered and exported through online survey platform (Qualtrics, Provo, UT, USA). Afterwards, data was cleaned and prepared for analysis. The main purpose of the data collected from the pre-test survey was to establish sample demographic.
UMUX-Lite scores were calculated with the formula provided by Lewis et al. (2013) that provide scores corresponding with SUS scores. Mean UMUX-Lite scores per chatbot and
website were computed to explore their level of usability in relation to each other. Since, applied formula produced scores corresponding to SUS, obtained scores can be regarded as SUS scores.
Sourcing data from 446 studies and more than 5,000 individual SUS responses, Sauro and Lewis (2012) found the overall mean score of the SUS to be 68 with a standard deviation of 12.5. Further, they proposed curve grading scale (CGS) for SUS scores. CGS is in the range from F (absolutely unsatisfactory) to A+ (absolutely satisfactory). A grade above and including C is considered to be acceptable. Grades and corresponding SUS scores are listed below:
● Grade F (0–51.7) ● Grade D (51.8–62.6) ● Grade C– (62.7–64.9) ● Grade C (65.0–71.0) ● Grade C+ (71.1–72.5) ● Grade B– (72.6–74.0) ● Grade B (74.1–77.1)
● Grade B+ (77.2–78.8) ● Grade A– (78.9–80.7) ● Grade A (80.8–84.0) ● Grade A+ (84.1–100)
Additionally, Sauro and Lewis (2012) also found that public facing large scale websites showed an average score of 67, interactive voice response (IVR) system showed an average score of 79.9 and a combination of web-based IVR showed score average score of 59.2 (Sauro, 2011). CGS will be used to review mean SUS scores for websites and chatbots.
Moreover, a paired-samples t-test was conducted to see if the observed difference in mean SUS scores for chatbot and website conditions are significant. Cronbach's alpha was used to assess the inter-item reliability of the Lite. To calculate Cronbach's alpha all UMUX-Lite scores in chatbot condition for Item 1 and Item 2 were compiled in the new dataset. Then reliability analysis was performed to get Cronbach’s alpha.
Like the online survey, the 27 statements about key factors for the usability of chatbots was presented in the post-test phase of the interaction test, and IQRs were calculated to establish an agreement (Polisena et al., 2019). Participants’ answers to debrief questions (Appendix C) were noted down from the test recordings and qualitatively analysed. For each question, answers that overlapped were grouped and reported as one general theme.
4.2 Results
4.2.1 UMUX-Lite and Comparative Analysis of Test Pairs
Reliability of ɑ=0.885 (15 items) was found for UMUX-Lite in chatbot condition. For website condition reliability coefficient was ɑ= 0.902 (15 items). For both conditions, findings are in line with Lewis et al. (2013). Results of paired t-test (Table 2) showed significant
differences in the mean SUS scores for Inbenta (M=28.16, SD=22.63, t(14)=4.82 , p=0.001) and Australian Tax Office (M=-16.61, SD= 17.54, t(14)=-3.66, p=0.003) pairs. Although, a t-test showed that there was a difference for the chatbots Hipmunk, Finn, Yoko, Veronica, Julie, the difference was not significant (Table 2).
Hipmunk pair has grades close to each other, with chatbot(C) showing score barely above average and website below the average. Finnair chatbot(B–) and website(A–) both have
acceptable SUS scores. Yoko has a mean score below average(C-), meanwhile, its website alternative has usability grade above average(B). Inbenta’s Veronica has the lowest usability score (50.70) among all the test articles which can be interpreted as completely unsatisfactory(F).
However, Inbenta’s website was rated to be satisfactory (B+). Amtrack’s chatbot(B) and website(B+) had almost the same level of satisfaction, with chatbot being rated a bit higher. Australian Tax Office chatbot has the highest grade(A) among all test articles and is far above average, whereas, the website is barely passing average mark(C). Overall, chatbots have higher standard deviation scores compared to websites, which indicates that there is more variance in the opinions of the raters in a chatbot condition than in website. Nevertheless, websites of Hipmunk, Google and Australian Tax Office also show variance in responses.
Mean UMUX-Lite scores, standard deviations per task pairs and paired t-test results
Tasks Website Chatbot t-test Mean (CGS) SD Mean (CGS) SD Mean
difference
t(df) /p-value Hipmunk (Hipmunk) 60.09 (A–) 21.36 68.40 (C) 22.12 –8.30 t(14)=–1.07
p=0.303
Finn (Finnair) 79.95 (A–) 5.36 73.84 (B–) 20.51 6.11 t(14)=1.33 p=0.205 Yoko (Toshiba) 74.90 (B) 18.17 64.42 (C–) 15.41 10.47 t(14)=1.55 p=0.142 Veronica (Inbenta) 78.87 (B+) 11.87 50.70 (F) 21.75 28.26 t(14)=4.82 p=0.001 Julie (Amtrack) 73.45 (B–) 9.30 74.17 (B) 11.73 –0.72 t(14)=–0.2 p=0.845
Alex (Australian Tax
Office) 66.23 (C) 18.19 82.84 (A) 5.95 –16.61
t(14)=–3.66 p=0.003 Table 2. Mean UMUX-Lite scores, standard deviations per task pairs and paired t-test results.
4.2.2 Post-test survey
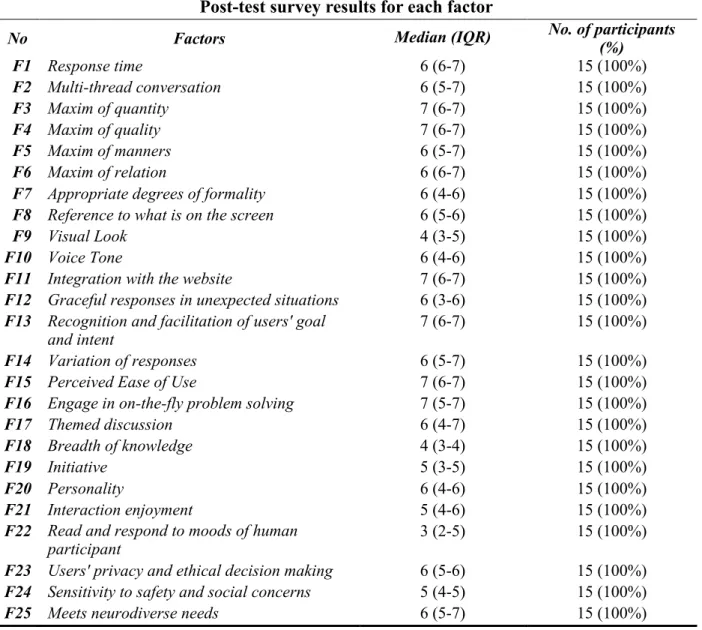
Median and IQR were computed for responses per each factor. Median and IQR score for each factor is reported in Table 3. Next, inclusion criteria were applied for each factor. Factors with a median ≥ 5, (i.e., factors that scored from "Somewhat agree" to "Strongly agree") with an IQR range of 5 and 7 were considered to have reached consensus on a firm agreement and were added to the list. Analysis of participants' answers to 27 usability factors on 7-points Likert scale showed a strong consensus on 16 factors listed in Figure 5.
List of factors on which interaction test participants reached consensus.
1. Response time 2. Recognition and facilitation of users' goal and intent
3. Multi-thread conversation 4. Variation of responses 5. Maxim of quantity 6. Ease of Use
7. Maxim of quality 8. Engage in on-the-fly problem solving 9. Maxim of manners 10. Users' privacy and ethical decision making 11. Maxim of relation 12. Meets neurodiversity needs
13. Reference to what is on the screen 14. Trustworthiness
15. Integration with the website 16. Process facilitation and follow up
Figure 5. List of factors on which interaction test participants reached consensus. Post-test survey results for each factor
No Factors Median (IQR) No. of participants (%) F1 Response time 6 (6-7) 15 (100%) F2 Multi-thread conversation 6 (5-7) 15 (100%) F3 Maxim of quantity 7 (6-7) 15 (100%) F4 Maxim of quality 7 (6-7) 15 (100%) F5 Maxim of manners 6 (5-7) 15 (100%) F6 Maxim of relation 6 (6-7) 15 (100%)
F7 Appropriate degrees of formality 6 (4-6) 15 (100%)
F8 Reference to what is on the screen 6 (5-6) 15 (100%)
F9 Visual Look 4 (3-5) 15 (100%)
F10 Voice Tone 6 (4-6) 15 (100%)
F11 Integration with the website 7 (6-7) 15 (100%)
F12 Graceful responses in unexpected situations 6 (3-6) 15 (100%)
F13 Recognition and facilitation of users' goal
and intent
7 (6-7) 15 (100%)
F14 Variation of responses 6 (5-7) 15 (100%)
F15 Perceived Ease of Use 7 (6-7) 15 (100%)
F16 Engage in on-the-fly problem solving 7 (5-7) 15 (100%)
F17 Themed discussion 6 (4-7) 15 (100%)
F18 Breadth of knowledge 4 (3-4) 15 (100%)
F19 Initiative 5 (3-5) 15 (100%)
F20 Personality 6 (4-6) 15 (100%)
F21 Interaction enjoyment 5 (4-6) 15 (100%)
F22 Read and respond to moods of human
participant
3 (2-5) 15 (100%)
F23 Users' privacy and ethical decision making 6 (5-6) 15 (100%)
F24 Sensitivity to safety and social concerns 5 (4-5) 15 (100%)
Post-test survey results for each factor
F26 Trustworthiness 6 (5-7) 15 (100%)
F27 Process facilitation and follow up 7 (7-7) 15 (100%)
Table 3. Post-test survey results for each factor. 4.2.3 Debrief results
Participants’ answers to the questions given during debriefing are in line with the factors on which they reached agreement consensus on in Figure 4. Analysis of the answers revealed some patterns and repeated themes. Discovered patterns for each question are reported in the next paragraphs.
Q1: What are the things that you did not like during your interaction with chatbot? Seven out of 15 participants stated that they do not like to rephrase a question several times in order to get results. Some participants also mentioned that they do not like adapting their conversational style to the chatbot, by simplifying their input. They prefer when chatbot
understands their full sentences because it feels more natural. Three participants mentioned that they did not like that it took them longer to accomplish their tasks with chatbots than they expected, and one commented that “it is supposed to be a faster way". Two participants mentioned that they did not like chatbots starting the conversation without them initiating it as they either felt obligated to answer or felt overwhelmed with the provided information. Three test participants noted their inability to find chatbot at all or spending too much time to search for it; they would prefer chatbot to be more visible like some chatbots they have tested. It is
important to note that two participants that could not find chatbot at all were the ones that were not well familiar with chatbots. Lastly, participants complained about chatbot outputs having too much information and providing to broad or generic answers.
Q2: What are the things that you liked during your interaction with chatbot? There are a couple of central themes in the answers for this question. Respondents pointed out that they appreciated fast instantaneous responses and directness of interaction in comparison to graphical user interfaces (GUIs). Concerning directness, they often mentioned that they just needed to ask, and they got information. A couple of people also mentioned that they liked it when chatbot exhibited personality or other anthropomorphic features.
Q3: Which chatbot did you enjoy interacting with the most? Why?
The chatbot that participants enjoyed the most was chatbot Alex on Australia's Tax Office website (Appendix C) seven participants suggested this chatbot. They mentioned that it was effortless and gave them the information they needed. Next with five responses was
Hipmunk's chatbot (Appendix C), participants liked it because, it was entertaining, gave various suggestions and feedback, predicted users' questions, remembered previous input, and had visuals. Finnair's chatbot (Appendix C) came third with four mentions, and participants liked it for the same reasons as Alex. Amtrack’s Julie (Appendix C) and Inbenta’s Veronica (Appendix C) also got one mention each. None of the users mentioned Toshiba’s chatbot Yoko (Appendix C).
Q4: With which chatbot did you not enjoyed interacting? Why?
Participant did not like interaction with Inbenta’s Veronica, because users could not get answers even after rephrasing their input, they felt like she did not understand them. Toshiba’s Yoko and Amtrack’s Julie both had three mentions, they did not like Yoko because she provided many links instead of a direct answer and had a synthetic voice and they did not like Julie
because she was hard to find and redirected users to the pages instead of giving a direct answer. Participants also mentioned Finnair's and Hipmunk's chatbots. None of the users mentioned Alex from the Australian tax office.
Q5: Can you tell me if you prefer more to use chatbots or website navigation? In which situations you would prefer using chatbots to the standard navigation?
Most of the participants stated that they prefer standard navigation. Since they are already familiar with the basic structure of the website and usually can easily find the information they want. However, many participants mentioned that they would be more likely to use chatbots after their experience during the interaction test. Correspondingly they stated that it depends on the chatbot and the situation. Participants said that they would use chatbot if they are on an
unfamiliar website or the large governmental website with much information. Additionally, they said they would use chatbot if they do not find needed information through the website. Some participants told that they would use chatbot if they have a specific question in mind. On the contrary, some participants remarked that they would prefer to use chatbot when they do not have an idea of what they need. Furthermore, participants mentioned that they would use chatbot if they need simple information, if the information is too complicated like flight search or repair instructions, they would prefer a website.
Q6: In your opinion, what qualities or features were missing, what features could be improved or added?
Participants told that they would like chatbot to offer more cues, for example, they would like chatbot to give cues and tell how to phrase questions like Finnair chatbot. Meanwhile, some
preferred chatbot to be more interactive and less robotic with anthropomorphic features (e.g. personality, avatar, voice, use of emojis) some users told that they would prefer chatbots to have less anthropomorphic features. Group of participants also said that they would prefer chatbots to be more visible (e.g. pop-up when opening the page) and have more visuals.
5. FINAL LIST OF FACTORS
To determine the final list of factors, data from the online survey and post-test survey was compiled together. This data included results for 27 usability factors on 7-points Likert scale filled in by experts, end-users and the interaction test participants. Similarly, to the procedure that was applied for online survey and the interaction test median and IQR for each factor was calculated and reported in Table 4.
Results from combined data for each factor
No Factors Median (IQR) No. of participants (%)
F1 Response time 6 (5-7) 32 (100%) F2 Multi-thread conversation 5 (4-6) 32 (100%) F3 Maxim of quantity 6 (5-7) 32 (100%) F4 Maxim of quality 7 (6-7) 32 (100%) F5 Maxim of manners 6 (5-7) 32 (100%) F6 Maxim of relation 6 (6-7) 32 (100%)
F7 Appropriate degrees of formality 6 (5-6) 32 (100%)
F8 Reference to what is on the screen 6 (5.25-7) 32 (100%)
F9 Visual Look 5 (3-6) 32 (100%)
F10 Voice Tone 5 (4-5) 32 (100%)
F11 Integration with the website 6 (5-7) 30 (93.75%)
F12 Graceful responses in unexpected
situations 6 (5.5-7) 30 (93.75%)
F13 Recognition and facilitation of users' goal
and intent 7 (6-7) 30 (93.75%)
F14 Variation of responses 5 (4-6) 30 (93.75%)
F15 Perceived Ease of Use 6 (6-7) 30 (93.75%)
F16 Engage in on-the-fly problem solving 6.5 (5.75-7) 30 (93.75%)
F17 Themed discussion 6 (5-7) 30 (93.75%)
F18 Breadth of knowledge 4 (3-5) 30 (93.75%)
F19 Initiative 5 (3.75-5.25) 30 (93.75%)
F20 Personality 5.50 (4-6) 30 (93.75%)
F21 Interaction enjoyment 5 (4-6) 29 (90.62%)
F22 Read and respond to moods of human
participant 5 (3-5.5) 29 (90.62%)
F23 Users' privacy and ethical decision
making 6 (6-7) 29 (90.62%)
Results from combined data for each factor
F25 Meets neurodiverse needs 6 (5-6.5) 29 (90.62%)
F26 Trustworthiness 6 (5-6) 29 (90.62%)
Table 4. Results from combined data for each factor
After calculations selection criteria were applied to the calculated results. Factors with a median ≥ 5, (i.e., factors that scored from "Somewhat agree" to "Strongly agree") with an IQR within range of 5 and 7 were considered to have reached consensus on a firm agreement and were added to the final list of factors that were considered to be important by all study
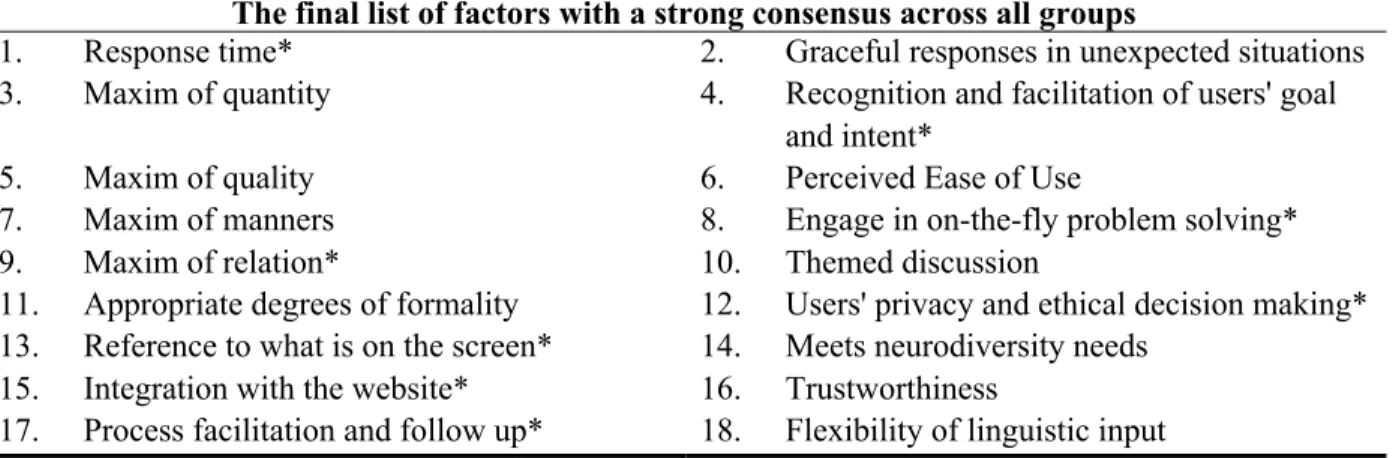
participants. Results show a strong consensus on 17 factors reported in Figure 5. From remaining ten factors nine reached agreement but had wider IQRs (between 3 and 6). For the factor
“Breadth of knowledge," neither agreement nor disagreement was reached among the raters. Additionally, inspection of results across all three groups (experts, end-users and interaction-test participants) (see Figures 3, 4 and 5) showed complete consensus on 7 factors out of 17, which are marked with "*" and presented in Figure 5.
Review of the interaction test debrief showed that participant found linguistics capabilities of chatbot important. Majority of the participants noted that they do not like rephrasing their sentences multiple times or would like chatbot to understand their input even though there is a mistake. Even though one of the factors in the initial list “graceful responses in the unexpected situation”, addresses this issue it only addresses the consequences of poor communication. Debrief showed that users find it important for chatbot to have good linguistic processing capabilities. Discussion linguistic processing abilities of the chatbot can be found in studies of Coniam (2014), Kuligowska (2015), and Kluwer (2011). Considering above
mentioned information “linguistic flexibility of input” was added as the 18th factor and marked by “**”. (see Figure 6).
The final list of factors with a strong consensus across all groups
1. Response time* 2. Graceful responses in unexpected situations 3. Maxim of quantity 4. Recognition and facilitation of users' goal
and intent*
5. Maxim of quality 6. Perceived Ease of Use
7. Maxim of manners 8. Engage in on-the-fly problem solving* 9. Maxim of relation* 10. Themed discussion
11. Appropriate degrees of formality 12. Users' privacy and ethical decision making* 13. Reference to what is on the screen* 14. Meets neurodiversity needs
15. Integration with the website* 16. Trustworthiness
17. Process facilitation and follow up* 18. Flexibility of linguistic input
6. DISCUSSION
The aim of this study was to (a) explore the factors that are essential for user satisfaction, (b) investigate UMUX-Lite scale as a usability measure of a chatbot, and to (c) propose a design approach for a potential usability questionnaire. This section will discuss results derived from
this exploratory study, its limitations, and future recommendations. 6.1 Key Factors
As it was mentioned in Section 5, results showed a firm consensus for 17 out of 27 factors (Figure 6). The additional 18th factor was added to the final list based on the results of the debriefing. However, comparison of the consensus across the groups (Figure 3, 4, 5) showed complete consensus for 7 out of 17 factors. This could indicate that these 7 factors are more relevant for assessing perceived usability. However, given the limitations of the study specifically modest sample size and exploratory nature of this study, it was decided to take a more conservative approach and retain a list of 17 factors. Although this study was able to identify key factors that affect perceived usability in interaction with chatbots, these factors need further refinement. Future studies need to be conducted to ensure that the result of the presents study is valid.
6.2 UMUX-Lite as Measure of Usability and Its Limitations
The study results showed that UMUX-Lite in chatbot condition had strong inter-item reliability (a= 0.885). It is consistent with the internal reliability score for UMUX-Lite Lewis et al. (2013) found in his study (a=0.86). This indicates that items are correlated with each other, and they measure the same underlying construct–usability. Comparison of the means via paired t-test only found a significant difference for Inbenta and Australian Tax Office pairs. Which indicates that, to a certain extent, UMUX-Lite is sensitive to detect changes in the tested systems and can discriminate among chatbots with low and high usability. However, differences were not significant for rest of the pairs which question the extent to which UMUX-Lite valid and
sensitive in measuring chatbots. Considering that several studies (Borsci, Federici, Bacci, Gnaldi, & Bartolucci, 2015; Lewis et al., 2013) found significant correlations between, SUS, UMUX and UMUX-Lite we can assume that these scales will produce similar results if they are used to measure satisfaction in chatbots.
There are some assumptions to why UMUX-Lite did not produce a significant difference for some pairs. One of the reasons for the insignificant difference might be a similar performance
of both chatbot and website. For example, comparative analysis (Section 4.2.1) showed that for the pairs Hipmunk, Finnair and Amtrak perceived usability for chatbot and website is on a similar level. Which might explain why the difference for this pairs were insignificant. It might have been possible to get more reliable results if pairs included one system that is known for good performance and one for bad, as in the study of Finstad (2010). However, the assumption that similar performance is the reason for insignificant difference does not hold itself completely. In the case of Toshiba pair, chatbot has a SUS score below average (64.42, C–) whereas website has a score above average (74.90, B) nonetheless results are still is insignificant.
Another assumption for insignificant differences might be the sample size. Tullis and Stetson (2004) investigated which standardized usability scale most quickly converged on the “correct” conclusion regarding the usability of two websites as a function of sample size–where “correct” conclusion meant a significant t-test consistent with the decision reached using the total sample size. The study showed that the SUS was the fastest to converge on the correct
conclusion, reaching 100% agreement at a sample size of 12. But it is not known if the same is true for UMUX-Lite.
Finally, UMUX-Lite is a relatively new scale and its reliability, validity and sensitivity in different situations for different types of interfaces is still under study. For example, we know that Bangor et al. (2008) found the SUS to be sensitive to differences among types of interfaces and changes made to a product. At the moment it is not fully established to what extent UMUX-Lite is sensitive to differences among types of interfaces and especially for the chatbots. The current study found that it is reliable measurement usability in chatbots. Nonetheless, there uncertainty regarding the content validity of the UMUX-Lite when it is applied to chatbots. Is UMUX-Lite able to fully assess the usability of the chatbot? Are all relevant aspects included?
We can see that from 18 factors that participants found important, UMUX-lite only measures one factor (perceived ease of use). Thus, it might be assumed that UMUX-Lite can inform about the usability of a chatbot, but it does not include all relevant aspects. This might explain why in Toshiba pair despite the overall differences in perceived usability, the result of the t-test was not significant. During the debriefing, participants mentioned not liking Yoko’s synthetic voice or the fact that instead of full answers she only presented more links.
Nevertheless, they managed to finish the task and retrieved information they needed.
use and usefulness. Information about the attitude towards other factors (voice tone, variation in responses, the maxim of relation and etc.) was not fully reflected in UMUX-Lite results. This might be the reason why despite reported quantitative and qualitative differences UMUX-Lite was not sensitive enough to produce a significant difference.
6.3 General Limitations
Several limitations may influence the interpretation and application of this study. Even though surveys presented descriptions for each factor, it is not clear how respondents interpreted the descriptions and the items of the survey. Additionally, although online survey and interaction test participants were given the same set of factors, descriptions of the statements were slightly different. This inconsistency could have affected the outcome of the results. Surveys used to measure the importance of the factors in the online survey and interaction test were not validated, therefore, there is a chance of error in results. Moreover, there is a chance that biases like task-selection, Hawthorne effect, social desirability, recency and primacy effects, could have affected the results of the research.
Furthermore, even though this survey attempted to capture most of the main factors, there is a possibility that some factors were overlooked. Analysis of the debrief showed that
participants also find important good linguistic processing capabilities of the chatbot that allows them to be more flexible with their input (see Section 4.2.3 and 5). Similarly, some other factors could have been missed during the literature review or interaction test due to the small sample size.
As it was mentioned in the methods section, an Italian company supported this project in kind (UserBot.ai) and they helped in the diffusion of the survey. Therefore, about 95% of experts that participated in the online survey were Italian. The fact that the majority of experts were from UserBot.ai, Italian, make results from online survey less generalizable to the experts from other parts of the world.
6.4 Recommendations
Results from the current study with a modest sample size showed that UMUX-Lite, to some degree, is sensitive to differences and is a reliable measure of usability. However, there is a concern about the extent of the sensitivity and validity of the scale. Research showed that
UMUX-lite does not include all the aspects important for measuring the perceived usability of the chatbot. This finding implies that there is a need for a post-test questionnaire that will have