http://go.warwick.ac.uk/lib-publications
Original citation:
Roelofs, G. H. A. et al. (2006). Phase-resolved spectroscopy of the helium dwarf nova
'SN 2003aw' in quiescence. Monthly Notices of the Royal Astronomical Society, 365(4),
pp. 1109-1113
Permanent WRAP url:
http://wrap.warwick.ac.uk/33932
Copyright and reuse:
The Warwick Research Archive Portal (WRAP) makes the work of researchers of the
University of Warwick available open access under the following conditions. Copyright ©
and all moral rights to the version of the paper presented here belong to the individual
author(s) and/or other copyright owners. To the extent reasonable and practicable the
material made available in WRAP has been checked for eligibility before being made
available.
Copies of full items can be used for personal research or study, educational, or
not-for-profit purposes without prior permission or charge. Provided that the authors, title and
full bibliographic details are credited, a hyperlink and/or URL is given for the original
metadata page and the content is not changed in any way.
Publisher’s statement:
"The definitive version is available at
www.blackwell-synergy.com
"
DOI: 10.1111/j.1365-2966.2005.09727.x
A note on versions:
The version presented here may differ from the published version or, version of record, if
you wish to cite this item you are advised to consult the publisher’s version. Please see
the ‘permanent WRAP url’ above for details on accessing the published version and note
that access may require a subscription.
arXiv:astro-ph/0510767v1 27 Oct 2005
Phase-resolved spectroscopy of the helium dwarf nova ‘SN
2003aw’ in quiescence
G. H. A. Roelofs,
1⋆P. J. Groot,
1T. R. Marsh,
2D. Steeghs
3and G. Nelemans
11Department of Astrophysics, Radboud University, PO Box 9010, 6500 GL Nijmegen, The Netherlands 2Department of Physics, University of Warwick, Coventry CV4 7AL, UK
3Harvard-Smithsonian Center for Astrophysics, 60 Garden Street, Cambridge, MA 02318, USA
5th February 2008
ABSTRACT
High time resolution spectroscopic observations of the ultra-compact helium dwarf nova ‘SN 2003aw’ in its quiescent state at V ∼ 20.5 reveal its orbital period at 2027.8±0.5 seconds or 33.80 minutes. Together with the photometric “superhump” period of 2041.5±0.5 seconds, this implies a mass ratio q≈0.036. We compare both the average and time-resolved spectra of ‘SN 2003aw’ and SDSS J124058.03−015919.2 (Roelofs et al. 2005). Both show a DB white dwarf spectrum plus an optically thin, helium-dominated accretion disc. ‘SN 2003aw’ distinguishes itself from the SDSS source by its strong calcium H & K emission lines, suggesting higher abundances of heavy metals than the SDSS source. The silicon and iron emission lines observed in the SDSS source are about twice as strong in ‘SN 2003aw’. The peculiar “double bright spot” accretion disc feature seen in the SDSS source is also present in time-resolved spectra of ‘SN 2003aw’, albeit much weaker.
Key words: stars: individual: SN 2003aw – binaries: close – novae, cataclysmic
variables – accretion, accretion discs – stars: individual: SDSS J124058.02-015919.2
1 INTRODUCTION
The AM CVn stars are ultra-compact binaries: white dwarfs accreting from a degenerate, helium-rich companion star. They have orbital periods shorter than about one hour, clearly indicating the evolved nature of their donor stars. Their accretion disc spectra show mainly helium, with no traces of hydrogen and varying contributions of heavy met-als. See Nelemans (2005) for a recent review.
No less than six new members of the small AM CVn family, including the first eclipsing system, have been found in the last year or so (Woudt & Warner 2005; Roelofs et al. 2005; Anderson et al. 2005). Optical spectroscopy of one of the new members, SDSS J124058.02−015919.2 (hereafter SDSS J1240, Roelofs et al. 2005) allowed for a measurement of the orbital period and of the mass ratio, and showed a peculiar and as yet not understood feature of two equally strong bright spots in the accretion disc, in strong contrast with the usual one bright spot attributed to the impact of the accretion stream into the disc. In this paper we present time-resolved spectroscopy of another recent addition to the family, and a close relative of SDSS J1240: ‘SN 2003aw’.
‘SN 2003aw’ was found as a supernova candidate in February 2003, based on an observed strong increase in brightness (maximumV∼16.5) and its supposed positional coincidence with a faint galaxy (Wood-Vasey et al. 2003),
but Chornock & Filippenko (2003) identified it spectroscop-ically as a helium-rich dwarf nova. Following their announce-ment, Woudt & Warner (2003) performed fast white-light photometry on the source, from which a periodic modula-tion of 2041.5±0.5 seconds was derived. They attributed this period to a superhump, although an analysis of the Fourier spectrum showed sidebands to the main period that could point to an orbital modulation rather than a superhump.
2
G. H. A. Roelofs et al.
Date UT Exposure Exposures time (s)
Magellan
2003/12/15 08:08–08:40 900 3
VLT
[image:3.612.340.511.105.220.2]2004/03/18 01:27–02:43 260 14 2004/03/19 00:24–01:23 260 14 2005/03/01 00:30–05:04 180 70 2005/03/02 00:37–03:33 180 39 03:38–05:22 240 22
Table 1.Summary of our observations of ‘SN 2003aw’.
2 OBSERVATIONS AND DATA REDUCTION
We obtained phase-resolved spectroscopy of ‘SN 2003aw’ on 18 and 19 March 2004, and on 1 and 2 March 2005 with the Very Large Telescope (VLT) of the European Southern Observatory and the FOcal Reducer/low dispersion Spec-trograph (FORS2). The observations consist of 159 spectra in the blue (grism 600B), most of them with a 180-second exposure time. Typical seeing was 0.6′′ giving an effective
resolution of∼4 ˚A; for 50 of the 159 spectra we used slightly longer exposure times of 240 or 260 seconds because of less perfect seeing conditions (∼1′′, resolution∼6 ˚A).
All VLT observations were done with a 1′′ slit. The
detector was the MIT CCD mosaic of which only chip 1 was used; binning was standard 2×2 pixels. Low read-out speed and high gain minimized the read-out and digitisation noise, respectively. In order not to add more noise to the spectra, we subtracted a constant bias level from each CCD frame. The bias level was determined per frame from the overscan regions on the CCD. A normalised flatfield frame was constructed from 5 incandescent lamp flatfield frames each night, which ensured a cosmic-ray-free final flatfield.
All spectra were extracted using the IRAF implementa-tion of optimal (variance-weighted) extracimplementa-tion. The read-out noise and photon gain, necessary for the extraction, were calculated from the bias and flatfield frames, respectively. Wavelength calibration was done with a standard HeHgCd arc exposure taken during the day. A total of around 40 arc lines could be fitted well with a Legendre polynomial of or-der 3 and 0.14 ˚A root-mean-square residual. All spectra were transformed to the heliocentric rest-frame prior to analysis. The average spectrum was corrected for instrumental response using spectroscopic standard star EG274.
In addition to the phase-resolved spectra described above, we obtained three 900-second spectra with the IMACS spectrograph on the Magellan–Baade telescope at Las Campanas Observatory on 15 December 2003. An 0.7′′
slit together with the 300 lines/mm grating provided cover-age between 3400–9500 angstrom at 4.6 ˚A resolution.
A summary of all observations is given in table 1.
3 RESULTS
3.1 Average spectrum
The flux-calibrated average spectrum of ‘SN 2003aw’ is shown in figure 1. It is a striking match to the average blue
Line Equivalent widths (˚A) SDSS J12401
‘SN 2003aw’2
Hei5876 −31
.3±0.5 −30.3±0.5 Hei6678 −19
.6±0.1 −18.5±1.1 Hei7065 −25
.0±0.1 −25.5±1.7 Hei7281 −10
.3±0.1 −11.3±2.2 Feii5169 −2
.1±0.2 −5.0±0.5 Siii6347 −2
.2±0.1 −4.0±0.4 Caii3934 0.0±0.5 −5.6±0.5 Caii3968 0.0±0.5 −5.6±0.5
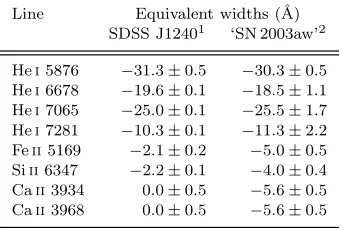
Table 2. Equivalent widths of several accretion disc emis-sion lines, including estimated errors. 1
Spectra published in Roelofs et al. (2005);2
Hei6678, 7065 & 7281 lines based on our Magellan spectrum (not shown).
spectrum of SDSS J1240 from Roelofs et al. (2005). The lat-ter is reproduced in figure 1 for easy reference. The spectrum of ‘SN 2003aw’ also shows the characteristic broad helium absorption lines, presumably from the accreting white dwarf, in addition to the double-peaked emission lines, mainly he-lium, from the accretion disc. There are a few differences: first, the accretion disc lines are much broader, extending to ∼1000 km/s FWHM, suggesting a higher inclination than SDSS J1240. Second, the accretion disc shows strong cal-cium H & K emission, in addition to the iron and silicon features also seen in SDSS J1240. Table 2 lists the equivalent widths of a number of accretion disc emission lines for both SDSS J1240 and ‘SN 2003aw’; the blue helium lines are omit-ted because of the strong influence of the underlying white dwarf’s absorption lines. The strengths of the helium lines are identical in both objects, whereas the heavy metal lines are significantly stronger in ‘SN 2003aw’. The Hei5876 line
is blended with a weak unidentified emission feature around 5896 ˚A in both objects, which might be Na D. This emission feature is included in the equivalent widths of the Hei5876
line in table 2.
3.2 The spectroscopic period
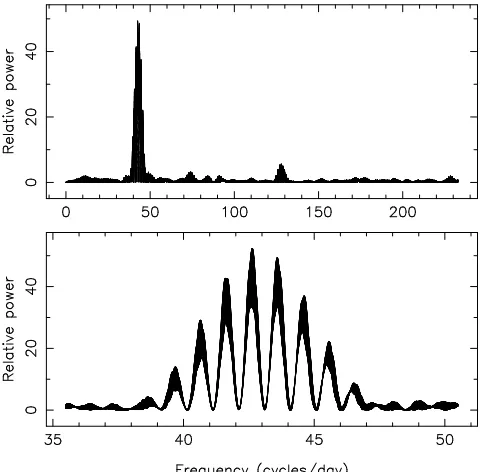
To determine the spectroscopic period of the binary, we used a modified version of the method used by Nather et al. (1981), as described in Roelofs et al. (2005). Figure 2 shows the resulting Lomb–Scargle periodogram of red wing–blue wing emission line flux ratios. The long baseline between our 2004 and our 2005 observations causes a fine pattern of aliases on top of the usual 1 day−1
aliases in the peri-odogram. The strongest peak occurs at 42.6 cycle/day. In addition to the main peaks around this frequency there ap-pears to be a weak group of higher harmonics much like in SDSS J1240 (Roelofs et al. 2005). The strongest harmonic is exactly three times the frequency of the overall strongest peak, compatible with a second bright spot in the accretion disc appearing 120 degrees out of phase.
3.3 Doppler tomography
3.3.1 Features of the accretion disc
[image:3.612.60.265.105.228.2]Figure 1.Average spectra of SDSS J1240 (top spectrum & left axis, Roelofs et al. 2005) and ‘SN 2003aw’ (bottom spectrum & right axis). The most prominent lines are labelled. Uncertain identifications carry a question mark.
Figure 2.Lomb-Scargle periodogram of the red wing/blue wing emission line flux ratios. The lower panel provides a magnified view of the strongest peaks.
lines of ‘SN 2003aw’. There is one strong emission bright spot causing a clear S-wave in the trailed spectra; the Hei 5015 line also shows a second S-wave at approximately 30% of the flux of the main S-wave. There are two lines in the current data that are also present in the SDSS J1240 data of Roelofs et al. (2005), namely Siii6347 and Hei5876; these
are compared directly in figure 4. The double bright spot pattern in the SDSS source is not reproduced in ‘SN 2003aw’, but there do seem to be very weak secondary bright spots at approximately the same position as in the SDSS source.
3.3.2 The orbital period
In section 3.2 we determined the spectroscopic period from a periodogram of red wing–blue wing emission line flux ratios. The clear kinematic S-wave feature in the trailed spectra, when phase-folded on this spectroscopic period, indicates that we are seeing the orbital motion of the binary. The strength and sharpness of the bright spot in the Doppler tomograms, especially in the Heii 4686 line, allows us to
determine the orbital period quite accurately. The coverage per night during our 2005 run (about 4.5 hours) is sufficient that we can distinguish between the true orbital period and its 1 day−1
aliases in the periodogram, since these aliases already lead to noticeable smearing of the bright spot signal when phase-folding the spectra from a single night.
[image:4.612.41.284.477.713.2]4
G. H. A. Roelofs et al.
Figure 3.Trailed spectra (top row), average-subtracted trailed spectra (middle row) and maximum-entropy Doppler tomograms (bottom row) of the strongest Heiand Heiifeatures.
Figure 4.Detailed comparison of Doppler tomograms between SDSS J1240 (top row) and ‘SN 2003aw’ (bottom row). The to-mograms of ‘SN 2003aw’ are aligned with those of SDSS J1240 artificially, since we do not have a zero-phase measurement for ‘SN 2003aw’. A linear back-projection code that can cope with the Siiiline being at the edge of our spectral window is used for ‘SN 2003aw’.
frame, we can further refine the orbital period by lining up the phases of the bright spot in the tomograms of March 1 and March 2, 2005. The bright spot phases are determined by fitting a 2-D Gaussian in the Doppler tomograms. We es-timate the uncertainty in the fitted bright spot phases with a simple Monte Carlo simulation, where we make a large ensemble of Doppler tomograms from our dataset using the bootstrap method. For each March 1 Doppler tomogram we thus randomly pick 70 spectra out of the set of 70 spectra that we have for this night, allowing for a spectrum to be picked more than once. We fit a 2-D Gaussian to each to-mogram in the ensemble; the resulting distribution of fitted bright spot locations inKX, KY space gives an estimate of
the accuracy allowed by the data.
[image:5.612.42.285.419.680.2]The one-year baseline between our 2004 and 2005 runs does not allow us to trace the orbit all the way in between, since one revolution fewer or more between these runs would correspond to a phase drift of just about one degree between the two consecutive nights of our 2005 run, which is below the accuracy with which we can measure the bright spot’s phases in the 2005 data.
4 DISCUSSION
4.1 Chemical composition of the accretion disc
Marsh et al. (1991) first modelled the accretion disc spec-trum of the 46-minute orbital period AM CVn star GP Com and found a strong underabundance of heavy met-als relative to the Sun. In particular, expected emission lines of singly ionised iron, silicon and calcium were missing from the spectrum. The recently discovered AM CVn star SDSS J1240 showed clear Feii5169, Siii6347 and Siii6371
emission, compatible with solar abundances (Roelofs et al. 2005). Calcium H & K were also expected if solar abun-dances of heavy metals were assumed, but could not be found in the spectrum. They do show up strongly in the spectrum of ‘SN 2003aw’ presented here. The spectrum of ‘SN 2003aw’ furthermore shows possible weak iron features near 5276 and 5317 ˚A not seen in SDSS J1240 (cf. figure 1). The possible Na D emission feature in both SDSS J1240 and ‘SN 2003aw’, mentioned in section 3.1, must originate in rel-atively cool parts of the accretion disc — a large part of the disc where most of the emission lines originate is expected to be at≈11,000 K (see Marsh et al. 1991 for a discussion), where the sodium should be largely ionised and the Na D lines would not show up. The feature does not show any bright spot (nor the typical double-peaked profile) in the trailed spectra, which fits with being Na D or a similar low-temperature feature.
We now have two emission-line systems that seem to be strongly underabundant in heavy metals (GP Com,Porb=
46 min and V396 Hya (=CE 315),Porb= 65 min), which
to-gether with their high proper motions suggests a halo origin, and two systems showing more or less the expected metal lines if solar abundances of heavy metals are assumed (SDSS J1240,Porb= 37 min and ‘SN 2003aw’,Porb= 34 min). The
stronger silicon and iron lines in ‘SN 2003aw’ relative to he-lium (by about a factor of 2, see table 2) can probably be accommodated by a higher column density of gas in the disc – e.g. due to a higher mass transfer rate – and saturated he-lium lines. The complete absence of calcium H & K in SDSS J1240 is more difficult to explain, but together with the no-tion that the Siii6347 & 6371 lines in SDSS J1240
origi-nate exclusively from the bright spots, this suggests some-what higher abundances of heavy metals in ‘SN 2003aw’ (if we assume both discs to be largely at ≈11,000 K). A more detailed study of these optically thin helium-dominated ac-cretion discs is beyond the scope of this paper, but will be interesting for estimating the mass transfer rates and for putting more accurate constraints on the chemical abun-dances in the discs.
4.2 The second bright spot
The remarkable double bright spot feature in SDSS J1240 (see Roelofs et al. (2005) for a discussion on its possible origins) was one of the motivations for obtaining the ob-servations presented here. Since the average spectrum of ‘SN 2003aw’ looked so similar, and since the suggested or-bital period from the photometric superhump was quite close to that of SDSS J1240, it was interesting to see if the accre-tion disc would show the same behaviour.
From the trailed spectra and Doppler tomograms (fig-ure 3) it is clear that the Hei 5015 line does indeed show
a second S-wave much like in SDSS J1240, but it is sig-nificantly weaker at about 30% of the integrated flux of the main S-wave. A direct comparison of the Hei5876 and of the Siii6347 line, for which there are phase-resolved spectra of
both objects, shows the weakness of the second bright spot in these lines compared to SDSS J1240 (figure 4). So more than anything else, ‘SN 2003aw’ adds to the diversity of the second bright spot feature. A very recently discovered new AM CVn star, 2QZ J142701.6−012310 (Woudt & Warner 2005) with a suggested orbital period near 36 minutes (again based on a photometric superhump period), even closer to the orbital period of SDSS J1240, may be a nice test case for this still enigmatic feature.
4.3 The orbital period
We measure an orbital period Porb = 2027.8±0.5
sec-onds. This proves that the photometric period of 2041.5± 0.5 seconds first detected by Woudt & Warner (2003) is a superhump period. Therefore the helium dwarf nova ‘SN 2003aw’, like the permanent superhumper AM CVn (Nelemans, Steeghs & Groot 2001), exhibits positive super-humps, which are usually explained as the beat period of the orbit and the prograde precession of a tidally deformed eccentric accretion disc. If we employ the latest empirical relation between the mass ratio q and the superhump pe-riod excess ǫ, as determined from superhump and orbital periods of a large number of hydrogen-rich dwarf novae by Patterson et al. (2005):
ǫ(q) = 0.18q+ 0.29q2 (1)
where
ǫ≡Psh−Porb Porb
(2)
we findq= 0.036±0.003. This compares toq= 0.039±0.010 determined kinematically for SDSS J1240 (Roelofs et al. 2005). It should be stressed that the relation (1) may not be well-calibrated for these extreme mass ratios, and in reality ǫmight depend on more parameters than justq. The quoted error on the mass ratio may therefore be a bit optimistic.
5 ACKNOWLEDGMENTS
6
G. H. A. Roelofs et al.
Town for kindly observing ‘SN 2003aw’ for us in preparation of our observing run. This work is based on data taken at the European Southern Observatory, Chile, under programmes 074.D-0662(A) and 072.D-0052(A).
References
Anderson S. F. et al., 2005, AJ, submitted (astro-ph/0506730)
Chornock R., Filippenko A. V., 2003, IAUC, 8084 Marsh T. R., Horne K., 1988, MNRAS, 235, 269 Marsh T. R., Horne K., Rosen S., 1991, ApJ, 366, 535 Nather R. E., Robinson E. L., Stover R. J., 1981, ApJ, 224,
269
Nelemans G., 2005, ASPC, 330, 27 (astro-ph/0409676) Nelemans G., Steeghs D., Groot P. J., 2001, MNRAS, 326,
621
Nogami D., Monard B., Retter A., Liu A., Uemura M., Ishioka R., Imada A., Kato T., 2004, PASJ, 56L, 39 Patterson J. et al., 2005, PASP, in press (astro-ph/0507371) Roelofs G. H. A., Groot P. J., Marsh T. R., Steeghs D.,
Barros S. C. C, Nelemans G., 2005, MNRAS, 361, 487 Wood-Vasey W. M., Aldering G., Nugent P., Li K., 2003,
IAUC, 8077