Headline: A CONFIRMATORY STUDY ABOUT GENDER DIFFERENCES 1
UNIVERSITY OF TWENTE
A Confirmatory Study about the Gender Differences in
Psychological and Physiological Processes
Author Elena Lederer
Bachelor Thesis
Positive Psychology and Technology Faculty of Behavioral sciences
Supervision Dr. M. L. Noordzij
Y. Derks, MSc
A CONFIRMATORY STUDY ABOUT GENDER DIFFERENCES 2
Abstract
Background and Purpose: Currently there is a lack of studies based in real life settings, regarding gender differences in psychological and physiological processes. The novelty of the current study lies in its continuous measurements, of seven days in a row, of physiological as well as psychological response in real life settings. The aim of this study is to shed light on whether there are statistically significant differences in those processes of men and women. Methods: 38 participants were examined in an observational study. The wearable device E4 was used to measure the physiological process Electrodermal Activity (EDA). Psychological processes were measured with the application mQuest by which a survey about self-reported stress (SR-Stress) was conducted. For the analyses, the Mann-Whitney U test as well as the independent sample t-test were chosen.
Results: The current study found no statistically significant effect of gender on EDA or Stress.
A CONFIRMATORY STUDY ABOUT GENDER DIFFERENCES 3
Table of Contents
Abstract ... 2
1. Introduction ... 4
1.1. Physiological Processes... 4
1.1.1. Skin conductance level ... 5
1.1.2. Skin conductance response. ... 5
1.1.3. Amplitude. ... 5
1.2. Psychological process ... 6
1.3.The current study ... 6
2. Method ... 8
2.1. Participants ... 8
2.2. Materials and Measures ... 9
2.3. Procedure and Design... 10
2.4. Analysis ... 10
3. Results ... 10
4. Discussion ... 14
4.1. Conclusion ... 18
References ... 19
Appendix ... 21
Appendix A ... 21
A CONFIRMATORY STUDY ABOUT GENDER DIFFERENCES 4
1. Introduction
‘Men are from Mars, Women are from Venus’ (Grey, 1999) is one of the many books on the literature market stressing the difference between men and women. The author of the book goes to such an extent that he claims gender-specific characteristics must stem from two different planets of origin. Since the late 19th century however, there is an ongoing trend towards gender equality and less focus on the differences between the two sexes (Hausmann, 2009). Despite this movement, currently there is a lack of real life setting research regarding physiological and psychological gender differences, which results in uncertainty to what extend men and women differ in those process.
In order to shed light on the question of gender differences the current study aims to examine whether there are statistically significant differences in the physiological processes and psychological processes of men and women.
1.1. Physiological Processes
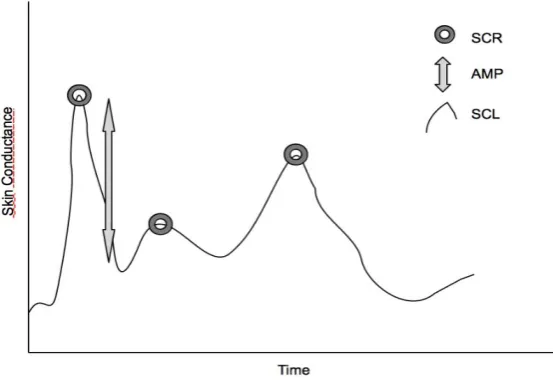
As an indicator for physiological processes, the Electrodermal Activity (EDA) can be monitored which refers to all electrical phenomena in skin. EDA is part of the autonomic nervous system which regulates physiological functions e.g. heart rate, blood pressure and ectodermal activity. When stimuli evoke arousal or the need for thermoregulation, this can for instance be regulated by the activity of the sweat glands which produce sweat e.g. EDA (Boucsein, 2012; Buijs, & Swaab, 2013). In the current study three variables of EDA are measured, namely skin conductance level (SCL), skin conductance response (SCR) and amplitude (AMP), to give answer weather to accept or reject the stated hypotheses (see Figure 1).1
1Due to a lack of research specifically regarding gender differences in EDA, the following references on EDA
A CONFIRMATORY STUDY ABOUT GENDER DIFFERENCES 5
Figure 1. Example for Electrodermal Activity
1.1.1. Skin conductance level. SCL refers to the overall skin conductance level which changes more slowly over time in comparison with other variables like skin conductance response (Christie, 1981). In general the activity of the sweat gland is
proportional to the skin conductance value, the higher the activity of the sweat glands, the higher the value or level of skin conductance (Garbarino, Lai, Bender, Picard, & Tognetti, 2005). Earlier research regarding gender differences and SCL found that males show a significantly higher SCL (Morimoto, 1978; Edelberg, 1971; Hare, Wood, Britain, & Frazelle, 1971). In general, this means that men have a greater bodily response to arousal than females concerning skin conductance.
1.1.2. Skin conductance response. SCR indicates that the skin shortly becomes a better conductor of electricity when aroused, represented by the peaks of EDA
A CONFIRMATORY STUDY ABOUT GENDER DIFFERENCES 6
1.1.3. Amplitude. Amplitude refers to the difference between a peak and a trough, the greater the difference, the greater the amplitude. Fowles (1986) stated that he observed a higher amplitude in females, which means that women tend to shift more extremely from peaks to troughs than men.
Taking these findings together, it can be said that previous research on gender
differences on SCL and SCR showed a notion towards men scoring higher on both measures. Additionally men seem to have a general lower amplitude, which means that males in general show a greater arousal to presented stimuli but have less difference between the peaks and troughs than females.
1.2. Psychological Process
Arousal does not only lead to physiological but also to psychological reactions. If arousal is perceived in a specific situation, demands or challenges that accompany the situation might exceed personal capacities; if so, the individual perceives i.e. experiences stress (Cohen, Kamarck, & Mermelstein, 1983). A measurement of a psychological process is therefore ‘perceived stress’ which can be measured through self-report (SR-Stress).
A CONFIRMATORY STUDY ABOUT GENDER DIFFERENCES 7
than their male counterparts. However, the results of this study were obtained by a
questionnaire the participant filled out in the presence of the researcher, which might have altered findings. Further, the mentioned studies were conducted with the purpose of
examining gender difference of psychological stress, with most studies not measuring stress continuously.
Regarding self-reported stress, it therefore can be said that women in general are more likely than men to express stress to others.
1.3. The Current Study
The current study is, to the researcher’s knowledge, rather innovative introducing continuous EDA and stress measurement for seven days in a row in a real life environment. This gives the unique possibility to study participants’ physiological and psychological processes throughout their day. By measuring during the day for seven days, the great amount of data results in a more reliable analysis, since measurement errors get less significant. Furthermore, conducting the study under real life circumstances gives the advantage of obtaining results that have a high external validity. There is a lack of recent studies focusing on gender-specific differences in EDA which is why it is particularly interesting to stress this topic further. Despite the innovative set up of the study, the hypotheses are based on the previously introduced findings, since there is no reason to assume different outcomes.
A CONFIRMATORY STUDY ABOUT GENDER DIFFERENCES 8
Regarding stress, research states that women in general are more comfortable reporting emotions and therefore it can be assumed that stress will be more reported by females (Anderson, & Manuel, 1994). In accordance with this, most findings showed a tendency towards females experiencing, or at least reporting, more stress than males (Kaiseler, Polman, & Nicholls, 2012; Ye, Liu, & Posada, 2018; Li, Wu, & Johnson, 2018) This led to the hypothesis that women will report more stress than men.
2. Method 2.1. Participants
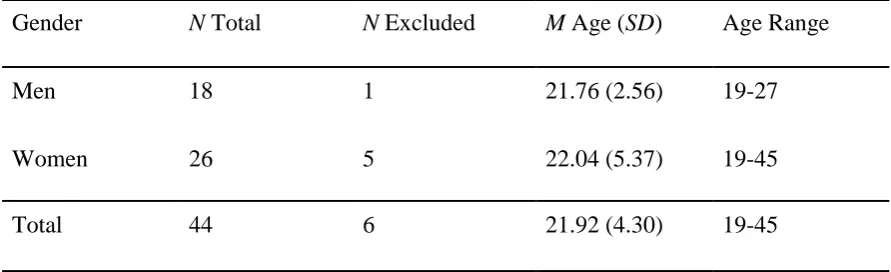
In the current study, the data of 44 participants was obtained through convenience sampling which was applied at two different moments of measurement. In 2017 the data of 21
A CONFIRMATORY STUDY ABOUT GENDER DIFFERENCES 9
Table 1.
Group Statistics per Gender (Mean (M) age and Standard Deviation (SD); Age Range).
Gender N Total N Excluded M Age (SD) Age Range
Men 18 1 21.76 (2.56) 19-27
Women 26 5 22.04 (5.37) 19-45
Total 44 6 21.92 (4.30) 19-45
Note. Information on mean age, standard deviation and age range, after exclusion of participants
2.2. Materials and Measures
The wearable device used in this study was the E4, measuring Blood Volume Pulse (BVP), Electrodermal Activity (EDA) and Skin Temperature (ST) (Garbarino, Lai, Bender, Picard, & Tognetti, 2005). For the current study, EDA was used as the physiological variable. EDA is measured by the E4 with a high range of values (0,100)µS with a resolution of 900
picosiemens and a default sampling rate of 4Hz.
At the beginning of each data collection cycle, every participant received the E4, a charging cable and a Micro USB to USB cable for uploading the data and charging the device on a computer. The survey to measure the SR-Stress (see Appendix A) was filled in on the mobile phone of the participant. Therefore, the application mQuest was installed on the participants personal phone. The survey of the first run in 2017 contained four questions, two of which were about stress and the other two were about arousal. The survey was filled in every two hours on a Likert scale ranging from 0 to 10 regarding their emotions within the last two hours. The current survey contained two more questions, adding questions about valence, e.g. how pleasant they would rate their experience. Furthermore, the Toronto
A CONFIRMATORY STUDY ABOUT GENDER DIFFERENCES 10
need the outcomes of the TAS-20 to answer the hypotheses. 2.3. Procedure and Design
The study was an observational study. The data collection took seven days per participant, whereby the physiological data was gathered through a wearable, measuring continuously physiological signals. For the psychological data, a fixed-time-based sampling method was used. During the first briefing, all participants had to read and sign an informed consent. Furthermore, participants had to fill in the TAS-20 and received the E4 with its gadgets as well as further instructions on uploading the data and using the mQuest application. Participants had to wear the device and answer the survey only while they were awake and had the opportunity to do so. The participants were asked to upload the data every night to their computer.
After seven days of data collection, the participants met with the researchers and returned the E4 with its gadgets. Finally, the participants filled in the TAS-20 and were invited to participate on a semi structured post-interview about the experiment and its burdens for further development of the study.
2.4. Analysis
Similar to Brouwer et al. (2018) Continuous Decomposition Analysis is used to calculate the mean tonic SCL and the number and mean peak amplitude of the skin conductance response
A CONFIRMATORY STUDY ABOUT GENDER DIFFERENCES 11
are neglected. In order to gain insight into the current data additional boxplots were created, thereby patterns and differences in the distribution of the data were made visible.
3. Results
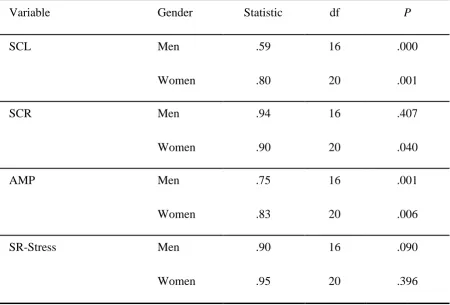
[image:11.595.73.524.413.718.2]Testing the normal distribution of the scores of SCL, SCR, AMP and SR-Stress per gender revealed that only scores of SR-Stress were normally distributed for both genders. In the case of SCL, SCR and AMP, either scores for both genders, or only one, were not normally distributed (Table 2).
Table 2.
Results of the Shapiro-Wilk test on the normal distribution per gender of the
Variables SCL, SCR, AMP and SR-Stress
Variable Gender Statistic df P
SCL Men .59 16 .000
Women .80 20 .001
SCR Men .94 16 .407
Women .90 20 .040
AMP Men .75 16 .001
Women .83 20 .006
SR-Stress Men .90 16 .090
Women .95 20 .396
A CONFIRMATORY STUDY ABOUT GENDER DIFFERENCES 12
[image:12.595.114.482.210.409.2] [image:12.595.113.483.494.699.2]Boxplots for men and women demonstrating their SCL, SCR and AMP scores (Figure 2 - 4) showed that in the case of AMP men’s scores were more spread compared to women’s, while in SCL scores no gender difference was apparent, and in the case of SCR women’s scores seemed to be more spread out than men’s.
Figure 2. Boxplots showing SCL Mean scores for men and women
A CONFIRMATORY STUDY ABOUT GENDER DIFFERENCES 13
Figure 4. Boxplots showing AMP Mean scores for men and women
Subsequently the Mann-Whitney U Test indicated that men and women did not significantly differ on the SCL, SCR or AMP (Table 3).
Table 3.
Results of the Mann-Whitney U Test for SCL, SCR and AMP
EDA Variable
Mdn U z p R
Men Women
SCL .31 .40 152 -.26 .814 -.04
SCR 1074.18 1031.65 159 -.03 .987 -.01
AMP .06 .05 159 -.03 .987 -.01
[image:13.595.77.524.485.665.2]A CONFIRMATORY STUDY ABOUT GENDER DIFFERENCES 14
[image:14.595.113.484.212.411.2]Visualizing the SR-Stress mean scores of men and women by the mean of boxplots (Figure 5) indicated that men and women scored quite similar, although the median of women is lower than the median of men’s scores, the mean score is expected to be quite similar since both boxes do not seem to differ greatly.
Figure 5. Boxplots showing SR-Stress Mean scores for men and women
An independent samples t-test was conducted to compare the means of SR-Stress in men and women. There was not a significant difference in the scores of men (M = 4.23, SD = 1.90) and women (M = 4.03, SD = 1.69); t(36) = .36, p = .730.
4. Discussion
The aim of the current study was to examine whether there are statistically significant differences in the physiological and psychological processes of men and women. It was hypothesized that men will have a greater SCL as well as SCR level while women should reflect a greater AMP and SR-Stress level. Looking at the results, all hypotheses had to be rejected since no statistical significant effect of gender was found on the examined variables.
A CONFIRMATORY STUDY ABOUT GENDER DIFFERENCES 15
For SCL, the overall level of skin conductance response, no gender differences can be
observed (Figure 2.); while for AMP and SCR the contrary has to be stated. In Figure 4 it can be seen, that the distribution in AMP for men is greater, which means there is more variance in the obtained data in relation to women. For SCR, women show a (slightly) greater
distribution in relation to men, which is shown in Figure 3. Those differences in distribution are caused by individual differences i.e. outliers rather than group differences. For SR-Stress there is not much difference in distribution but in Figure 5 it is noticeable that most
participants rated their stress levels rather low e.g. in the first half of the scale.
Looking back on the findings of previous research, the current findings were rather contrary to the researcher’s expectations since the mentioned studies (Morimoto, 1978; Edelberg, 1971; Hare, Wood, Britain, & Frazelle, 1971; Fowles, 1986) did find significant effects of gender on all variables of interest for this study. The current study however, was done in a real life setting, gathering data continuously over seven days. This approach is rather new and innovative in comparison to the mentioned studies and could thereby have contributed to the dissimilar results. All previously mentioned studies regarding EDA were conducted before 1990 and measurement instruments got further developed over the years. Although the instruments measuring EDA were as precise as our devices of today, the execution of measurements were different. Similar to the other studies, Hare, Wood, Britain, and Frazelle (1971) for instance used Beckman cream to facilitate the measurement of EDA, since it contains NaCl ions which also appear as salt in sweat and therefore is expected to disturb the electrodermal measurement just to a small extent (Boucsein, 2012). The
A CONFIRMATORY STUDY ABOUT GENDER DIFFERENCES 16
circumstance of sitting in a laboratory, attached to a big device, could have influenced the stress and EDA levels of the participants. This could explain the previously found higher outcomes of the measured variables. The wearable devices on the other hand can be easily disregarded in everyday life. Laboratory studies measure under perfect conditions e.g. adding specific stimuli to evoke reactions. However, the external validity of laboratory studies has to be questioned in some degree, since the conditions found in a laboratory are rarely similarly present in the real world. This is also reflected in the different outcomes comparing previous research with the current study. It might be that gender differences can be observed under laboratory conditions, but those differences cannot be observed under real life conditions. In addition to the real life setting, the data was gathered continuously seven days in a row which results in more data per person than by measuring just over several minutes or even hours. The more data available the less important the individual differences, and small measurement errors can be evened out. The large amount of data also compensates the fact that the current study, in general, had a rather small sample size of about 20 participants per gender.
A CONFIRMATORY STUDY ABOUT GENDER DIFFERENCES 17
statement is that it is not socially desirable for men to admit emotions linked with weaknesses in public. By using a survey, conducted on the personal phone, anonymity is increased and thereby this problem might have been bypassed.
In additional analysis another interesting outcome can be observed. Participants in 2017 in general reported less stress than participants in 2018.2 While conducting the survey, participants had to rate their own stress levels on a scale from 0 to 10. To some participants it was not clear if ‘5’ referred to the point of reference, with ‘6’ meaning ‘lightly stressed’, or if ‘0’ was supposed to be the reference point, meaning that ‘1’ would be ‘lightly stressed’. This could have several reasons, one of them being, that in 2018 a new question about valence, how pleasant their experiences were, was added to the survey. This question was the first whereby not pleasant experiences, were rated from ‘0’ to ‘4’ and pleasant experiences, were rated from ‘6’ to ‘10’, which made ‘5’ a clear point of median reference. This could have led the participants to assume, that all questions have to be rated that way leading to a higher reported stress level in general.
Since there is a great body of research stating that there are differences in gender which could not be confirmed in the current study, this gives reason to stress this topic again in future research.
Before repeating the study a third time, it is advised to determine precisely how the scale of the questionnaire should be interpreted to avoid individual differences in answering the questions. Furthermore, a possibility to report activities could be useful to link the results of physiological or psychological data to real life activities. This could give greater insight into the underlying causes of physiological or psychological response. Additionally,
2 significant difference was found between gathered SR-Stress mean scores of 2017 and 2018 with scores of
A CONFIRMATORY STUDY ABOUT GENDER DIFFERENCES 18
introducing follow up measurements after a specific point in time could give more balanced results by compensating for temporary life stressors e.g. exam week vs. vacation time.
Furthermore the topic of gender differences in reporting emotions could be stressed by conducting interviews about their stress levels with one group, while conducting a survey on the phone with another group. Since interviews cannot be conducted seven days in a row, every two hours, this would be a separate study with the main aim being, getting insight in gender differences in emotion reporting.
4.1. Conclusion
A CONFIRMATORY STUDY ABOUT GENDER DIFFERENCES 19
References
Anderson, K. M., & Manuel, G. (1994). Gender differences in reported stress response to the Loma Prieta earthquake. Sex Roles, 30(9-10), 725-733.
Boucsein, W. (2012). Electrodermal activity. Springer Science & Business Media.
Buijs, R., & Swaab, D. (2013). Autonomic nervous system (Handbook of clinical neurology, volume 117). Place of publication not identified: Elsevier.
Cohen, S., Kamarck, T., & Mermelstein, R. (1983). A global measure of perceived stress.
Journal of health and social behavior, 385-396.
Christie, M. J. (1981). Electrodermal activity in the 1980s: a review. Journal of the Royal Society of Medicine, 74(8), 616-622.
Edelberg, R. (1971). Electrical properties of the skin. A treatise of the skin. HR. Elden
Fowles, D. C. (1986). The eccrine system and electrodermal activity. In M. G. H. Coles, E.
Donchin, & S. W. Porges (Eds.), Psychophysiology: Systems, processes, and
applications (pp. 51–96). Amsterdam: Elsevier.
Garbarino, M., Lai, M., Bender, D., Picard, R.W., & Tognetti, S. (2015). Empatica E3 - A
wearable wireless multi-sensor device for real-time computerized biofeedback and
data aquisition. Proceedingsof the 2014 4th International Conference on Wireless
Mobile Communication and Healthcare (Mobiheath), 39-42.
https://doi.org/10.1109/MOBIHEALTH.2014.7015904
Gray, J. (1999). Men are from Mars, women are from Venus: Book of days. London: Vermilion.
Hare, R., Wood, K., Britain, S., & Frazelle, J. (1971). Autonomic responses to affective visual stimulation: Sex differences. Journal of Experimental Research in Personality. Hausmann, R. (2009). The global gender gap report 2009. World Economic Forum.
A CONFIRMATORY STUDY ABOUT GENDER DIFFERENCES 20
Coping: An examination of the situational and dispositional hypothesis. International
Journal of Sport Psychology, 43(1), 1-14.
Li, C., Wu, K., & Johnson, D. E. (2018). The impact of balance‐focused attitudes on job stress: Gender differences evidenced in American and Chinese samples. International
Journal of Psychology, 53(1), 31-39.
Morimoto, T. (1978). Variations of sweating activity due to sex, age and race. The physiology
and pathophysiology of the skin, 5, 1655-1666.
A CONFIRMATORY STUDY ABOUT GENDER DIFFERENCES 21
Appendix
Appendix A: mQuest Survey
All questions were to be rated on a scale from 0 to 10.
A CONFIRMATORY STUDY ABOUT GENDER DIFFERENCES 22
[image:22.595.76.527.174.279.2]Appendix B: Additional Analysis Stress-level 2017/2018
Table 4.
Results of the Shapiro-Wilk test on the normal distribution per round of the SR-Stress.
SR-Stress Round Statistic df p
1 .95 18 .440
2 .96 20 .577
[image:22.595.80.522.431.536.2]Note. p < 0.05. SR-Stress Round indicating the moment of data gathering, (1= 2017, 2=2018).
Table 5.
Number of Participants (N), Mean (M) and Standard Deviation (SD) of their SR-Stress
scores in round one and two.
SR-Stress Round N M (SD)
1 18 2.51 (0.90)
2 20 5.57 (0.81)
Table 6.
Results of the Independent-Samples t-test on the effect of gender on SR-Stress.
t df p
SR-Stress -11.05 36 .000
[image:22.595.74.526.634.701.2]