Telling friend from foe: Does it show when
someone has hostile intentions?
Bachelor Thesis
Maximilian Schenk
Student number: s1697358
First supervisor: Dr.Ir. Peter W. de Vries
Second supervisor: Dr. Jan M. Gutteling
University of Twente
1
Abstract Background
Detecting deception motivated by hostile intentions is crucial to crime prevention. If it can be done through observing the nonverbal behaviour of deceivers remains controversial. Several mental processes accompany deception, but the associated behaviours are faint and
inconsistent. Even more, they are not in line with the stereotypical beliefs of laypeople and experts alike. A previous study found that environmental cues (noise) and cognitive load (counting one’s steps) potentially increase the detection accuracy of individuals with hostile intentions. The current study aims to replicate these findings while also examining differences in behaviour between hostile and non-hostile individuals and differences in the use of
indicators of deception between laypeople and experts.
Methods
Video material from the previous study was shown to a group of police officers (n = 12) and a group of students (n = 15). In addition, participants filled out questionnaires recording their use of indicators of deception before and after the videos. The results were analysed with a 2 (Environmental cues vs. no cues) x 2 (Cognitive load vs. no load) repeated measures ANOVA and a coding scheme.
Results
There were no significant effects of cues or cognitive load on the detection accuracy of participants. There were minor differences in behaviours between individuals with hostile and non-hostile intent and minor differences in the use of indicators between police officers and students. However, the indicators of both groups were faulty and contradictory and
participants who used more correct indicators did not have a significantly higher detection accuracy.
Discussion
2
Table of Content
1. Introduction ... 3
1.1 Theoretical framework ... 4
1.2 The current study ... 8
2. Method ... 8
2.1 Design ... 8
2.2 Participants ... 9
2.3 Materials ... 10
2.4 Procedure ... 10
2.5 Analysis ... 11
3. Results ... 12
3.1 Replication ... 12
3.2 Codes ... 14
3.2.1 Indicators of deception ... 14
3.2.2 Beliefs about indicators of deception ... 15
3.3 Additional analyses... 16
4. Conclusion and Discussion ... 16
4.1 General Discussion ... 16
4.3 Suggestions for future research ... 19
References ... 21
3
1. Introduction
In the history of psychological research, detection of deception has been a productive and much debated field. Deception can be defined as “a successful or unsuccessful deliberate attempt, without forewarning, to create in another a belief which the communicator considers to be untrue” (Vrij, 2000, p.6,). Deception occurs on a broad spectrum of various intentions and contexts. People deceive with a self-oriented intention: To make a good impression on others, obtain an advantage or avoid punishment. They also deceive for the benefit of others or of their social relationships. The severity of deception varies from overstated compliments to one’s spouse to concealing one’s involvement in a murder or other criminal acts. Benign deceit is a common part of everyday life and will be encountered by everyone at any time: Estimates suggest that the average person lies almost two times a day (DePaulo & Kashy, 1998).
Even though we so often come across deception, we seem to be bad at recognizing it: The average accuracy of human deception judgments lies with 54% only slightly above chance level (Bond & DePaulo, 2006). On average, people recognise honesty in 61% of the cases and deception in 47% of the cases and the more honest statements they hear, the better their truth-deception-discrimination becomes. This reveals their ‘truth bias’: An overly optimistic belief that most things they are being told are true (Levine, 2010).
Deception is problematic if motivated by a hostile intent, which is the deliberate intention to harm others. In such situations we naturally have a high interest in uncovering someone’s deception. Freud stated that “He who has eyes to see and ears to hear may convince himself that no mortal can keep a secret. If his lips are silent, he chatters with his finger-tips; Betrayal oozes out of him at every pore” (Freud, 1959, p.94). In reality, however, detection of deceit is a complicated business. It can potentially be detected via three channels: First by evaluating the deceiver’s verbal behaviour, for example by checking her account for inconsistencies and comparing it with the facts oneself has available. Second by evaluating physiological reactions, for example increases in blood pressure or sweat caused by stress, as measured with the famous and controversial polygraph (Hindman & Peters, 2000). And third, by investigating her non-verbal behaviour and trying to find behavioural indicators that are reminiscent of deception.
Analyses of non-verbal behaviour are not as reliable as verbal or physiological observations. Therefore, this is the only of the three kinds of observations that is not being used as evidence in court cases (Vrij, 2000). Individuals are generally better at identifying deception in verbal accounts than in bodily expressions (Kassin, Meissner, & Norwick, 2005). However, behavioural indicators are in most situations immediately and easily observable and might be crucial when the other two methods fail.
The relationship between deception and non-verbal behaviour is not easily
operationalized, because different types of people show different behaviours when they are deceiving. The liar’s behaviour, for example, substantially depends on the situation in which the lie takes place. Laypersons who attempt to intuitively detect deception appear to be often guided by heuristics and content-related cues that have been neglected in psychological research (Fiedler & Walka, 1993). These stereotypical beliefs and naïve theories include that liars avoid eye contact, show more self-manipulating behaviours, more hand and leg
4
service agents) who ignore these stereotypes and make use of a pragmatic approach, meaning that they use different cues when observing different people, reach higher detection accuracy rates (Ekman & O’Sullivan, 1991). Laypersons whose false beliefs get corrected by learning about accurate deception indicators before an interview also reach higher rates (Reinhard, Scharmach, & Müller, 2013). Detection of deceit therefore seems to be, at least to some extent, trainable (Koller, Wetter, & Hofer, 2015).
This trainability-insight is increasingly used by governments and security enterprises for crime prevention. There are increasing efforts of operationalizing behavioural observation techniques for detecting individuals who have hostile intentions, especially during the present time of growing threat by international terrorism. One example of this is the Behaviour Detection and Analysis Program with its ‘Screening Passengers by Observation Technique’ (SPOT), employing more than 3000 trained security officers on 161 airports in the US (Weinberger, 2010). These officers’ job is to look for people near specially designed stress points whose behaviour deviates from the baseline of what is considered normal. For this, they use a set of standardized behavioural indicators and thresholds (Homeland Security, 2015).
According to Weinberger (2010), the effectivity of such an approach is controversial: In the first three years of its implementation the program led to 232,000 inspections based on suspicious behaviour and not a single person was afterwards arrested for the reason of posing a threat to security. Flying is certainly stressful for most people and their anxiety or
nervousness can have a broad variety of causes unrelated to hostile intentions. Scientific research has a vital role in providing the theoretical basis for upcoming techniques that could be more effective. These should include behavioural indicators of deception that are only found in individuals with hostile intentions and that are objective and reliable.
This study will examine which factors make detection in a simulated smuggling setting more likely and whether there are differences in beliefs about indicators of deception between expert- and layperson-judges. Experts will be represented by police officers and laypersons by university students. In addition, we are going to explore the specific
behavioural indicators that hostile individuals portray. Through that, we want to see if there are any objective, universal behavioural indicators that deceiving individuals display in such a situation. We also want to explore if police officers pay attention to more reliable behavioural indicators. This leads us to the following research question: Which behavioural indicators make deceiving individuals stand out and in how far does police officers’ and students’ use of indicators of deception differ?
1.1 Theoretical framework
Supposedly, there are many behavioural indicators that can make a deceiving individual stand out. However, deception is, to a certain degree, a normal process of our everyday lives and consequently most deceptive actions are routinely executed. Therefore, they leave only faint behavioural evidence (Fiedler & Walka, 1993). Researchers who want to find this first have to make an effort to link deception to other mental processes that
5
These mental processes can be classified into three categories: Emotions, attempted behavioural control, and content complexity (Vrij, 2000). They are interrelated and often surface in concordance with each other. Emotions that a deceiving person experiences
typically involve guilt, fear, and excitement (Ekman, 1992). It is suggested that he feels either guilty or excited about lying and fearful about being caught. Resulting from that, deceivers are expected to behave more distancing and tense than truth tellers, since they experience less pleasant and positive emotions (DePaulo et al, 2003). Their emotions are likely to surface in so-called microfacial expressions, even if they try to hide them, because we are not able to consciously control all parts of our face all the time. A good example for this is the ‘fake smile’, which can be easily detected because the eye muscles are not in use. Frank and Ekman (1997) claim that it is possible to detect up to 80% of truths and lies when a trained observer pays attention to microfacial expressions. The experience of guilt while lying can lead to gaze aversion and the experience of fear or excitement to any signs of stress, for example nervous fidgeting (Vrij, 2000). Eye contact, however, is easy to control and nervous movements contradict with stiffness and rigidity, so both are no reliable measures of actual deception.
Attempted behavioural control means that deceivers are overly concerned with impression management. They have an increased self-focus and will try put more effort in behaving normally or making an honest impression than truth-tellers. In an extensive
literature review, DePaulo et al (2003) identified 158 behavioural indicators. With their ‘self-presentational perspective’, they stress that most people deceive to present themselves in a better light. Deceivers are carrying out multiple tasks simultaneously. They try to convey their message in an honest way while continually monitoring for suspiciousness and adapting their behaviour. This top-down self-regulation process, directed towards inhibiting undesired impulses and promoting the desired outcome of not displaying one’s deceit to others,
consumes mental resources and is exhausting (Muraven, Tice, & Baumeister, 1998). This can lead to self-regulation failure, the inability to suppress undesired responses, which in this case consists of conducting suspicious behaviour (Hofmann, Schmeichel, & Baddeley, 2012). They might also raise suspicion trough ironic mental processes, whereby people perform the precise error that they are trying to avoid (Wegner, 2009). Because their effort is directed elsewhere, they might abandon their suppression for a brief time or get unconsciously motivated to revisit the supressed thought (Wegner, 1994).
Content complexity relates to the assumption that deception requires more cognitive effort than non-deception. Deceivers must be careful to think of plausible answers which seem credible and do not contradict themselves. Because of that, they show less ordinary imperfections: Their effort to seem credible is exaggerated, while truth tellers simply take their credibility for granted (DePaulo, Lemay, & Epstein, 1991; Koller, Wetter, & Hofer, 2015). Complex content puts a cognitive load on them. If the deceit is cognitively
challenging, it can lead to hesitations and a neglect of body language or eye contact (Ekman, 1997). The deceiver can then also express an unusual degree of rigidity and inhibition (Vrij, 2000). If people have the feeling of being observed, for example with security cameras, they additionally experience an egocentric bias in estimates of the salience of their own actions (the ‘spotlight effect’) or an increased assessment of other’s ability to read their own
6
have the potential to further increase striking behavioural reactions, like for example insecurity resulting in stiffness.
It can be concluded that there is no universal set of nonverbal behaviour that makes a deceiving individual stand out (Vrij, 2000). Even though there are few behaviours that can betray a deceiver, they are faint and sometimes contradict each other. They also depend on the situation where the deception takes place and on the personality of the deceiver: Firstly, behavioural indicators differ depending on whether the deception takes place in a high- or low-stake situation. If the stakes are high in a way that lies are about major transgressions or there is a substantial risk of failure, the emotions of the deceivers will be more obvious
(DePaulo et al, 2003). There also exists a motivational impairment effect, meaning that a high motivation to succeed, especially if it is identity-relevant, is a moderator for a stronger
uttering of behavioural clues (DePaulo, Kirkendol, Tang, & O’Brien, 1988). While few people may show signs of nervousness while lying, most get stiffer and show less movement, but this is personality-dependent (Vrij, 2000). A pragmatic approach, as mentioned above, seems indispensable to make reliable deception judgments. Moreover, there will always be ‘good liars’, who do not find their deception cognitively difficult and have no negative emotions connected to it.
Table 1 shows the difference between stereotypical subjective beliefs about nonverbal behaviours that deceiving people show and their actual expressions. It is remarkable that only for microfacial expressions, these beliefs are right. While most other behaviours in reality do not show at all, illustrators and movements generally decrease instead of the increase that is suggested by most judges. According to this summary, the only valid judgment one can make on the basis of nonverbal behaviour comes from an increased rigidity and emotional facial expressions of the deceiver.
Non-verbal characteristics Common subjective belief Objective indicators
Gaze aversion > -
Smiling > -
Eye blinks > -
Illustrators > <
Self-manipulations > -
Hand and finger movement > <
Leg and foot movement > <
Head movement - -
Trunk movement > -
Position shifts Micro-expressions
> >
- > >: there is an increase of the behaviour with deception
<: there is a decrease of the behaviour with deception
-: there is no relationship between the behaviour and deception
[image:7.595.68.531.494.656.2]The described indicators, however ambiguous, still suggest that criminals’ hostile intentions result in displayed behaviour that might be used by observers for early recognition and crime prevention.One can now ask the question of how to further increase the odds that deceivers get caught. Cues that signal risk of exposure and an increased cognitive load both
7
have promising potential for disturbing the deceiver’s attempted behavioural control and leading to behaviour that makes them detectable (Wijn, Kleij, Kallen, Stekkinger, & De Vries, 2017). A recent study approved this assumption experimentally: Participants with hostile and no hostile intent had to walk a route and smuggle a bag past a checkpoint. Some were
additionally given a cognitive load in the form of remembering digits or counting their steps. On their way they were exposed to a cue or no cue which resembled a police radio static noise. Each person was filmed and the videos were then shown to independent observers. (Wijn et al., 2017).
Observers could better recognize persons with hostile intent if they were exposed to a cue. If there was a hostile intent, the persons would interpret the cue egoistically as being directed at them. The hostile intent assumingly lead to a cascade of interrelated psychological effects like contemplation of hostile role, anxiety, inhibitory control, activation control to behave normally, and more awareness of the surroundings (Wijn et al., 2017). The study concludes that such cues, resembling risk of exposure, can help with the detection of
wrongdoers in a real-life setting. One recommendation for future research is the examination of which actual behaviours of the wrongdoers made the observers recognize them.
The current study will be a partial replication of the study by Wijn et al., inspired by the ‘replication crisis in psychology’. In recent times, the field has been viewed as suffering from a such a crisis, because efforts to replicate findings from previous studies have been largely unsuccessful. Most prominent journals create or support ‘publication bias’ – the inclination to only publish positive results that can create catchy headlines, while ignoring negative ones. This makes replication an unattractive and unworthwhile field of inquiry for researchers. It is important, however, to do multiple replications in order to have high enough statistical power so that one can be certain of true effects (Maxwell, Lau & Howard, 2015). Joining forces on larger, cooperative studies with many more participants seems desirable. This can provide the opportunity to change researcher’s way of thinking and the way psychologists extract conclusions from their research - to a more open and less cast in stone way of reporting their findings (Spellman, 2015).
As described, people are usually poor at detecting deception when they only pay attention to behaviour, because most beliefs about non-verbal indicators of deception are inaccurate: either they do not happen at all or inversely (e.g., less body movement instead of more body movement). But also for experts, it is difficult to differentiate lies from truths (Bond & DePaulo, 2006). Most studies have found that professional lie catchers, mostly police officers or other law enforcers, do not perform better than laypeople and sometimes not even better than chance level (Vrij, 2000). This is counter-intuitive, since they are specially trained to do so. This issue seems to be different when the context that the police officers find themselves in is familiar: Then they achieve higher accuracy in deception detection in
addition to higher than usual detection rates (Mann, Vrij, & Bull, 2004).
8
some show the opposite (Hartwig, Granhag, Strömwall, & Vrij, 2004). If it is true, the officers must be able to better recognize and classify behavioural indicators of deception. Work
experience in policing seemed to be an important variable in this study. For other experts, for example security camera control room operators, work experience had no influence on their deception detection accuracy (Aamodt & Custer, 2006).
It can be argued that neutral observers who are disconnected from the actual social interaction that they must rate perform better, because they can fully concentrate on
behavioural indicators. It takes mental resources to interact with the potential deceiver and it can be considered rude to observe a person thoroughly from head to toes. Neutral observers do not have to adhere to such communication conduct (Vrij, 2000). Furthermore, hostile actions on security cameras are preceded by a build-up phase (Koller, Wetter, & Hofer, 2015). This leaves more time to recognize the deceiver as compared to having to do it ‘in the act’. Distinctive behaviours allowing these predictions were gaits and aggressive hand gestures. When asked how they recognized the thieves, the POs stated that they had perceived the scene as a whole and tried to detect clusters of behaviour that differentiated from the ‘baseline’ behaviour of the bystanders (Koller, Wetter, & Hofer, 2015).
1.2 The current study
Building on these findings, the current study aims to not only find universal behavioural indicators and differences in beliefs between experts and laypersons (‘Which behavioural indicators make deceiving individuals stand out and in how far does police officers’ and students’ use of indicators of deception differ?’), but also to replicate the
findings of Wijn et al (2017). This will include replicating the second part of their study: The pre-recorded material will be shown to two groups of neutral observers (police officers and university students) to determine if their deception detection accuracy is better if the deceivers were exposed to an environmental cue or a mental load. This leads to two hypotheses:
H1: Like in the original study, Environmental cues signalling risk of exposure lead to observers having a better ability to distinguish individuals with hostile intentions from individuals with non-hostile intentions.
H2: Chances of detection of individuals with hostile intentions will be even higher if these individuals’ cognition was constrained by a mental load.
2. Method
2.1 Design
A repeated-measures 2 (Environmental cues vs. no cues) x 2 (Cognitive load vs. no load) experimental design was employed. The results were analysed using a mixed-methods approach. For the quantitative part of this study, judges from both groups were shown video material of participants from an earlier design with experimentally induced hostile (vs. non-hostile) intentions, with high (vs. low) cognitive load, and who were exposed to an
9
For the qualitative part, judges were asked about which specific behavioural indicators made deceiving individuals stand out and these were then coded. In addition, the behaviours of individuals in the videos from the original study (Wijn et al., 2017) were coded by two independent observers. For more information about the coding process, see ‘Analysis’.
2.2 Participants
There were 27 participants, 12 police officers and 15 university students. The mean age of all participants was 30.6 (SD = 11.2), the mean age of the police officers was 40 (SD = 10.7), and the mean age of the students was 23 (SD = 2.6). There were 15 men and 12 women. All participants were recruited through convenience sampling: Police officers from a police station in Amsterdam were directly approached and asked if they would be willing to take part in the experiment. Students participated in exchange for Bachelor course credits.
Participants had to be at least 18 years old and speak the Dutch language fluently. To increase motivation, the student with the highest success rate won a 50€ shopping voucher. Table 2 and table 3 show the characteristics of participants from both groups.
Table 3. Characteristics of police officers (n=12)
Variable N %
Sex
-Male 8 66.7
-Female 4 33.3
Nationality
-Dutch 12 100
Function
-Senior Constable 7 58.3
-Community officer 2 16.7
-Sergeant 2 16.7
[image:10.595.71.424.336.437.2]-Operations coordinator 1 8.3 Table 2. characteristics of students (n=15)
Variable N %
Sex
-Male 7 46.7
-Female 8 53.3
Nationality
-Dutch 7 46.7
[image:10.595.71.524.466.613.2]10
2.3 Materials
The original videos from the previous study by Wijn et al (2017) were used. With the
software Matlab, they created a test that randomly showed the videos with a Yes/No button at the end of each video. Each video thus provided one observation. Images 1 and 2 show two screenshots of the test. It included 148 videos, each lasting around 25 seconds. Beforehand, some written instructions about the study were given and the participants saw five practice-videos that were not considered for further analysis.
In the original set-up, one group was told that there was a bomb in the bag which they had to smuggle past the security checkpoint, the other group was told that there were books in it. Some of them additionally received an environmental cue hinting at detection (in form of police radio noise) and/or had to count their steps while walking. To higher the stakes of the situation and increase their motivation, individuals in the ‘hostile intent’ condition were told that if they succeeded with the smuggling, they would receive a monetary price and if they failed, they would have to fill in boring questionnaires for two more hours. For the videos that contained no environmental cue, the same noise was added afterwards, so that participants would be unknowing to the conditions.
An additional questionnaire was shown via Qualtrics. The data was organized using Excel and the statistical analyses were performed using SPSS Statistics, version 24. In order to code behavioural indicators of deception and the participant’s belief about these, the coding software Atlas.ti was used.
2.4 Procedure
Participants were welcomed and seated behind a laptop. A brief explanation about the purpose of the study was given, after which participants signed the informed consent. Next, they answered several demographic questions and were asked to imagine a scenario at the airport, where they would be part of the security screening staff. Participants were asked to indicate which specific non-verbal behaviours they would use as indicators to rate people as
suspicious. After that, the original test from Wijn et al. (2017) started, where participants saw videos of people walking down a hallway with a laptop bag. The students were shown 148 videos with a short break in the middle and the police officers were shown 64 videos, eight
Image 1: Video of a person walking down the hallway
11
for each of the eight conditions. For each video a ‘yes’ or ‘no’-answer was recorded. After these videos, participants were asked about the non-verbal behaviours of the people just seen that indicated that they were ‘guilty’. After the final questionnaire they could ask and write down any additional questions and suggestions. At last, they were given a short debrief of the research. For the full questionnaire, see Appendix A.
2.5 Analysis
The data was analysed using mixed methods. To answer the two hypotheses, which resemble the quantitative part of the study, the raw data of each participant was exported from Matlab to Excel. Two files could not be exported due to a faulty results-file and one due to a faulty test run (one student, one police officer). For the remaining participants, the answers of 15 videos had to be deleted because the conditions of these videos were unknown. All files were merged and demographic data (as measured by the separate questionnaire) was added
manually. To be able to give feedback to the participants about their deception/non-deception discrimination, their scores were calculated with an Excel code.
Then, all data was imported to SPSS. Descriptive statistics and frequencies of age, gender, group, function, and work experience were examined. Then the data was restructured, and new variables were determined to differentiate the conditions from the original study (condition 1-8, hostile intent yes/no, cognitive load yes/no, cue yes/no). Then, two new variables were created that contained the hit rates (H) and false alarm rates (F) for each participant, respectively for all conditions at once and for each single condition (the hit rate is the number of people rated guilty divided by the number of people with hostile intent and the false alarm rate is the number of people rated guilty divided by the number of people with non-hostile intent). These were then entered into an Excel file by Zhang and Mueller (2005, see https://sites.google.com/a/mtu.edu/whynotaprime/), which was provided to calculate A (the improved non parametric index of sensitivity) for each condition of the 2 (cognitive load: high vs. low) x 2 (cue: present vs. absent) design. The formula for A can be seen in Figure 2.
[image:12.595.78.327.519.600.2]The calculated values were rounded to the third number after the decimal point and manually entered back into SPSS. Two more participants (one student, one police officer) had to be taken out of the analysis because of missing data (they only answered with no). Then, the data was restructured again to continue with the analysis. QQ plots were created to examine whether the A scores of the two conditions and the A scores of all conditions were normally distributed and thus meet the assumptions for the repeated measures analysis. After that, a 2 x 2 repeated measures ANOVA, with the four conditions (cue & cognitive load, no
12
cue & cognitive load, cue & no cognitive load, no cue & no cognitive load) as independent variables and the A scores of each condition as dependent variables, was performed to look for significant differences in A scores between the groups, as they were found in the to-be replicated study.
To answer the research question and find actual indicators of deception, the videos from the test by Wijn et al (2017) were examined by two independent researchers who were blind to the conditions the people in the videos were assigned to. With an inductive approach, they described the behaviours of the participants in the videos. To ensure intersubjectivity, only codes that overlapped or were deemed similar enough by both researchers were used for the analysis. The codes were then spread out across their original eight conditions to look for differences in behaviour. In addition, a coding scheme was developed for the indicators of deception that participants reported to have used before and after the test. Here, only the data of 24 participants could be regarded because three gave useless answers. In this way, their general beliefs about deception indicators as well as their approach in this specific test was taken into account. The unit of analysis were meaningful phrases that the participants wrote down before and after the test. In line with the constant comparative method (Boeije, 2002), police officer’s use of indicators of deception was compared with already existing codes to identify similarities and differences. The codes were grouped into conceptual categories, analysed, and compared with indicators of deception described the scientific literature. A certain behaviour or group of behaviours was only coded once per participant, even if he or she mentioned it more often. It also had to be mentioned by at least two participants per group to be regarded for further analysis. Descriptions of mental states, outer appearances, or
generalized statements (for example, “nervous”, “warm clothes”, or “body language”) were ignored, because these had nothing to do with nonverbal behaviour and therefore could give no useful information in light of the research question. When participants contradicted themselves in their account it was coded with ‘contradictory/unclear’ (for example, “holding and putting the bag far away from body”).
To further enrich the findings in line of the research question, three independent samples t-tests were conducted to examine whether participants that seemed to use more correct indicators of deception were more successful than participants with less correct indicators of deception.
3. Results 3.1 Replication
13
Figure 1. Rate of hits, misses, false alarms and correct rejections for students and police officers (n=23)
The 2 (Cue: present vs. absent) x 2 (Cognitive load: high vs. low) repeated-measures ANOVA showed no statistically significant main effect of Cognitive load on A, F (1,21) = 0.01, p = .92, p = .00, and no significant main effect of Cue on A, F (1,21) = .36, p = .56, p
= .02. In addition, there was no significant interaction effect of Cue and Cognitive load on A, F
(1,21) = 0.30, p = .60, p = .01. The findings from the original study could not be replicated:
14
Table 4: Means and confidence intervals (95%) of A as a function of cognitive load (high vs. low) and cue (present vs. absent)
Cue
Present Absent
Cognitive Load M 95% CI M 95% CI
High .47 .37, .57 .47 .40, .55
Low .46 .42, .49 .48 .40, .56
3.2 Codes
3.2.1 Indicators of deception. In order to answer the research question ‘Which behavioural indicators make deceiving individuals stand out and in how does far police officers’ and students’ use of indicators of deception differ?’, we first examined the
behaviours that the smuggling individuals in the videos exhibited. As can be seen in table 5, there are few differences in behaviours between the two conditions. The most remarkable difference lies in the fact that more individuals from the hostile intent condition seemed to handle their clothes in some way. This included adjusting their sweaters or fixing their nametags as if they felt uncomfortable. Moreover, seven individuals from the hostile intent condition walked remarkably slower than considered usual by the observers, while only one individual without hostile intent did. Seven more persons with hostile intent put their hand in the pocket of their pants, but this was also a common behaviour in the non-hostile group. Furthermore, while eight people without hostile intent walked a notable straight line, none of the non-hostile intent condition did. And finally, it was striking that both observers noted seven people who walked in a stiff and tensed-up way and nine people who walked dynamically for, respectively, the hostile and non-hostile condition. The other behaviours were remarkably similar for both conditions: Looking to the side, looking around (in the sense of turning around or scanning the area), laughing or smiling, looking to the ground, touching one’s face, and putting down the bag were equal or almost equal in being noted by both observers.
Table 5: Differences and similarities in nonverbal behaviours of individuals with or without hostile intent
Hostile intent condition (n=67) Non-hostile intent condition (n=65)
Fiddles at clothes (11) > Fiddles at clothes (1) Slow walking (7) > Slow walking (1) Hand in pocket (20) > Hand in pocket (13) Straight line (0) < Straight line (8)
[image:15.595.75.526.526.690.2]15
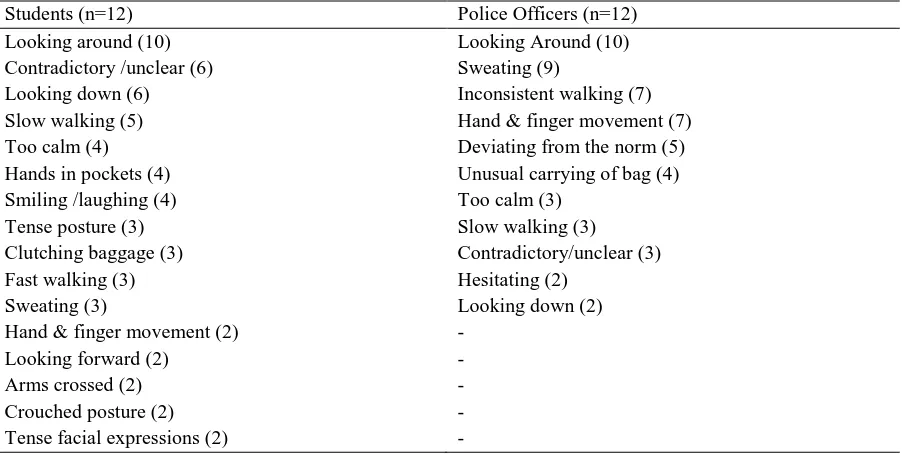
[image:16.595.74.525.457.684.2]3.2.2 Beliefs about indicators of deception. Table 6 shows a comparison in the use of indicators by students and police officers (POs). While both used ‘looking around’ as their most frequent indicator of deception, the rest differs: The POs seem more consistent in their judgements. Their second most used indicator is ‘sweating’, which was mostly mentioned before the test was done and is only used three times by the students. ‘Inconsistent walking’ means that people do not walk straight to their destination, that they do not walk in the middle of the hallway, or that their behaviour changes while walking. It is used by seven police officers and no students as indicator. ‘Hand and finger movements’ consists of nervous playing with one’s hands and touching one’s face, hair, nose, or clothes. While 7 POs used it as an indicator of deception, only 2 students did. Another striking observation was that five police officers used ‘deviating from the norm’ as a frequent measure, while students did not. They stated to be specifically on the lookout for behaviours that were different from the ones that other people at the scene exhibit. Other behavioural indicators seldomly used by the police officers were ‘unusual carrying of the bag’, ‘slow walking’, ‘hesitating’, and ‘looking down’. The latter was used six times by the students. The indicator ‘too calm’ was used by four POs and three students. They described that some people in the videos looked too effortfully relaxed. It is, however, not clear which specific non-verbal behaviour of these people it was that made them stand out. Students showed more contradictions in their accounts. Not only because they had many contradictory statements, but also because ‘slow walking’ and ‘fast walking’ were both used as indicators, in addition to ‘smiling/laughing’ and ‘tense facial expressions’ (both pairs can be deemed opposites). Two students also used ‘looking forward’ as an indicator which contradicts with ‘looking down’. Other seldomly mentioned indicators that the students used were ‘hands in pockets’, ‘tense posture’, ‘clutching baggage’, ‘arms crossed’, ‘crouched posture’ and ‘tense facial expressions’
Table 6. Students’ and police officers’ beliefs about indicators of deception (in decreasing order of quantity)
Students (n=12) Police Officers (n=12)
Looking around (10) Looking Around (10)
Contradictory /unclear (6) Sweating (9)
Looking down (6) Inconsistent walking (7)
Slow walking (5) Hand & finger movement (7)
Too calm (4) Deviating from the norm (5)
Hands in pockets (4) Unusual carrying of bag (4)
Smiling /laughing (4) Too calm (3)
Tense posture (3) Slow walking (3)
Clutching baggage (3) Contradictory/unclear (3)
Fast walking (3) Hesitating (2)
Sweating (3) Looking down (2)
Hand & finger movement (2) -
Looking forward (2) -
Arms crossed (2) -
Crouched posture (2) -
16
It seems that (a) the behaviour of individuals in both conditions was highly similar and (b) the beliefs about indicators of deception, by students and police officers alike, were faulty and inconsistent when compared to the actual behaviours. While the police officers had less contradictions in their judgments, the only reliable indicators, if compared with the actual behaviours, were ‘hand and finger movements’, of which nervous fiddling with one’s clothes is a part, and ‘slow walking’. The only reliable indicators used by the students were ‘slow walking’ ‘tense posture’, and ‘hands and finger movements’, whereby the effect this had on their success rate remains questionable, considering that only eleven out of 67 individuals from the hostile intent condition fiddled with their clothes, seven walked remarkably slow, and seven had a tense posture.
3.3 Additional analyses
There was no significant difference in the means of A-scores of participants who believed that slow walking was indicative of hostile intention (M = .48, SD = .05) and participants who did not (M = .45, SD = .11), t (21) = -0.58, p > .05. There was also no significant difference in the means of A-scores of participants who believed that a tense posture was indicative of hostile intention (M = .48, SD = .11) and participants who did not (M = .45, SD = .10), t (21) = -0.51, p > .05. Finally, there was no significant difference in the means of A-scores of participants who believed that hand and finger movements were indicative of hostile intention (M = .50, SD = .10) and participants who did not (M = .43, SD = .08), t (21) = -1.8, p > .05.
4. Conclusion and Discussion 4.1 General Discussion
The results from the replication were contrary to the results from the original study: The type of cue or cognitive load had no main effect or interaction effect on the sensitivity of
observers. Environmental cues and cognitive load did not lead to higher detection accuracy of individuals with hostile intention. In the original study by Wijn et al (2017), it was argued that the hostile intent manipulation led to several psychological constructs, including the actual experience of hostile intent, increased self-focus and anxiety, inhibitory control of anxiety, and activation control of normal behaviour. It was then concluded that cognitive load impaired the control of impression management and under these conditions, cues from the environment that signal risk of exposure could increase anxiety-related reflexes.
This might have been true for only a few people: As could be seen in the first coding scheme, there was indeed a slight difference in behaviour between people with hostile
intention and people without it. These were nervous handling of their clothes and slower, stiff, and tense walking as opposed to natural and dynamic walking. The latter two fit to the
findings in the literature that deceivers often show an increase in rigidity (Vrij, 2000). Nervous handling of one’s clothes as an indicator, which can be put on equal footing with hand and finger movements, contradicts with the meta-analytical findings of Vrij, which suggest that these kinds of movements decrease with most deceiving individuals.
17
the manipulation in the original study was only deemed successful because people understood their hostile role, not because they experienced real hostile intentions (Wijn et al., 2017). Even if it is assumed that the manipulation of hostile intent in the original study was successful for most people, then that would mean that anxiety manifests itself in the
behaviour of anxious people in different manners: as nervous behaviour or as stiff behaviour. Vrij (2000) also described that anxious people behaved in different ways and that it is
dependent on the personality if they showed nervousness or became stiffer with less movement. Either way, it was impossible to discern people with hostile intent from those without.
The second coding scheme shows that police officers’ and students’ beliefs about indicators included a broad spectrum of behaviours that were mostly invalid, stereotypical and contradictory. This is also in line with previous findings (Fiedler & Walka, 1993). For example, ‘looking around’ was, after the test, deemed by many to be a good indicator of hostile intent. In the videos, to them, it seemed unnatural if people looked around the area, because it was only a dark hallway and there was nothing to see. Therefore, it seemed to many observers as if these people were trying to behave “as normal as possible” and thereby blowing their cover, because the people who had nothing to hide supposedly just walked straight down the hallway, eager to finish their task. This, however, could in no way be confirmed by the coding of the actual behaviours, were it got clear that looking around was a behaviour that was evenly distributed over both conditions.
Faulty use of “gaze aversion” indicators (looking down, looking around) seems to be common for laypeople and experts alike. There is no scientific evidence that many people avoid eye contact while deceiving, but still it is considered to be one of the most important indicators of deception (Vrij, 2000), probably because it is indicative of hiding or distancing. The police officers further used more ‘nervous hand- and finger movements’-indicators than students even though these have been shown by the literature to be invalid (DePaulo et al., 2013). ‘Sweating’ and ‘inconsistent walking’ are two more examples of faulty indicators used by the police officers. Further, people who were clutching at their baggage seemed suspicious. But also here, this behaviour was not observed more or less in each of the two conditions. All this is in line with previous studies, which repeatedly found significant differences between people’s beliefs about deceptive behaviours and actual deceptive behaviours (Zuckermann, Koestner & Driver, 1981).
The average sensitivity was lower than chance. Like it has been suggested by the literature, people are bad at recognizing deceivers based on their non-verbal behaviour (Bond & DePaulo, 2006). If the experiment would be repeated often enough with a computer program that merely decided by chance, a better sensitivity would be obtained. This is a vivid illustration of the fact that when trying to detect deceivers, nonverbal behaviour is the last thing one should look for (DePaulo et al., 2003).
18
hold as many false beliefs as laypeople do (Akehurst, Köhnken, Vrij & Bull, 1996; DePaulo & Pfeiffer, 1986). However, a more recent study suggests that cues to deception used by police officers in real-world settings might be more often correct and that the literature paints a distorted picture of their abilities which is based on experimentally induced situations involving mock-crimes (Wright & Wheatcroft, 2017). This is indeed a difference one must acknowledge before judging police officers too harshly. It can be that they reported the indicators they think they use, but in real-life settings they unknowingly use other indicators. Their work experience could have given them an intuitive skillset that helps them in high-stake situations, but not so much in experimental situations.
Another result is that that those participants who used indicators that fitted better to the actual behaviour of individuals with hostile intent did still not have significantly higher detection rates, because these behaviours were only present with a few individuals. This gives additional support for the argument already mentioned above: There was no way of
recognizing the people with hostile intent. ‘Suspicious’ behaviour is immensely dependent on the person, subtle, and filtered by our own biases and beliefs (Vrij, 2000).
These biases include availability bias, which means that a person evaluates the probability of an event by its availability. We have such incomplete information about the world that we have to rely on the memories that are most easily retrieved (Tversky &
Kahnemann, 1973). In this way, when we ask ourselves how a deceiving person behaves, we think of the few instances where we were successful in uncovering the deception. But this of course stands against many more instances where we were effectively deceived and thus thought that the behaviour of our opposite seemed honest. Another bias is the unawareness of one’s own deceiving-behaviour (Vrij, 2000). If we ask ourselves the question “How would I behave?”, this often includes faulty indicators of deception because humans are generally bad at assessing their own higher order cognitive processes introspectively (Nisbett & Wilson, 1977).
Further, people seem to automatically generalize high-stake situation behaviour to all situations (Vrij, 2000). A good example of this is that some participants indicated that, if people put down the bag, this would be a clear sign for them being not guilty, because who would put down a bag with a bomb in it? But of course, there was no real bomb in it and it is unlikely that the original experiment was successful in creating this type of belief resulting in extra-careful handling of the bag in the participants. And lastly, people frequently make use of the representativeness heuristic (Kahneman & Tversky, 1972). That is, they automatically substitute hostile intent with some type of observable behaviour and start to confound these two things. For example, participants often looked for nervous movements even though it was not clear if the hostile people in the videos were nervous at all.
19
slightly-above chance level. Those perpetrators who indeed have harm in mind will most likely be professionally trained terrorists who will stay calm and in no way be spotted based on their nonverbal behaviour. And third, rerouting travellers would mean to expose all people at the airport to increased stress. This is not sustainable and would most likely only create chaos. Moreover, many people at the airport are stressed and anxious to miss their flight anyway and such an incentive would make it even more so, thereby making it impossible to separate the wheat from the chaff.
Initiatives that have been taken in the United Stated, like the SPOT program, have been shown to be largely unsuccessful in discerning and preventing security risks
(Weinberger, 2010). Instead, it is suggested that officials use on more reliable methods that either do not use nonverbal behaviour as an indicator at all, like the screening of physiological qualities (Eachus, Stedmon & Baillie, 2013) or the use of algorithm-based automated system to spot people who show deviating behaviour (Huang, 2011). Or that they only use nonverbal behaviour as an anchor point to start a short interview that investigates the far more reliable verbal behaviour of potential harm doers (Kassin, Meissner, & Norwick, 2005). By testing the verbal behaviour, first with easy questions and then with surprising and more difficult ones, it is easier to expose single passengers to cognitive load and to establish a baseline for each person. Such a form of strategic interviewing, called ‘veracity testing’, was recently developed by Ormerod and Dando (2015) and it led to 66% detection accuracy by security agents compared with less than 5% using behavioural indicators alone. They could also look for microfacial expressions, which can result in an 80% detection rate, but this is unlikely to be applicable because it would take a long time to master this skill (Frank & Ekman, 1997) Either way, these should be methods that do not take up the time or patience of other passengers.
Furthermore, instead of being trained to look for only some specific nonverbal behaviours, officials should be trained to be pragmatic in their judgements: Just because person A behaves in a certain way that is reminiscent of deceit, that does not mean that person B behaves in the same way when he is deceiving. Because of that, they should be cautioned against using fixed behavioural indicators because this is an impossible strategy. It would be more desirable to look for deviations from the norm (Ekman & O’Sullivan, 1991), like some of the police officers in the current study have already done. In essence, it will be more effective to correct misbeliefs and then to encourage officers to be flexible and open in their judgments instead of giving them a fixed set of cues.
4.3 Suggestions for future research
20
use of stereotypical indicators (for example by instructing them to assess behaviours
21
References
Aamodt, M. G., & Custer, H. (2006). Who can best catch a liar?. Forensic Examiner, 15(1), 6.
Akehurst, L., Köhnken, G., Vrij, A., & Bull, R. (1996). Lay persons' and police officers'
beliefs regarding deceptive behaviour. Applied Cognitive Psychology, 10(6), 461-471.
Boeije, H. (2002). A purposeful approach to the constant comparative method in the analysis
of qualitative interviews. Quality and quantity, 36(4), 391-409.
Bond, Jr, C. F., & DePaulo, B. M. (2006). Accuracy of deception judgments. Personality and Social Psychology Review, 10, 214–234. doi:10.1207/s15327957pspr1003_2
Brown, M. A., & Stopa, L. (2007). The spotlight effect and the illusion of transparency in social anxiety. Journal of Anxiety Disorders, 21, 804–819.
doi:10.1016/j.janxdis.2006.11.006
DePaulo, B.M. & Kashy, D.A. (1998). Everyday lies in close and casual relationships.
Journal of Personality and Social Psychology, 74, 63-79
DePaulo, B. M., Kirkendol, S. E., Tang, J., & O'Brien, T. P. (1988). The motivational impairment effect in the communication of deception: Replications and
extensions. Journal of Nonverbal Behavior, 12(3), 177-202.
DePaulo, B. M., Lindsay, J. J., Malone, B. E., Muhlenbruck, L., Charlton, K., & Cooper, H. (2003). Cues to deception. Psychological Bulletin, 29, 74–118. doi:10.1037/0033-2909.129.1.74
DePaulo, B. M., LeMay, C. S., & Epstein, J. A. (1991). Effects of importance of success and
expectations for success on effectiveness at deceiving. Personality and social
psychology bulletin, 17(1), 14-24.
Driskell, J. E. (2012). Effectiveness of deception detection training: A
meta-analysis. Psychology, Crime & Law, 18(8), 713-731.
Eachus, P., Stedmon, A., & Baillie, L. (2013). Hostile intent in public crowded spaces: A field study. Applied Ergonomics, 44, 703–709. doi:10.1016/j.apergo.2012.05.009
Ekman, P. (1992). Telling lies: clues to deceit in the marketplace, politics, and marriage. New York: W.W. Norton.
Ekman, P. (1997). Deception, lying, and demeanor. States of mind: American and post-Soviet
perspectives on contemporary issues in psychology, 93-105.
Ekman, P., & O'sullivan, M. (1991). Who can catch a liar?. American psychologist, 46(9),
913.
Fiedler, K., & Walka, I. (1993). Training lie detectors to use nonverbal cues instead of global
heuristics. Human communication research, 20(2), 199-223.
22
Hartwig, M., Granhag, P. A., Strömwall, L. A., & Vrij, A. (2004). Police officers’ lie
detection accuracy: Interrogating freely versus observing video. Police
Quarterly, 7(4), 429-456.
Hofmann, W., Schmeichel, B. J., & Baddeley, A. D. (2012). Executive functions and self-regulation. Trends in Cognitive Sciences, 16(3), 174–180.
doi:10.1016/j.tics.2012.01.006
Hindman, J., & Peters, J. M. (2000). Polygraph testing leads to better understanding adult and
juvenile sex offenders. Fed. Probation, 65, 8.
Homeland Security, U.S. Department of (2015). Scientific Substantiation of Behavioral Indicators. Fiscal Year 2015 Report to Congress. Retrieved at 22 Februar 2018, from https://www.dhs.gov/sites/default/files/publications/Transportation%20Security%20A dministration%20%28TSA%29%20%20Scientific%20Substantiation%20of%20Beha vioral%20Indicators.pdf
Huang, S. C. (2011). An advanced motion detection algorithm with video quality analysis for
video surveillance systems. IEEE transactions on circuits and systems for video
technology, 21(1), 1-14.
Kahneman, D., & Tversky, A. (1972). Subjective probability: A judgment of
representativeness. Cognitive psychology, 3(3), 430-454.
Kassin, S. M., Meissner, C. A., & Norwick, R. J. (2005). " I'd know a false confession if I saw
one": a comparative study of college students and police investigators. Law and
Human Behavior, 29(2), 211.
Koller, C. I., Wetter, O. E., & Hofer, F. (2015). ‘Who’s the Thief?’ The Influence of knowledge and experience on early detection of criminal intentions. Applied Cognitive Psychology, 30, 178–187. doi:10.1002/acp.3175
Levine, T. R. (2010). A Few Transparent Liars Explaining 54% Accuracy in Deception
Detection Experiments. Annals of the International Communication
Association, 34(1), 41-61.
Mann, S., Vrij, A., & Bull, R. (2004). Detecting true lies: police officers' ability to detect
suspects' lies. Journal of applied psychology, 89(1), 137.
Maxwell, S. E.,Lau, M. Y.,Howard, G. S. (2015). Is psychology suffering from a replication crisis? What does “failure to replicate” really mean? American Psychologist, 70(6), 487-498.
Muraven, M., Tice, D. M., & Baumeister, R. F. (1998). Self-control as a limited resource:
Regulatory depletion patterns. Journal of personality and social psychology, 74(3),
774.
Nisbett, R. E., & Wilson, T. D. (1977). Telling more than we can know: Verbal reports on
23
Ormerod, T. C., & Dando, C. J. (2015). Finding a needle in a haystack: Toward a
psychologically informed method for aviation security screening. Journal of
Experimental Psychology: General, 144(1), 76..
Reinhard, M. A., Scharmach, M., & Müller, P. (2013). It's not what you are, it's what you know: Experience, beliefs, and the detection of deception in employment
interviews. Journal of Applied Social Psychology, 43(3), 467-479.
Spellman, B. A. (2015). A short (personal) future history of revolution 2.0.
Troscianko, T., Holmes, A., Stillman, J., Mirmehdi, M., Wright, D., & Wilson, A. (2004). What happens next? The predictability of natural behaviour viewed through CCTV
cameras. Perception, 33(1), 87-101.
Tversky, A., & Kahneman, D. (1973). Availability: A heuristic for judging frequency and
probability. Cognitive psychology, 5(2), 207-232.
Vrij, A. (1993). Credibility judgments of detectives: The impact of nonverbal behavior, social
skills, and physical characteristics on impression formation. The Journal of social
psychology, 133(5), 601-610.
Vrij, A. (2000). Detecting lies and deceit: The psychology of lying and implications for
professional practice. Wiley.
Vrij, A., Edward, K., & Bull, R. (2001). Police officers' ability to detect deceit: The benefit of
indirect deception detection measures. Legal and Criminological Psychology, 6(2),
185-196.
Weinberger, S. (2010). Airport security: Intent to deceive? Nature, 465, 412–415. doi:10.1038/465412a
Wegner, D. M. (2009). How to think, say, or do precisely the worst thing for any occasion. Science, 325(5936), 48–50. doi:10.1126/science.1167346
Wegner, D. M. (1994). Ironic processes of mental control. Psychological review, 101(1), 34.
Wijn, R., Kleij, R., Kallen, V., Stekkinger, M., & De Vries, P. (2017). Telling friend from foe: Environmental cues improve detection accuracy of individuals with hostile
intentions. Legal and criminological psychology, 22(2), 378-399.
Wright, C., & Wheatcroft, J. M. (2017). Police officers' beliefs about, and use of, cues to deception. Journal of Investigative Psychology and Offender Profiling, 14(3), 307-319.
Zhang, J., & Mueller, S. T. (2005). A note on ROC analysis and non-parametric estimate of
sensitivity. Psychometrika, 70(1), 203-212.7
Zuckerman, M., Koestner, R., & Driver, R. (1981). Beliefs about cues associated with
24
Appendix A Questionnaire (translated from Dutch)
- How old are you
- Nationality and gender
- What is your study subject, which year (students)
- How long have you been working for the police, what is your position (officers)
- Did you follow one of these two trainings: Spottersopleiding Ja/nee; SDR Ja/Nee<
- Which nonverbal behaviours would you attend to if you had to catch a smuggler in
an airport? Please be as specific as possible
- You have just seen a number of videos. Please take a moment to remember the