Approaching environmental sustainability of agriculture:
environmental burden, eco-efficiency or eco-effectiveness
Bazyli Czyżewski
1, Anna Matuszczak
2*, Andreea Muntean
31University of Applied Sciences in Piła, Faculty of Economics, Poland
2Poznan University of Economics and Business, Faculty of Economics, Poznan, Poland 3Faculty of Economic Sciences, University of Alba Iulia, Alba Iulia, Romania
*Corresponding author: anna.matuszczak@ue.poznan.pl
Citation: Czyżewski B., Matuszczak A., Muntean A. (2019): Approaching environmental sustainability of agriculture: envi-ronmental burden, eco-efficiency or eco-effectiveness. Agricultural Economics – Czech, 65: 299–306.
Abstract: The main goal of the article is to compare three approaches to measuring environmental sustainability in ag-riculture: i) the environmental burden index; ii) the sustainable value of eco-efficient production; and iii) the sustai-nable value of the eco-effective farm, applied to the sample of 130 EUFADN (European Union Farm Accountancy Data Network) regions in 2015. The study indicates a fundamental problem: the notion of environmental sustaina-bility in agriculture differs depending on the criterion we apply. We recognized a principle trade-off in the Common Agricultural Policy (CAP) which consists of compensating for the strain on the natural environment with production or with public goods provision. Studies on these two effects seem to be crucial to draw a consistent development path for the CAP. Our major finding is that public goods-oriented farming is more likely to expand after improving eco-efficiency. This is still a challenge because in European regions, eco-efficient has not meant environmentally sustainable yet.
Keywords:agriculture; environment; EU regions; sustainable development
Discussion on the measures of sustainable develop-ment of agriculture is nothing new. In the literature, the issue is most often analysed in its economic, social and environmental aspects (Kates et al. 2005). While the first two are not difficult to evaluate (mostly from the perspective of income, employment, and education), some dilemmas arise in the context of environmental sustainability. One of the major dilemmas is whether: i) to decrease the overall environmental burden of agri-culture, no matter the production effects; ii) or to gener-ate the highest production in relation to the polluting means used (e.g. fertilisers, pesticides, energy) and gases emitted – so-called “eco-efficiency”; and iii) or to adopt a consensus consisting in the fact that the inputs used in agricultural production are unfavourable for the natu-ral environment and so simultaneously should be com-pensated for through agri-environmental activities, which create environmental public goods – so-called
“eco-effectiveness”. Unfortunately, there is no universally accepted research methodology; however, the eco-efficiency approach (Coelli et al. 2005; Stoate 2009) is dominant in the literature. The aim of the article is to compare the results of three approaches to measur-ing environmental sustainability: i) the environmental burden index for agriculture; ii) the sustainable value of eco-efficient production; and iii) the sustainable value of the eco-effective farm, applied to the sample of 130 EUFADN regions in 2015 (i.e. region-average farms data from the EU Farm Accountancy Data Net-work; see more in methodology).
THEORETICAL BACKGROUND: ECO-EFFECTIVE VERSUS ECO-EFFICIENT
The construction of a composite measure of the en-vironmental burden in agriculture is a problematic
issue.Reytar et al. (2014) point out 25 various indica-tors related to environmental sustainability. The vari-ables, referring to water consumption, agricultural subsidies, climate change, agricultural production, ecosystem biodiversity, and land use, were deemed to be of key significance. Other approaches point to the issues of pesticide, herbicide, and fungicide in agricultural production, as well as the use of organic and synthetic fertilisers, plant protection products and crop rotation (Saltiel et al. 1994; Hayati et al. 1996; Czyżewski et al. 2018).
The term “eco-efficiency” appeared in the 1990s as a practical tool to measure sustainability. It was intro-duced by the World Business Council for Sustainable Development (Schaltegger and Sturm 1990; Schalteg-ger 1996; WBCSD 2000) to identify a management philosophy aimed at encouraging businesses to search for environmental improvements that yield parallel economic benefits. A workable approach to sustain-ability at the farm level consists in testing whether en-vironmental impacts decrease as the value of economic outputs is maintained or increased (Picazo-Tadeo et al. 2011). However, we have a concern whether such a change in the eco-efficiency reflects a corresponding change in sustainability understood as a responsible use of ecological resources that meet human needs but also preserves these resources for future genera-tions. The eco-efficiency ratio measures a relative level of environmental pressure in relation to the vol-ume of economic activity. In our opinion, the idea of sustainability is more related to the absolute levels of environmental pressure.
So, the eco-efficiency approach may be some-what contradictory to the idea of environmental sustainability, which should take into consideration the actual environmental effect on farms. In addition, the EU Common Agricultural Policy is evolving: next to its original assumptions related to the food safety and support for agricultural incomes the policy sets new goals related to the respect for the environment or the creation of public goods, in particular environ-mental ones (Olper 2001). Therefore, it is interesting to what degree the support for agriculture from vari-ous Common Agricultural Policy (CAP) programmes affects the increase in the eco-efficiency of farms and to what extent it affects their eco-effectiveness. At this point a certain conflict between the eco-effective-ness and the eco-efficiency might be expected, due to the policy supporting both types of programmes that have a strong impact on the eco-efficiency issues but also such wherein the eco-effectiveness is
domi-nant. This conflict impedes the sustainable develop-ment of the agriculture. The results of this research, then, will contribute to the discussion regarding the fu-ture of the EU’s Common Agricultural Policy after 2020, but also the national and regional agricultural policies. The crucial question is, what should be the output measure in the input-output (I-O) approaches used to assess the environmental sustainability? It is also not certain to what extent the hitherto funding of agri-culture facilitates the implementation of goals regard-ing its sustainable development, and to what extent it consolidates the industrial model of production – where issues of efficiency will be of key importance.
MATERIAL AND METHODS
Composite measure of the environmental burden in agriculture
Taking into account the above-mentioned remarks, the following variables from the EUFADN database (EUFADN Poland 2017; EUFADN 2018) were applied in our study for the construction of a composite meas-ure at the level of an average farm in a given region (EUFADN codes in brackets):
i) Stock density per ha (SE120);
ii) Mineral fertilisers use per ha (SE295/SE025); iii) Plant protection products use per ha (SE300/SE025); iv) Total use of energy per ha (SE345/SE025); v) Woodland area in relation to utilised agricultural area (UAA) (SE075/SE025).
All the European regions were analysed in 2015, as the last available year in the FADN.
object zi (the average EUFADN farm in the region), cf. Equation (1):
1
μ 2 σi
i
D D
D
H
21
m
i ij maxj
j
D z z
(1)where: Hi is the composite index for ith farm/region;
Di – the Euclidean distance of the ith farm/region
from the best object; zij – standardised and weighted empirical values of variable j (j = 1, 2, … , m) from the above mentioned i–iv) in the ith farm/region;
μD – mean of D; σD – standard deviation of D. The higher the value of the composite index,
0;1 , iH the lower the pressure on the environment.
Sustainable value of eco-efficient production
Estimating the environmental sustainable value (ESV) with frontier benchmarking was carried out assuming a trade-off of productivity versus the envi-ronment. ESV is a value-oriented method, developed as a mean of measuring the agricultural eco-efficiency at the microeconomic level. This enables a synthetic assessment of a farm’s contribution to farming sus-tainability, taking into account the efficiency result-ing from usresult-ing economic, social and environmental resources in comparison to the opportunity cost (Figge and Hahn 2005; van Passel et al. 2007; Illge et al. 2008; Burja and Burja 2016). ESV has many advantages comparing to the standard data en-velopment analysis (DEA) approach, since it also measures the monetary value of the “contribution to the sustainability” that should be borne to achieve it or that was paid in surplus. Thus, it gives much more information useful for policymakers than a simple linear ordering. However, we propose to en-gage the DEA technique to identify a benchmark unit for the ESV – which is an original contribu-tion. In the literature, the use of DEA techniques to measure eco-efficiency in different sectors, as well as for the assessment of the environmental perfor-mance of farms and the agricultural sector, is wide-ly known. However, there are not so many studies which estimate the eco-efficiency at the farm level using the DEA approach. The most recent of them are: Picazo-Tadeo et al. (2011), Gómez-Limón et al. (2012), Picazo-Tadeo et al. (2012), Berre et al. (2015), Gadanakis et al. (2015), Pérez Urdiales et al. (2016),
Bonfiglio et al. (2017). In all the cited works, the eco-efficiency improvement is defined in the same way, i.e. as a situation when the environmental impacts decrease, whereas the value of the economic outputs is maintained (or increased). None of the cited studies brings into question the underlying idea of trade-offs between the farm output and the environmental pres-sure. Indeed, there is a lack of studies on whether the improvement in the farm eco-efficiency ratio is really “sustainable”. Many authors took the as-sumption that “eco-efficient equals more sustainable” for granted. Although some of them admit the op-posite, this is not reflected either in the methodology nor in the conclusions (Picazo-Tadeo et al. 2011). In the above context, we have a motivation to con-front the eco-efficiency scores for the EUFADN units in the regional cross-section with different approaches to the matter of environmental sustain-ability. Our analysis also sheds light on the basic characteristics of the most eco-efficient and the most eco-inefficient average farms in the European regions. This information is missing in the cited works, which mainly give only indirect clues as to what farms located on the eco-efficiency frontier are really like (see discussion in the results part of this paper).
We used the ESV measure, which is quite a fresh view and generates output in a more practical way for policy makers (i.e. in monetary units) than the frequently applied DEA. However, we do recall that the ESV calculated in the studies extends the DEA analyses which are primarily used to identify the so-called benchmark units ybijand rbij. The input-oriented DEA approach has been applied following the studies of Kuosmanen and Kortelainen (2005), Picazo-Tadeo et al. (2011) and Bonfiglio et al. (2017). The calcula-tion formula for determining the ESV of the farms in the regions is as follows:
1
1 m
ij ij
i ij
j ij ij
y yb
SV r
m r rb
(2)i = 1, ... , n is the region, and j = 1, ... , m is the type of analysed capital (resource).
The SV, if it has a minus sign, indicates a value of “clean production” (obtained without the additional input of polluting capital) which ought to be provided by a farm to achieve the benchmark eco-efficiency level, or if it has a plus sign, indicates a clean produc-tion exceeding the average eco-efficiency of farms on the frontier. To take into account the size effects and to make comparisons between the farms of various countries, we can calculate the indicator return to cost ratio(RTCi). An RTC score exceeding 1 can be per-ceived as a share of the “clean” output with reference to the benchmark unit, while the score below 1 shows an output required to catch up with the benchmark (e.g. 1.11 means that 11% of output is clean in the sense that it would not need polluting inputs comparing to the eco-efficiency or eco-effectiveness of the aver-age farm on the frontier, and 0.95 score means that a unit should replace 5% of output by the “clean” output to catch up with the benchmark). This shows the rela-tive contribution of farms from various countries to the sustainable performance compared to the bench-mark that may be used for the ordering:
i i
i i
y RTC
y SV
(3)
where: yistands for the created output.
In the eco-efficiency approach, we use the set of vari-ables described in the previous point: the polluting capitals as the input indicator (crop protection, fer-tilisers, energy, non-wood area, stocking density) and as the output indicator – total output, including shares of total output crops and total output livestocks.
Sustainable value of the eco-effective farm
In the second ecological approach, we have employed environmental public goods as the effect indicator (y), assuming the so-called “institutional” valuation of pub-lic goods by the CAP subsidies (Czyżewski et al. 2017). Hence, we used the same formulas 2–3, and the in-put indicator is the polluting capitals (as above) but as the effect indicator – is environmental subsidies. This is an alternative approach which has not been examined in the literature.
RESULTS AND DISCUSSION
Based on the analyses carried out, three rankings
of EU regions were made, classifying them accord- Table 1. D
es
cr
iptive st
ati
stic
s f
or “
Top and B
ot
tom 10” en
vir
onmen
tally su
st
aina
ble EU
FA
DN r
eg
ions ac
cor
ding t
o t
heir s
yn
the
tic en
vir
onmen
tal bur
den, e
co-effic
i-enc
y, and e
co-eff
ec
tivene
ss s
cor
e in 2015
Com
po
sit
e inde
x
Pr
oduc
tion
(EU
R/ha)
W
oo
d ar
ea
/UA
A
Fer
tili
sers
(EU
R/ha)
Pe
stic
ide
s
(EU
R/ha)
Ener
gy
(EU
R/ha)
St
oc
king density (LU/ha)
En
vir
onmen
tal
sub
sidie
s (EU
R/ha)
U
A
A (ha)
En
vir
onmen
tal
bur
den
“
Top 10
”
me
an
1 945
0.25
45.81
41.42
113.23
1.11
84.61
66.12
“
Bot
tom 10
”
me
an
9 166
0.00
446.51
363.32
568.53
5.21
32.52
17.63
Ec
o-effic
ienc
y
“
Top 10
”
me
an
5 339
0.06
139.67
178.87
279.26
1.47
36.58
41.31
“
Bot
tom 10
”
me
an
4 493
0.00
304.37
236.90
233.91
8.67
13.50
9.42
Ec
o-eff
ec
tivene
ss
“
Top 10
”
me
an
1 632
0.07
83.82
27.68
164.95
1.14
148.17
64.23
“
Bot
tom 10
”
me
an
5 340
0.00
280.31
221.83
335.10
4.35
0.32
41.97
U
A
A – utili
se
d ag
ric
ult
ural ar
ea
; L
U – live
st
oc
k unit
Sour
ce: ow
n c
alc
ul
ation b
as
ed on EU
FA
DN (EU
FA
[image:4.595.352.468.100.777.2]Ta
ble 2. “
Top
and
Bot
tom 10” en
vir onmen tally su st aina ble EU FA DN r eg ions ac cor ding t o t he c om po sit e en vir onmen tal bur den inde x, e co-effic ien
t, and e
co-eff ec tive appr oac h ( benc hmar k unit s c alc ul at ed u sing DE A
, 130 unit
s, 2015, RT C , SV in EU R) En vir onmen tal bur den Ec o-effic ienc y Ec o-eff ec tivene ss re gion H re gion RT C SV re gion RT C SV “Top 10” A ost a (IT A)* 0.44 Pr ovenc e-Alp es -Cot e d ’A zur (FR A) 1.70 79 304 A ost a (IT A) 2.60 4 195 Sloveni a (S N V ) 0.23 The Ne ther land s (N ED) 1.65 171 902 Poh joi s-Suomi (FI N ) 2.04 6 333 C ant abr ia (E SP) 0.21 Alto-A dig e (IT A) 1.64 25 992 Lu xemb our g (L U X) 1.87 7 309 Alentej
o e do Alg
ar ve (P OR) 0.20 Tr en tino (IT A) 1.45 17 003 Et el a-Suomi (E LL) 1.62 3 925 A ustr ia (O ST ) 0.19 Lang ue do c-Rou ss . (FR A) 1.45 41 789 Si sa-Suomi (FI N ) 1.56 2 906 A st ur ia s (E SP) 0.18 La R ioja (E SP) 1.44 26 582 A ustr ia (O ST ) 1.49 1 605 Sar de gna (IT A) 0.18 To sc ana (IT A) 1.41 23 367 Poh janmaa (FI N ) 1.42 3 214
Lan i Nor
ra (S V E) 0.17 D enmar k (DE N ) 1.39 91 050 Alentej
o e do Alg
ar ve (P OR) 1.09 248 Alto-A dig e (IT A) 0.16 Vl aander en (BE L) 1.38 75 845 Sk og s-o ch me llanby gd slan (S V E) 1.03 198 Sc ot land (U K I) 0.16 Br et ag ne (FR A) 1.38 75 474 C ant abr ia (E SP) 1.02 117 “Bot tom 10” Tr en tino (IT A) 0.05 Buc ure sti-Il fo v (R OU ) 0.62 –20 755 Malop ol sk
a and P
ogor ze (P OL) 0.0063 –2 682 M ake doni a-Thr ak i (E LL) 0.05 N ord-E st (R OU ) 0.62 –5 779 Cen tr u (R OU ) 0.0059 –2 363 Lig ur ia (IT A) 0.05 The ss al ia (E LL) 0.62 –14 556 N ord-E st (R OU ) 0.0058 –2 243 C ypr us (C YP) 0.05 M ake doni a-Thr ak i (E LL) 0.60 –15 672 N ord-Ve st (R OU ) 0.0055 –2 707 The ss al ia (E LL) 0.05 Sud-E st (R OU ) 0.56 –11 374 Sud-Ve st -O lteni a (R OU ) 0.00 –4 263 Lomb ar di a (IT A) 0.04 N ord-Ve st (R OU ) 0.53 –8 475 Sud-M unteni a (R OU ) 0.00 –4 321 Vl aander en (BE L) 0.04 Sud-M unteni a (R OU ) 0.47 –14 379 M alt a (ML T ) 0.00 –10 738 Vene to (IT A) 0.04 Ve st (R OU ) 0.45 –13 969 Sc ot land (U K I) 0.00 –14 949 The Ne ther land s (N ED) 0.04 Sud-Ve st -O lteni a (R OU ) 0.35 –14 280 Ve st (R OU ) 0.00 –3 825 M alt a (ML T ) 0.03 Com unid ad V alenc iana (E SP) 0.19 –237 405 Buc ure sti-Il fo v (R OU ) 0.00 –5 588 H – v
alue of t
he H ellw ig inde x; RT C – v
alue of r
et ur n t o c ost ra tio; SV – v
alue of su
st
aina
ble v
alue; DE
A – d
at a en ve lopmen t analy sis IT
A – I
taly
; S
N
V – Sloveni
a; E
SP – S
pain; P
OR – P
or
tug
al; O
ST – A
ustr
ia
; S
V
E – S
we
den; U
K
I – U
nit
ed Kingdom; E
LL – Gr
ee
ce; C
YP – C
ypr
us
; BE
L – B
elg
ium; N
ED – t
he Ne -ther land s; ML
T – Malt
a; FR
A – F
ranc
e; DE
N – D
enmar
k; R
OU – Romani
a; FI
N – F
inl
and; L
U
X – L
ux
emb
our
g; P
OL – P
ol and *b olde d re gions ar e duplic at ed at le ast in two rank ing
s of t
he
“T
op 10” or “B
ot tom 10” – illu stra tive exam ple: RT C 1.19 me ans tha t 19% of out put is “c le an ” in the sens e tha t it would not ne ed p olluting in put s c om par ing t o t he e co-effic ienc
y or e
co-eff
ec
tivene
ss of t
he a
verage f
ar
m on t
he f
ron
tier
, and t
he 0.35 s
cor
e me
ans t
ha
t a unit s
hould r epl ac e 75% of it s out put w ith t he “ cle an ” out put t o c at
ch up w
ith t he b enc hmar k Sour ce: ow n c alc ul ation b as
ed on EU
FA
DN (EU
FA
ing to the composite measure of the environmental burden, eco-efficiency and eco-effectiveness of the ag-ricultural activity conducted on the average farm in the EUFADN region.
Firstly, however, it is worth looking at the aver-ages of the inputs used in the “Top-Bottom” regions in Table 1. They are presented in a consistent form of per ha relations bearing in mind that all the inputs were respectively transformed into destimulants while creating composite indices.
We can see that the intensity of production sig-nificantly differs under the three indices in terms of the “Top 10” inputs use as well as production per ha, i.e. those farms/regions which are the most eco-effective and create the lowest environmental burden are very extensive, whereas those which are eco-efficient are distinguished by a few times more intensive production (Table 1). At the same time, the utilised agricultural area of farms in the “Top 10” is much larger than in the “Bottom 10”. This is quite
a surprising finding that contradicts the common opinion on the environmental sustainability of small farms. On the other hand, it confirms to some extent the results of Gadanakis et al. (2015) which prove that medium farms are more eco-efficient than small ones. Another striking difference consists of the envi-ronmental subsidies that might be perceived as pay-ments for the public goods provision. In this sense, the most eco-efficient farms provide 2 and 4 times lower value of public goods than those units that are leading respectively in their environmental burden and eco-effectiveness score. This result is in line with Picazo-Tadeo’s et al. (2011) and Bonfiglio’s et al. (2017) estimates which show surprisingly strong negative effects of agri-environmental schemes on the eco-effi-ciency of arable farms. So, we may recall the question, whether the eco-efficient agriculture is truly the one that the EU policy (CAP) is keen on prospering?
In Table 2 we can see that the Italian, Spanish, Por-tuguese and Austrian regions reoccur in two “Top 10”
1.2
1.0
0.8
0.6
0.4
0.2
1.2 1.41.6
1.8
1.0 0.8 0.6 0.4 0.2 0.0 0.0 0.4 0.2 2.8 2.6 2.4 2.2 2.0
1.8 1.6 1.4 1.2 1.0 0.8 0.6 0.0
En
vir
onmen
tal bur
den
Eco-effic ienc
y
Eco-effectiveness
[image:6.595.108.477.374.702.2]< 0.7 < 0.5 < 0.3 < 0.1 > 0.8
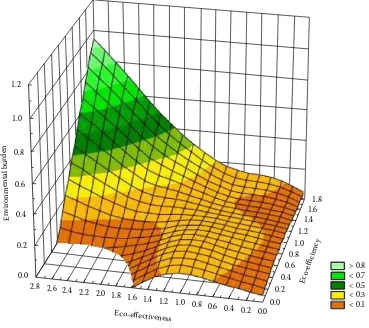
Figure 1. Environmental burden versus eco-efficiency and eco-effectiveness distance-weighted least squares fitting
rankings. However, it is worth noting that the simi-larities in the rankings concern only the environ-mental burden and eco-effectiveness approach. This suggests that the “eco-efficiency” criterion tells us a completely different story. A majority of regions from the top eco-efficiency list (except one, Italian) does not appear among those which exert the lowest pres-sure on the environment or provide a sufficient value of public goods to compensate for the polluting capital used. On the other hand, the high pressure on the en-vironment means sometimes being very eco-efficient. For instance the Netherlands (NED) or Trentino (ITA), which are in the “Top-Bottom” of the highest envi-ronmental burden and simultaneously in the “Top 10” for the eco-efficiency. On the other hand, the rankings of the “Bottom 10” for the efficiency and eco-effectiveness are much more similar than the “Top 10” while dominated by the Romanian regions, which seems to be neither efficient in terms of production nor effective in the provision of the environmental goods requested by the CAP.
But should the eco-effectiveness and eco-efficiency be mutually exclusive, or are there ways to satisfy both criteria? Figure 1 sheds more light on this question. It shows a 3D surface plot which reveals the relation-ships of the environmental burden (H) with the eco-effectiveness (RTC) referring to the different levels of the eco-efficiency (RTC). We can make a striking observation that a strong and positive relationship be-tween the environmental burden and eco-effectiveness appears only on the high level of the eco-efficiency score. Below 1.2 of the eco-efficiency score, the grow-ing eco-effectiveness does not translate into a lower environmental pressure, and below 1.0 of the eco-efficiency score, this relationship (of environmental burden and eco-effectiveness) becomes negative. Hence, it seems to be likely that lowering the agricul-tural pressure on the environment requires a specific sequence of farms development: firstly achieving a critical eco-efficiency level, then becoming more eco-effective and finally decreasing the environmen-tal pressure. This would mean that any shortcut way is very unlikely, and policymakers should not expect that small farms quickly become environmentally sustainable.
CONCLUSION
The aim of the article was to compare three dif-ferent approaches to measuring the sustainability of agriculture in terms of the methodology as well
as the results of an empirical study carried out on a sample of EU regions. The study indicates a funda-mental problem: the environfunda-mental sustainability of European regions differs depending on the criterion we apply. If we compare the composite index of the en-vironment pressure with I-O approaches, we have to concede that the latter has significant operational advantages and is easier to stimulate by agricultural policy means. However, we should admit that there are trade-offs in CAP which consist of compensating the strain on the natural environment with… and here you are the principal question: with production or pub-lic goods? Our major findings are the following. Pubor pub-lic goods oriented farming is more likely to expand after improving eco-efficiency because only in eco-efficient farms the eco-effectiveness goes in line with lowering the environmental pressure. The trade-offs mentioned above appear when the level of the eco-efficiency and the eco-effectiveness is too low. In eco-inefficient farms stimulating eco-effectiveness by environmental subsidies does not result in reducing the environmental burden. Let us remark that the latter is a superior goal of the sustainable development. Hence, agricultural policy should reconsider that small farms are hardly capable of achieving environmental sustainability. We can say there is a sequence of the agricultural development of European farms: productivity => eco-efficiency => eco-effectiveness => lowering absolute pressure on the environment.
As our results show, this challenge (the last step) is still before us, because in the European regions eco-efficient does not mean environmentally sustainable. Policy-makers should think about stimulating eco-efficient farms to be more eco-effective and to enhance small farms to be more eco-efficient. So, there is not a sin-gle concept of environmental sustainability. There is, rather, the sequence of sustainable development which we should be striving for within CAP’s principles.
REFERENCES
Berre D., Vayssières J., Boussemart J.-P., Leleu H., Tillard E., Lecomte P. (2015): A methodology to explore the deter-minants of eco-efficiency by combining an agronomic whole-farm simulation model and efficient frontier. Envi-ronmental Modelling & Software, 71: 46–59.
Bonfiglio A., Arzeni A., Bodini A. (2017): Assessing the eco-efficiency of arable farms in rural areas. Agricultural Sys-tems, 151: 114–125.
Annals of the Constantin Brâncuşi University of Târgu Jiu, Economy Series, 2016: 50–57.
Chung-Hsing Yeh D.H., Willis R.J. (2000): Inter-compa-ny comparison using modified TOPSIS with objective weights. Computers & Operations Research, 27: 963–973. Coelli T.J., Prasada Rao D.S. (2005): Total factor produc-tivity growth in agriculture: a Malmquist index analysis of 93 countries, 1980–2000. Agricultural Economics, Sup-plement 1, 32: 115–134.
Czyżewski B., Matuszczak A., Muntean A. (2018):Influence
of agricultural policy on the environmental sustainability of European farming. Journal of Environmental Protection and Ecology, 19: 426–434.
Czyżewski B., Przekota G., Poczta-Wajda A. (2017): The inci-dence of agricultural policy on the land market in Poland: Two-dimensional and multilevel analysis. Land Use Policy, 63: 174–185.
Diakoulaki D., Mavrotas G., Papayannakis L. (1995): Deter-mining objective weights in multiple criteria problems: The critic method. Computers & Operations Research, 22: 763–770.
EUFADN (2018): European Union Farm Accountancy Data Network. Available at http://ec.europa.eu/agriculture/ rica/ (accessed April 5, 2018).
EUFADN Poland (2017): European FADN organization, Poland. Available at http://fadn.pl
Figge F., Hahn T. (2005): The cost of sustainability capital and the creation of sustainable value by companies. Journal of Industrial Ecology, 9: 47–58.
Gadanakis Y., Bennett R., Park J., Areal F.J. (2015): Evaluat-ing the sustainable intensification of arable farms. Journal of Environmental Management, 150: 288–298.
Gómez-Limon J.A., Picazo-Tadeo A.J., Reig-Martínez E. (2012): Eco-efficiency assessment of olive farms in Anda-lusia. Land Use Policy, 29: 395–406.
Hayati D., Karami E. (1996): A proposed scale to measure sustainability at the farm level in socio-economic studies. In: Proceedings First Agricultural Economic Conference of Iran, Zabol, Iran, April 5–7, 1996.
Illge L., Hahn T., Figge F. (2008): Applying and extending the sustainable value method to agriculture – an overview.
In: Proceedings 12th Congress of the European Association
of Agricultural Economists – EAAE 2008, EAAE, Ghent, Belgium.
Kates R., Parris T.M., Leiserowitz A.A. (2005): What is sus-tainable development? Environment, 47: 9–21.
Kuosmanen T., Kortelainen M. (2005): Measuring eco-ef-ficiency of production with data envelopment analysis. Journal of Industrial Ecology, 9: 59–72.
Latruffe L., Diazabakana A., Bockstaller C., Desjeux Y., Finn J., Kelly E., Ryan M., Uthes S. (2016): Measurement
of sustainability in agriculture: a review of indicators. Stud-ies in Agricultural Economics, 118: 123–130.
Olper A. (2001): Determinants of Agricultural Protection: The role of democracy and institutional setting. Journal of Agricultural Economics, 52: 463–487.
Pérez Urdiales M., Lansink A.O., Wall A. (2016) : Eco-efficien-cy among dairy farmers: the importance of socio-economic characteristics and farmers’ attitudes. Environmental and Resource Economics, 64: 559–574.
Picazo-Tadeo A.J., Gómez-Limón J.A., Reig-Martínez E. (2011): Assessing farming eco-efficiency: a data envelop-ment analysis approach. Journal of Environenvelop-mental Man-agement, 92: 1154–1164.
Picazo-Tadeo A.J., Beltran-Esteve M., Gomez-Limon J.A. (2012): Assessing eco-efficiency with directional distance functions. European Journal of Operational Research, 220: 798–809.
Poczta-Wajda A., Poczta J. (2016): The role of natural condi-tions in qualified agritourism – the case of Poland. Agri-cultural Economics – Czech, 62: 167–180.
Reytar K., Hanson C., Henninger N. (2014): Indicators of Sus-tainable Agriculture: a Scoping Analysis. Working Paper, Installment 6 of Creating a Sustainable Food Future. World Resources Institute, Washington, DC. Available at http:// www.worldresourcesreport.org (accessed April, 2014). Saltiel J., Baunder J., Palakovich S. (1994): Adoption
of sus-tainable agricultural practices: diffusion, farm structure and profitability. Rural Sociology, 59: 333–347.
Schaltegger S., Sturm A. (1990): Ökologische Rationalität. Ansatzpunkte zur Ausgestaltung von ökologieorientierten Managementinstrumenten. Die Unternehmung, 44: 273–290.
Schaltegger S. (1996): Corporate Environmental Account-ing. Wiley.
Stoate C., Baldi A., Beja P., Boatman N.D., Herzon I., van Doorn A., de Snoo G.R., Rakosy L., Ramwell C. (2009):
Ecological impacts of early 21st century agricultural change
in Europe – a review. Journal of Environmental Manage-ment, 91: 22–46.
WBCSD (2000): World Business Council for Sustainable Development Eco-Efficiency Facilities: Available Internet: Creating More Value with Less Impact. WBCSD. van Passel S., Nevens F., Mathijs E., van Huylenbroeck G.
(2007): Measuring farm sustainability and explaining dif-ferences in sustainable efficiency. Ecological Economics, 62: 149–161.