Bubble Impingement and the Mechanisms of Heat Transfer
D.B. Donoghuea, A. Albadawib, Y.M.C. Delaur´eb, A.J. Robinsona, D.B. Murraya
aDepartment of Mechanical&Manufacturing Engineering, Trinity College Dublin, Ireland bSchool of Mechanical&Manufacturing Engineering, Dublin City University, Ireland
Abstract
Heat transfer augmentation resulting from the effects of two phase flow can play a significant role in convective cooling applications. To date, the interaction between a rising gas bubble impinging on a heated horizontal surface has received limited attention. Available research has focused on bubble dynamics and the associated heat transfer has not been reported. To address this, this study investigates the effect of a single bubble impinging on a heated horizontal surface. Local and time resolved heat transfer measurements have been performed for a died orifice to surface distance, with a bubble injection orifice of 1mmin diameter. Synchronized high-speed photography and infrared thermography have been utilized to investigate the path of the bubble and the associated heat transfer.
Keywords:
Rising bubble, Bouncing bubble, Local heat flow
1. Introduction
Fluid agitation and mixing ensuing from two phase flow has an important role to play in convective cooling applications. In some heat exchangers with two phase flow, vapour bubbles may sometimes impinge against the heat exchanger surface and this behaviour can di-rectly affect convective heat flow within the heat ex-changer (Atmane & Murray [1], Cornwell [2]). Investi-gations into this complex fluid structure interaction have only begun in recent years, most recently by Sato et al. [3]. Bubbly flows are not only confined to heat ex-changers, with bubbles being used for a variety of in-dustrial applications such as froth flotation water treat-ment processes and the production of aluminium foam for example.
Several studies have reported experimental results concerning impingement and subsequent bouncing of a single gas/vapour or liquid bubble on a wall in var-ious fluids [3–14]. Many of these authors investi-gated bubble impact against deformable surfaces, such as the interface between water and air, where coales-cence would most likely occur [3, 4, 6–8, 10], while the remaining authors have investigated the effect of a bubble bouncing against solid surfaces [5, 9, 12–14]. Tsao & Kock [5] observed the interaction between high
Email address:donoghdb@tcd.ie(D.B. Donoghue)
Reynolds number, moderate Weber number bubbles im-pacting solid walls. A glass plate was placed at the top of a glass column filled with water. An air bubble with a radius of about 0.5 – 1mmwas released from a nee-dle and rose to the surface under the action of buoyancy forces. Their analysis indicated that 95% of the kinetic energy contained within the bubble was converted to heat via viscous dissipation within the separation film and a part was transformed into surface deformation during the bubble collision with the solid surface.
Surface properties have a significant influence on bubble dynamics; hydrophilic and hydrophobic surface characteristics have been found to influence bubble mo-tion. Krasowska & Malysa [11] studied the influence of surface roughness of hydrophilic and hydrophobic plates on the kinetics of the bubble attachment. They found that the roughness of the hydrophobic surface is of importance for the kinetics of the bubble attachment. Similarly the degree of roughness directly affects the de-tachment time of the bubble.
Nomenclature
Cp specific heat capacity (J/kgK)
Re Reynolds number (Eq. 4)
S coordinate (m)
T temperature (k)
T∗ dimensionless temperature (Eq. 6)
UT terminal velocity (m/s)
V velocity (m/s)
a minor axis (m)
b major axis (m)
de equivalent diameter (m)
q00 heat flux (W/m2)
Greek Symbols
α thermal diffusivity (m2/s)
χ aspect ratio (Eq. 5)
δ surface thickness (m)
κ conductivity (W/mK)
µ viscosity (Pa.s)
ρ density (kg/m3)
τ time (s)
θ major axis orientation (◦)
Subscripts
∞ bulk fluid conditions
f foil
p paint
s test surface
x,y,z coordinate direction
The bouncing was found to be very dissipative, more than 80% of the energy being lost during the interaction with the wall. For bubble bouncing, the mechanisms re-sponsible for the loss of kinetic energy, as reported by Legendre et al. [9], are located in the surrounding fluid i.e. film drainage and fluid motion parallel to the solid wall. Fujasov´a-Zedn´ıkov´a et al. [13] studied the interac-tion of a small bubble with an immersed horizontal solid surface. The effect of a surfactant and surface proper-ties were investigated. They found that the presence of
α-terpineol in water decreased the bubble velocity and it was found to suppress the bubble’s rebound from the surface.
The phenomenon of heat transfer enhancement re-sulting from bubble motion near a wall is well estab-lished, with numerous studies being performed over the years [15–24]. Donnelly et al. [21] investigated the ef-fect of a single rising bubble near a heated vertical wall. The study highlighted two important parameters which were found to significantly enhance heat transfer from the surface: path orientation and bluffbody interactions due to the proximity from the surface, which is consis-tent with other studies [18, 20, 22, 23]. Path orienta-tion is linked to the periodic release of vortices [25, 26] and these vortices play a key role in convective heat transfer. These results helped explain an early study by Cornwell [2], who investigated the role of bubbly flow in boiling within a tube in a bundle. A significant increase in the heat transfer was observed for tubes ex-posed to bubbly flow. A particularly significant finding was that the bubbles rising from a lower tube could com-pletely suppress nucleation of new bubbles on an up-per tube signifying improved heat transfer. Later
Hous-ton & Cornwell [27], employed the same experimental technique as Cornwell [2] but instead of vapour bubbles, air bubbles were introduced into the system. They con-firmed that large scale mixing caused by bubbly-flow is a prominent mechanism of the heat transfer.
While sliding bubble heat transfer enhancement has received some attention in the open literature, imping-ing and bouncimping-ing against horizontal surfaces has not. Yan et al. [28] investigated bubbles impacting under a horizontal curved surface, which is in effect bouncing on a curved surface. They found that the bubbles tended to stick to the surface and cause a hot spot through local dry-out, inducing elevated temperatures, before grow-ing and slidgrow-ing away from the bottom of the cylinder. This was the first reputed study into the effect of a bub-ble impacting a surface. A similar study was performed by Atmane & Murray [1] who measured local heat flux variation due to vapour or air injected bubble motion.
The objective of this study is to experimentally in-vestigate the coupled convective heat transfer and bub-ble motion due to the effect of a single air bubble rising through water and impacting and bouncing on a heated horizontal surface. Specifically, the time varying con-vective heat flux distribution is quantified for a single bubble impact and bouncing event and the results ex-plained in terms of the bubble dynamics.
2. Experimental Apparatus
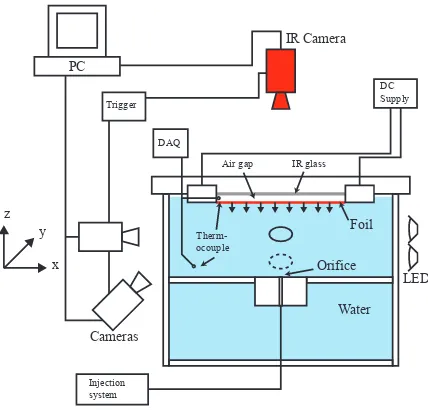
The experimental apparatus is shown in Fig. 1. It con-sists of a tank of 110×95×195mm3constructed from 3
placed at the top. The tank contains an adjustable bub-ble injection orifice, a controllabub-ble heated surface and a bulk water thermocouple. A high-speed infrared cam-era and two CCD camcam-eras are mounted directly above and horizontally at the sides of the test section respec-tively. To capture rapid movement of the bubble as it rises, high intensity lighting is required to enhance the outline of the bubble. This is provided by three high intensity light emitting diode (LED) strips mounted be-hind each camera. A diffusive screen is placed between the lights and glass tank to create a uniform light sheet. Two NAC Hi-Dcam II digital high-speed colour cam-eras are used in these experiments. Both high speed cameras give a spatial resolution of approximately 37
µm/pixel.
x y z
PC
Water
DC Supply
IR Camera
Cameras
Injection system
Foil
Trigger
DAQ
Therm-ocouple
IR glass
Orifice
LED
[image:3.595.313.524.119.178.2]Air gap
Figure 1: Experimental set-up. The High-speed cameras are orien-tated perpendicular to one another.
[image:3.595.68.282.313.518.2]A FLIR SC6000 high resolution, high speed infrared camera is used to capture spatial and temporal changes in the surface temperature during bubble impingement events. The camera has a 640×512 pixel focal plane array and an InSb 3-5 µm sensor which is vacuum sealed within the cooler assembly. For the present study, the field measured by the camera is an area measuring 34.6×34.6mm2, corresponding to a spatial resolution of 216 µm/pixel. All three cameras are set to record at a frequency of 1000Hz. This is achieved by means of a Thurlby Thandar TG300 series function generator which produces a square wave signal at a frequency of 1000Hz, which is fed directly to the IR camera. The IR camera is, in turn, connected to the PCI controller card
Table 1: Foil and paint properties.
Densityρf 8900kg/m3
Thermal conductivitykf 19.5W/mK
Specific heatCf 390J/kgK
Thermal diffusivityαp 1.7×10⁻⁷m2/s[29, 30]
for the high speed cameras. The IR camera has an ex-posure time of 0.85ms, while both high speed cameras have an exposure time of 0.5ms.
The bubble injection system is mounted on a mov-able platform, which allows the injection point to be ad-justed to varying distances from the test surface. For the present study the distance was 30mm. The injection orifice is a 1mmhole machined into an aluminium base which is connected to a Hamilton GASTIGHT 1002 2.5 mlsyringe by means of a 300mmlength of tube with a 0.5mminternal diameter. An accurate bubble injection rate is achieved by using a KD Scientific model 220 se-ries infusion pump set to an injection flow-rate of 100 ml/hrfor the present study.
The tank is filled with ultra-pure water, purified with a Millipore purification system. The water is maintained at a temperature of 22±0.5◦C.
The test surface consists of a metal foil, the lower side of which is in contact with the water while the up-per side is insulated by means of infrared transparent glass. The test surface is a 10µmthick Constantan Al-loy Cu55/Ni45 rolled foil supplied by Goodfellow Ltd. The foil is clamped between two busbars using silver based electrically conductive epoxy. The top side of the foil viewed by the IR camera is coated with matt black paint with an emissivity of 0.95. The thickness was de-termined to be 10.3±0.1µm. The foil and paint prop-erties are shown in Table 1.
The foil is insulated on the upper surface by a 3mm air gap. The air gap is maintained by a Calcium Flu-oride (CaF2), 1 mmthick IR transparent viewing win-dow. This polished glass window has a very high per-centage transmissibility, approximately 95% for a depth of 1mm.
x
y
z
θ
SZ Bubble
VZ(t)
[image:4.595.67.282.114.283.2]b a
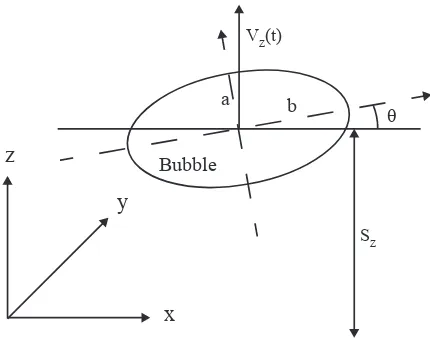
Figure 2: Schematic of the bubble, with a velocity ofVZin the vertical direction, withSZ being the height of the bubble’s centroid above the orifice. The variableθis the orientation of the major axisbwith respect to the horizontal.
in this investigation are discussed in terms of the pa-rameters: Terminal velocityUT, Reynolds numberRe, dimensionless surface temperatureT∗and bubble aspect ratio χ, where a andb are the minor and major axis lengths as depicted in Fig. 2. The above parameters are defined as follows,
q00conv=q
00
gen−q
00
cond−q
00
rad,total+
kfδf +kpδp ∂2T
∂x2 +
∂2T
∂y2 !
−
ρfC pfδf+ρpC ppδp ∂T
∂t (1)
q00gen=
V I Asur f
(2)
UT = q
V2
x+Vy2+Vz2 (3)
Re= ρUTde
µ (4)
χ=a
b (5)
T∗=Ts,i jτ=n−T∞ Ts, τ=0−T∞
(6)
whereTs,i jτ=nis the local surface temperature at a par-ticular timen,Ts, τ=0is the averaged surface
tempera-ture at the beginning of a test andT∞is the bulk water
temperature.
2.1. Uncertainty Analysis
The uncertainty in the convective heat flux due to the motion of the bubble and pursuing wake is evaluated utilizing an error propagation analysis on Eq. 1 as de-scribed by Coleman [33]. The uncertainty for each term in Eq. 1 has been evaluated in accordance with Kim et al. [34] at a confidence level of 95%. For both the lateral conduction and heat storage terms an additional term is added to the standard propagation equation for a multi-variable function, which is known as the co-variance term. In order to determine how correlated a pixel is to its neighbouring pixel and similarly to same pixel but with a time shift, both a cross-correlation and autocorrelation analysis was performed and used to de-termine the degree of correlation. The resulting uncer-tainty in the measured heat flux ranges from 12–21 %, with the maximum being at the highest convective heat flux level due to the additional error associated with the lateral conduction and thermal storage.
3. Results and Discussion
3.1. Bubble Dynamics
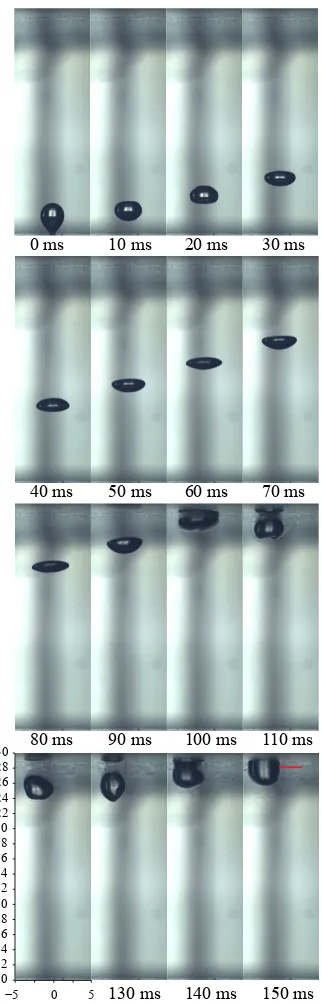
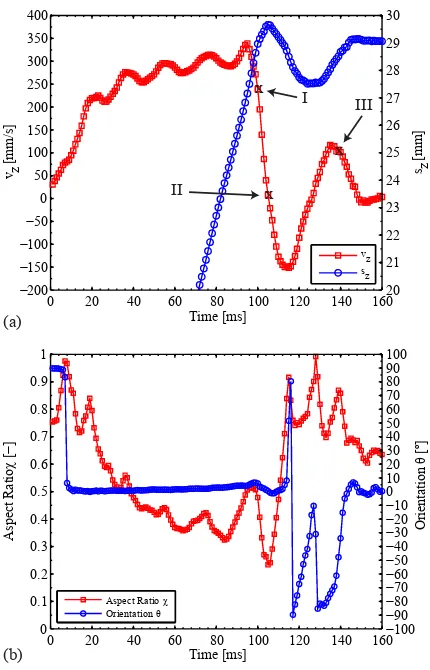
Once a bubble detaches from the orifice it begins to accelerate and rise through the bulk liquid. Fig. 3 il-lustrates a bubble detaching from a 1mmorifice before rising 30 mmto the horizontal surface. In this case it takes the bubble approximately 100 msto rise 30mm and impact the surface. The bubble’s centre of area is determined to be the centroid of a 2D area, while assum-ing a constant air density. The developassum-ing rise velocity and rise location versus time for this bubble sequence are shown in Fig. 4 (a). The equivalent bubble diam-eter for the current case is de =3.37 mm, which was determined by equating the volume of the bubble to that of a sphere. The maximum terminal velocity attained by the bubble isUT =333mm/s, with a corresponding Reynolds number ofRe=1453.
What is clear from Fig. 4 (a), is the large variation in the rise velocity following the bubble’s departure. Once the bubble departs the orifice, it follows a straight path for approximately 14 mm. This occurs at a time of around 60msin Fig. 3 and 4 (b) where the major axis orientation begins to change. Beyond this time the bub-ble begins to deviate from its straight vertical path in both thexandydirections. This directional change is evident in the way the major axis of the bubble tilts by a maximum of 10◦(illustrated in Fig. 4 (b) at a time of 90
0 ms 10 ms 20 ms 30 ms
40 ms 50 ms 60 ms 70 ms
80 ms 90 ms 100 ms 110 ms
130 ms 140 ms 150 ms
−5 0 5
[image:5.595.97.258.112.614.2]30 28 26 24 22 20 18 16 14 12 10 8 6 4 2 0
Figure 3: Sequence depicting the rise of a single bubble from a 1mm
orifice. All images are inmm, with the scale shown on the bottom left image. The red horizontal line shown at a time of 150ms, indicates the approximate location of the contact line.
the bubble retains this tilt until impact. The bubble’s vertical rise locationSZ, is shown in Fig. 4 (a) after a time of 70ms.
As the bubble rises, the velocity fluctuations (be-tween times 20 – 100ms) are linked to the deformation of the bubble. This is illustrated in Fig. 4 (b), where the aspect ratio varies from 0.35 to 0.95 in this period. These fluctuations indicate that the bubble is becoming flatter as it rises, which is also clear from the sequence in Fig. 3. The maximum rise velocity was found to oc-cur just prior to impact at 95ms.
Once the bubble impacts the surface (point I in Fig. 4 (a)), the bubble shape flattens considerably, with an as-pect ratio as low as χ ≈0.2. The surface tension en-ergy stored in the flattened bubble is partially released as the bubble springs back from the surface. During the rebound event the bubble aspect ratio increases to the region of χ ≈ 0.9, signifying a much more spherical bubble as depicted in Fig 3 fort=110ms. The bubble’s shape was found to oscillate quite significantly during its rebound from the surface.
When the bubble impacts the surface, a portion of its kinetic energy is converted into surface energy, while some is dispersed through viscous dissipation [5, 9, 12]. During the post impact recoil event, when the bubble is becoming more spherical and moving downward, the stored surface energy from the impact is converted to kinetic and potential energy as the bubble accelerates away from the surface. This recoil event is signified by an aspect ratio tending towards unity (Fig. 4 (a)) and a negative velocity (Fig. 4 (b)). The initial acceleration phase is followed by a deceleration phase to the point at whichVZ =0mm/swhenSZreaches a local minimum i.e. the bubble reaches its furthest distance from the sur-face during the bouncing phase. This occurs att≈130 msand at this moment the bubble is quite spherical as shown in the photograph in Fig. 3 as well asχ ≈1 in Fig. 4 (a). At this moment the bubble begins moving upward and accelerates towards the surface. This time, however, the rise velocity at the second impact (VZ ≈ 150mm/s) is much lower than the first impact (VZ≈350
mm/s) as the bubble had less distance to travel. In fact, when the bubble impacts the surface this second time, a triple contact line is immediately formed and the bubble is attached to the surface with no further rebound (point III in Fig. 4 (a)).
0 20 40 60 80 100 120 140 160 0
0.1 0.2 0.3 0.4 0.5 0.6 0.7 0.8 0.9 1
Time [ms]
Aspect Ratio
Ȥ>í@
í í í í í í í í í í 0 10 20 30 40 50 60 70 80 90 100
Orientation
ș
[º
]
Aspect Ratio Ȥ
Orientation ș
0 20 40 60 80 100 120 140 160
í í í í 0 100 200 300 400
Time [ms] v z
[mm/s]
20 21 22 23 24 26 27 28 29 30
s z
[mm]
vz sz
(a)
(b)
I III
II
x
x
x
Figure 4: (a) Centroidal rise velocity and rise location versus time corresponding to the image sequence depicted in Fig. 2. Only the rise height above 20mmis shown as this is the region of most interest and (b) eccentricity and major axis orientation.Iis the moment of impact,
IIis the moment when the bubble leaves the surface andIIIis the time at which a triple contact line forms signifying bubble attachment to the surface.
3.2. Bubble Rise, Impact and Bouncing Phases
In the present study the baseline convective heat flux i.e. for natural convection alone, wasq00 =7300W/m2 which resulted in a uniform and steady wall temperature of approximately 51◦C, for the duration of the experi-ment. By definition, the non-dimensional temperature distribution is initially equal to unity across the entire foil.
Figure 5 plots the maximum and minimum dimen-sionless wall temperature histories from the time at which the bubble was released from the orifice to the time at which the bubble is at rest on the surface. In-creases inT∗ are indicative of decreased heat transfer
whereas decreasingT∗ is indicative of improved heat
transfer. From Fig. 5, four regions have been identified
with regard to the coupling of the fluid mechanics and the heat transfer.
The first regime corresponds to heat transfer due to natural convection to water alone (I). This regime ex-tends from when the bubble departs from the orifice un-til the bubble impacts the heated surface. As mentioned, T∗is unity throughout the foil so thatT∗
max =Tmin∗ =1 during the bubble release and rise phase. The second regime extends from when the bubble has initially im-pacted the surface until it becomes attached to the sur-face (II). The third is relevant only for the maximum temperature on the surface of the foil (III); it com-mences when the bubble becomes attached and con-tinues until the slope of the temperature rise changes sharply. The final regime also starts at the same time as regime (III) and extends from when the bubble becomes attached to the surface until the point at which the foil has again reached steady state i.e. natural convection (IV). The present paper will focus on the effect of the bouncing bubble i.e. regime II.
100 101 102 103 104
0 0.2 0.4 0.6 0.8 1 1.2 1.4 1.6 1.8 2 2.2 2.4
Time [ms]
T*
[−] I II
III
[image:6.595.68.283.112.447.2]IV
Figure 5: Minimum surface temperature (solid – red) and maximum surface temperature (dashed – blue). (I) is the natural convection regime, (II) bouncing bubble dynamics, (III) maximum temperature beneath the attached bubble and (II-IV) the regime of shed vortices interaction with the surface heated surface.
[image:6.595.314.525.366.530.2]−5 −4 −3 −2 −1 0 1 2 3 4 5 −5 −4 −3 −2 −1 0 1 2 3 4 5
−5 −4 −3 −2 −1 0 1 2 3 4 5 −5 −4 −3 −2 −1 0 1 2 3 4 5
−5 −4 −3 −2 −1 0 1 2 3 4 5 −5 −4 −3 −2 −1 0 1 2 3 4 5
−5 −4 −3 −2 −1 0 1 2 3 4 5 −5 −4 −3 −2 −1 0 1 2 3 4 5
−5 −4 −3 −2 −1 0 1 2 3 4 5 −5 −4 −3 −2 −1 0 1 2 3 4 5
−5 −4 −3 −2 −1 0 1 2 3 4 5 −5 −4 −3 −2 −1 0 1 2 3 4 5
−5 −4 −3 −2 −1 0 1 2 3 4 5 −5 −4 −3 −2 −1 0 1 2 3 4 5
−5 −4 −3 −2 −1 0 1 2 3 4 5 −5 −4 −3 −2 −1 0 1 2 3 4 5 [mm] [−] 0.2 0.3 0.4 0.5 0.6 0.7 0.8 0.9 1
100 ms 106 ms 112 ms 118 ms
124 ms 130 ms 136 ms 142 ms
[image:7.595.79.513.116.344.2][mm]
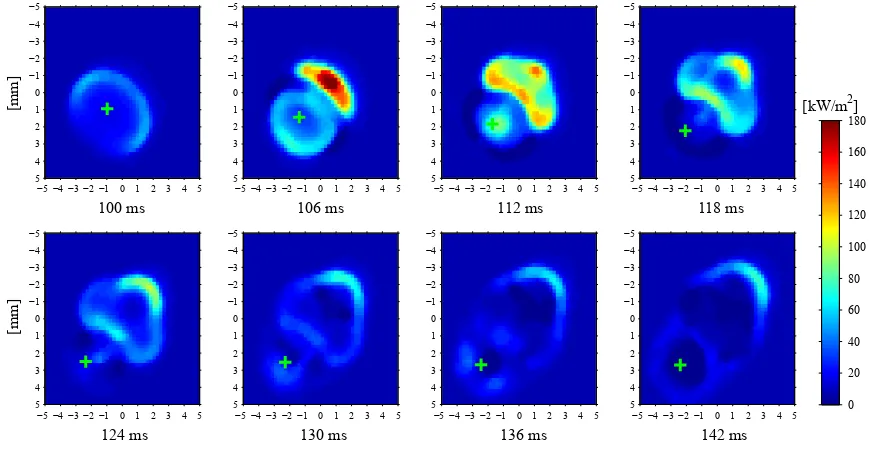
Figure 6: Sequence depicting the change is dimensionless temperature (T∗) due to the bubble motion. This sequence relates to regime II in Fig. 5. The green cross indicates the approximate location of the bubble’s centroid.
[kW/m2]
0 20 40 60 80 100 120 140 160 180
−5 −4 −3 −2 −1 0 1 2 3 4 5 −5 −4 −3 −2 −1 0 1 2 3 4 5
−5 −4 −3 −2 −1 0 1 2 3 4 5 −5 −4 −3 −2 −1 0 1 2 3 4 5 [mm]
100 ms 106 ms 112 ms 118 ms
124 ms 130 ms 136 ms 142 ms
[mm]
−5 −4 −3 −2 −1 0 1 2 3 4 5 −5 −4 −3 −2 −1 0 1 2 3 4 5
−5 −4 −3 −2 −1 0 1 2 3 4 5 −5 −4 −3 −2 −1 0 1 2 3 4 5
−5 −4 −3 −2 −1 0 1 2 3 4 5 −5 −4 −3 −2 −1 0 1 2 3 4 5
−5 −4 −3 −2 −1 0 1 2 3 4 5 −5 −4 −3 −2 −1 0 1 2 3 4 5
−5 −4 −3 −2 −1 0 1 2 3 4 5 −5 −4 −3 −2 −1 0 1 2 3 4 5
−5 −4 −3 −2 −1 0 1 2 3 4 5 −5 −4 −3 −2 −1 0 1 2 3 4 5
Figure 7: Sequence depicting the change in convective heat flux (q00conv) to the fluid due to the bubble motion. This sequence relates to regime II in Fig. 5 and the temperature sequence in Fig. 5. The green cross indicates the approximate location of the bubble’s centroid. The heat flux scale in this case is restricted to 0 – 180kW/m2for clarity.
defined by Eq. 6, from when the bubble first impacts the surface until bubble attachment to the surface. It is clear from Fig. 6 that the movement of the bubble (the
[image:7.595.78.513.401.628.2]The convective heat flux distributions corresponding to the temperature sequence in Fig. 6 are shown in Fig. 7. What is initially evident is the symmetry of the both plots (Fig. 6 and 7) within the bubble movement and the following wake of the bubble, if viewed at 45 degree angle, beginning at the bubble’s centroid.
The direct enhancement as a result of the bubble im-pacting the surface is quite limited in time, lasts for a mere 4 – 6ms(at a time of 106ms, Fig. 7) before be-ing dominated by the enhancement due to the fluid mo-tion in the vicinity of the bubble. Within the region of the bubble, visible at a time of 100ms, there is a clear variation in heat flux and temperature. The extremi-ties of the bubble convect more heat when compared to the centre of the bubble; this may be due primar-ily to cupping/dimpling of the bubble prior to impact. This dimpling phenomenon has been observed by Za-pryanov & Tabakova [35] and Tsao & Kock [5], and results from a viscous effect, trapping fluid between the deformable bubble and the rigid boundary. As the bub-ble approaches the surface, the bubbub-ble must displace fluid in order to rise; this results in higher pressure at the leading edge of the bubble, which has the effect of pushing fluid to regions of lower pressure.
3.3. Local Variation in Heat Flux and Temperature In order to evaluate the complex process of heat flow in the presence of a bubble impacting the surface, spe-cific locations of interest have been chosen. A time trace of heat flux and temperature at these points will be pre-sented in the following section.
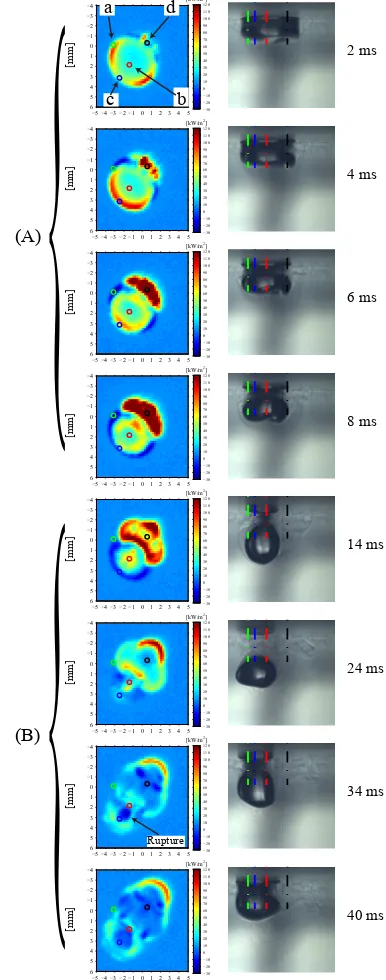
The four points chosen are at the rear, centre, front and edge of the bubble, when viewed at an angle of 45 degrees, at a point in time when the bubble has impacted the surface. These four points are highlighted in Fig. 8 witha (edge),b(centre), c(front) andd (rear), mark-ing their locations. The highlighted times in Fig. 8 and following figures, relate to the time after the bubble has impacted the surface at 100 ms. Each location corre-sponds to a single point in the temperature map and it can be seen from the sequence of images that the bub-ble moves with respect to these fixed locations.
The motion of the bubble can be separated into two sections (A and B) as illustrated in Fig. 8. Section A relates to the bubble impact and the beginning of its re-bound from the surface, while sectionB refers to the bouncing of the bubble, which is related to its rebound and secondary approach to the surface. As the bubble impacts the surface (section A) its outline can be in-ferred from the convective heat flux distribution shown in Fig. 8 at a time of 2ms. As the flattened bubble be-gins to recover its shape, the convective heat flux
distri-−5 −4 −3 −2 −101 2 3 4 5 −4 −3 −2 −1 0 1 2 3 4 5 6
[kW/m2]
−30 −20 −10 0 10 20 30 40 50 60 70 80 90 100 110 120
−5 −4 −3 −2 −101 2 3 4 5 −4 −3 −2 −1 0 1 2 3 4 5 6
[kW/m2]
−30 −20 −10 0 10 20 30 40 50 60 70 80 90 100 110 120
−5 −4 −3 −2 −101 2 3 4 5 −4 −3 −2 −1 0 1 2 3 4 5 6
[kW/m2]
−30 −20 −10 0 10 20 30 40 50 60 70 80 90 100 110 120
−5 −4 −3 −2 −101 2 3 4 5 −4 −3 −2 −1 0 1 2 3 4 5 6
[kW/m2]
−30 −20 −10 0 10 20 30 40 50 60 70 80 90 100 110 120
−5 −4 −3 −2 −101 2 3 4 5 −4 −3 −2 −1 0 1 2 3 4 5 6
[kW/m2]
−30 −20 −10 0 10 20 30 40 50 60 70 80 90 100 110 120
−5 −4 −3 −2 −101 2 3 4 5 −4 −3 −2 −1 0 1 2 3 4 5 6
[kW/m2]
−30 −20 −10 0 10 20 30 40 50 60 70 80 90 100 110 120
−5 −4 −3 −2 −101 2 3 4 5 −4 −3 −2 −1 0 1 2 3 4 5 6
[kW/m2]
−30 −20 −10 0 10 20 30 40 50 60 70 80 90 100 110 120
−5 −4 −3 −2 −101 2 3 4 5 −4 −3 −2 −1 0 1 2 3 4 5 6
[kW/m2]
−30 −20 −10 0 10 20 30 40 50 60 70 80 90 100 110 120 [mm] [mm] [mm] [mm] [mm] [mm] [mm] [mm] 2 ms 4 ms 6 ms 8 ms 14 ms 24 ms 34 ms 40 ms d c b a
{
{
(A) (B) RuptureFigure 8: Sequence depicting the impact of the bubble initially shown in Fig. 3. The times shown are related to points of interest in later figures. The left hand side figures are convective heat flux maps while the right hand side is the location of the bubble on the surface. Four points of interest are highlighted with coloured circles (heat flux map), while vertical lines are shown in the right hand images, highlighting the approximate location of the points on the surface.
varia-tion in convective heat flux is observed at the rear of the bubble (pointd).
During section B the bubble continues its rebound from the surface, bouncing approximately 2.5mmaway from the surface at a time of 24ms, before moving up-ward again. During this time, large variations in convec-tive heat flux occur at the rear of the bubble rather than within the bubble’s footprint, where only small varia-tions in convective heat flux occur. At a time of 34ms the bubble begins to attach to the surface and a triple contact line is formed which subsequently spreads until the bubble reaches its final equilibrium shape.
3.3.1. Point a
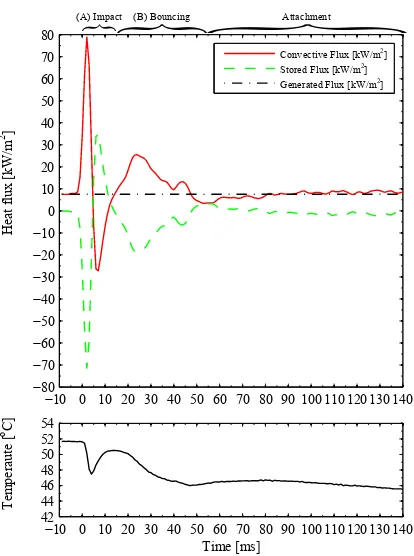
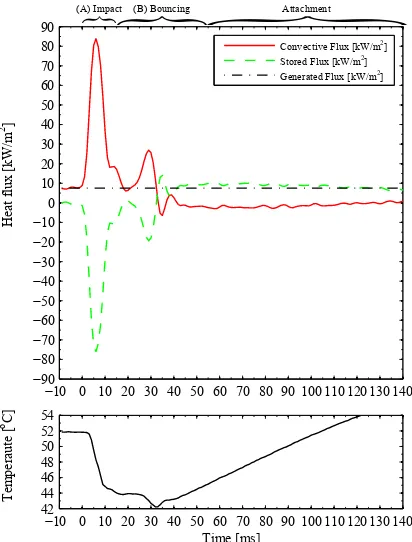
Fig. 9 illustrates the first point of interest, which is the point markeda in Fig. 8 at approximately (-3, 0) mm. Pointais at the edge of the bubble (at 45 degrees with respect to thexandyaxis) during the initial im-pact, although the bubble’s final resting position results in it being a fewmmaway from the bubble edge. The dashed black line in Fig. 9 indicates the heat flux as-sociated with the volumetric heat generation which is approximately equal to the convective heat flux over the entire field of view when no bubble is present. The solid red line is the bubble affected convective heat flux, while the dashed green line is the heat flux associated with the change in stored energy within the foil.
During the impact event (A) in Fig. 9 a large spike in convective heat flux is observed at a time of 2mswith a value approaching 80kW/m2; a corresponding drop in surface temperature is observed. The surface tempera-ture reaches a local minimum of 47.5◦C at 4ms, after
which the temperature increases again. Since the tem-perature is decreasing, so too is the energy storage term since it is this energy that allows the convective heat flux to increase significantly above the generated heat flux. At a time of 8msthe convective heat flux drops below zero to a value of approximately -27kW/m2. This would
indicate that the foil received a rapid input of heat, af-ter being a region of high cooling 6 ms earlier. The only significant source of warm fluid that could account for the rise in temperature is the thermal boundary layer and this will be discussed later. A secondary source of heat input is the air trapped within the 3mmgap above the foil, this will be shown to be significant at a spe-cific time and will be discussed later. At a time of 14 msthe surface temperature has reached a maximum and the convective heat flux has increased to the level of that generated within the foil. During this stage the storage term increases and becomes positive and larger than the generated heat flux which also indicates that additional
−10 0 10 20 30 40 50 60 70 80 90 100 110 120 130 140 −80
−70 −60 −50 −40 −30 −20 −10 0 10 20 30 40 50 60 70 80
Heat flux [kW/m
2]
Convective Flux [kW/m2]
Stored Flux [kW/m2]
Generated Flux [kW/m2]
−10 0 10 20 30 40 50 60 70 80 90 100 110 120 130 140
42 44 46 48
50
52 54
Time [ms]
Temperaute [
oC]
[image:9.595.313.520.115.393.2](A) Impact
{
(B) Bouncing{
{
AttachmentFigure 9: Time trace of heat flux and temperature at Pointa, shown in Fig. 8. Thexaxis time begins from when the bubble impacts the surface. The upper graph illustrates the change in surface heat flux, with the lower graph illustrating the change in surface temperature.
(a) (b)
(d) (c)
(A)
(B)
Figure 10: Sketches showing (a) the bubble approach (-4 – -2msprior to impact), (b) bubble initial rebound from the surface (2 – 4ms), (c) complete rebound from the surface (10 – 18ms) and (d) fluid flow during bubble’s second impact (28 – 32ms). The green circle indicates the approximate location of the current point of interest.
energy is transferred into the foil at this location from the liquid.
[image:9.595.315.528.467.584.2]This pressure gradient begins to move fluid within the thermal boundary layer. Fig. 10 (a) illustrates the ap-proaching bubble, which is believed to push cold fluid towards the warm surface, while the warm boundary layer makes way. Initially the thermal boundary layer was estimated to have an approximate thickness of 2 mm, while during the initial impact this could be re-duced to 4 – 8µm [36, 37]. The bubble is not directly in contact with the surface, this film layer separates them and the boundary layer thinning is what causes the large increase in the convective heat transfer with the associ-ated drop in temperature. At the time of 4ms, the first edge of the bubble to impact the surface begins to re-bound (Fig. 10 (b)). As the bubble pulls away from the surface, due to mass conservation, fluid must replace the space which was previously occupied by the bubble. As the bubble rebounds the gap between the surface and the bubble remains quite small, thereby only allowing the developed thermal boundary layer access to the pre-viously cooled surface as depicted by Fig. 10 (b). The hot fluid, being warmer than the cooled surface, causes the negative convective heat flux observed in Fig. 9.
During the initial phase of the bouncing event (B) in Fig. 9 the convective heat flux once again increases to above that of the generated heat flux. The enhanced convective cooling draws on energy stored within the foil causing the temperature to decrease with an associ-ated reduction in the stored energy. At a time of 24ms the convective heat flux reaches a local maximum after which it reduces, seemingly tending towards the gener-ated heat flux. However, a small inflection is observed at t=34msfollowed by a small secondary peak; this precedes an asymptotic decrease to approximately that of the generated heat flux. During this final phase the storage term decreases to zero as the temperature pro-file plateaus.
Fig. 10 (B) illustrates the salient features of the bub-ble bouncing event and coincides with the images in Fig. 8 (B). Initially, between 14ms≤t≤24ms, the bub-ble is moving downward away from the surface (Fig. 10 (B) (a)) with a maximum velocity of 150mm/s. As the bubble moves cold fluid rushes in to replace the volume occupied by the bubble and this fluid motion is what causes the increasing and positive convective heat flux observed in Fig. 9 during this time period. At t≈24 ms the bubble reaches its maximum bounce distance away from the surface; this roughly corresponds with the local maximum in the convective heat flux. Since the fluid motion and associated mixing disrupt the ther-mal boundary layer and the fluid motions subsequently dissipate, there is a phase of decreasing convective heat flux. This is likely due to the re-growth of the
ther-mal boundary layer whereby its thickness increases with time. This, in turn, increases its effective thermal resis-tance.
At t≈34msa small inflection in the convective heat flux profile is observed. From close inspection of the video and thermal images this inflection is caused by the rupture of the bubble forming the triple contact line with the surface. This is identified in Fig. 8 and is char-acterized by a region of low convective heat flux where there exists a dry patch beneath the foil. Once the triple contact line is formed it begins to spread radially out-ward causing a ring-shaped region of enhanced convec-tion around the rim of the bubble with a circular region of low convective heat flux within the interior. This is clearly visible in the last image in Fig. 8 and is the mech-anism responsible for the secondary peak in the convec-tive heat flux which occurs at t≈44mssince Point (a) is located outside of the bubble after it reaches its fi-nal resting position. In this regard, since Point (a) ex-ists outside of the bubble perimeter the convective heat flux asymptotically approaches the generated heat flux as the fluid motions dissipate with some small undula-tions. These are likely to be due to fluid motions in-duced by the bubble as surface tension forces draw its shape from a distorted 3D shape to a spherical 2D equi-librium shape.
3.3.2. Point b
As depicted in Fig. 8, Point (b) is located roughly above the centre of the bubble when it first impacts the surface. Compared with Point (a) which is located at the edge of the bubble, it is clear from the sequence of images in Fig. 8 that the convective heat transfer char-acteristics of Point (b) are notably different.
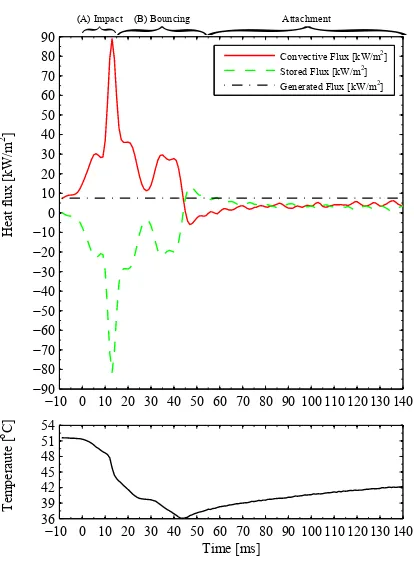
In a similar manner to Fig. 9, Fig. 11 shows the tem-poral variation of the generated, convective and storage heat fluxes along with the surface temperature associ-ated with Point (b). Fig. 12 shows interpretive sketches of the impact event (A) and the subsequent bounce event (B) with the relative position of Point (b) indicated.
Prior to impact (t<0) the convective heat flux rises slowly; it subsequently increases at a notably higher rate at the time of impact. Even still, compared with that of Point (a) at the edge of the bubble, the rate of in-crease in the convective heat flux is lower for Point (b) at the time of impact up to an initial primary local max-imum at approximately t ≈ 4 ms, the time associated with the first impacting side of the bubble lifting from the surface. After this the convective heat flux increases sharply, reaching a peak heat flux of 90 kW/m2at t=13
−10 0 10 20 30 40 50 60 70 80 90 100 110 120 130 140 −90
−80 −70 −60 −50 −40 −30 −20 −10 0 10 20 30 40 50 60 70 80 90
Heat flux [kW/m
2]
Convective Flux [kW/m2]
Stored Flux [kW/m2]
Generated Flux [kW/m2]
−10 0 10 20 30 40 50 60 70 80 90 100 110 120 130 140
36 39 42 45 48
51
54
Time [ms]
Temperaute [
oC]
[image:11.595.68.275.114.396.2](A) Impact
{
(B) Bouncing{
{
AttachmentFigure 11: Time trace of heat flux and temperature at Pointb, shown in Fig. 8. Thexaxis time begins from when the bubble impacts the surface. The upper graph illustrates the change in surface heat flux, with the lower graph illustrating the change in surface temperature.
(a) (b)
(d) (c)
(A)
(B)
Figure 12: (a) Schematic of fluid flow during impact (-2 to 2ms), (b) during retraction from the surface (˜10ms), (c) dimple inversion (11 – 13ms) and (d) side flow of fluid due to vortices (18 – 20ms). The red circle indicates the approximate location of the current point of interest.
(a) in the sense that the peak heat flux at the centre of the bubble is 10% higher and occurs at the end of the impact event, as opposed to at the beginning. This will be discussed in the next section.
Fig. 12 (a) shows a sketch of the bubble shape as
de-rived from close inspection of the high speed videos. As shown, when the bubble impacts the surface cup-ping occurs which traps liquid between the bubble and the heated surface. The thermal boundary layer during the bubble’s approach is quite thick (2mm), while the approximate depth of the cupping, measured prior to impact, is >0.5 mm. The fluid contained within the cupped bubble is now comprised of both hot and cold fluid collected during the cupping process and this acts to insulate the surface from direct contact with the bub-ble. As compared to Point (a), there is less thinning of the boundary layer and as a result the initial peak in the convective heat transfer is less for Point (b). However, as the bubble bounces and rebounds from the surface, as depicted in Figs. 12 (b) and (c), it seeks to recover its spherical shape from the initial disk-like shape upon impact. This causes the dimple to invert as shown in Fig. 12 (c). This inversion process pushes the cold fluid contained within the dimple towards the surface and may explain the sharp increase in heat transfer. Simi-lar to Point (a), the increased convective heat flux draws more energy than is generated in the foil. This causes decrease in the storage heat flux and an associated de-crease in the local temperature.
Recall for Point (a) at the edge of the bubble, the wall temperature was found to increase shortly after the ini-tial spike in heat flux due to heat being added to the foil by generation and convection. This is not the case at the centre of the bubble where the convective heat flux remains positive and above the generated heat flux so that the temperature at Point (b) continually decreases. This occurs at the beginning of the bouncing event (14 ms≤t≤24ms) as the bubble is moving away from the surface and approaches a local minimum in the convec-tive heat flux at t≈24ms, the time when the bubble is furthest from the surface. The small inflection in the convective heat flux is believed to be due to the interac-tion between the bouncing bubble, moving away from the surface, and the wake that was generated behind the bubble during the initial bubble approach to the surface. Fig. 12 (d) illustrates the movement of fluid on the right hand side of the bubble at a time of between 18 to 28 ms. This moving fluid originated from the wake of the impacting bubble and mixes with the wake formed by the bubble as it rebounds from the surface and contains a mixture of cool and warm fluid. This enhanced mix-ing causes the rate at which the convective heat flux de-creases to slow down somewhat.
[image:11.595.69.281.474.586.2]bubble ruptures and the triple contact line spreads caus-ing a short phase of high convective heat flux since Point (b) is outside of the initial rupture region (see Fig. 8). As the triple contact line spreads, Point (b) eventually be-comes covered in gas and this causes a rapid drop in the convective heat flux to below the generated heat flux. In fact, upon close inspection of Fig. 11, the convec-tive heat flux becomes slightly negaconvec-tive at t ≈48 ms and associated with this the storage heat flux becomes larger than the generated heat flux. This suggests that additional heat, over and above that being generated, is being supplied to heat the foil. Since at this moment in time Point (b) is located inside the extremities of the bubble, it cannot be due to warmer liquid underneath the foil. This effect is in fact due to the heated air on the top side of the foil trapped between the foil and the IR glass supplying heat to the foil.
Subsequent to this event the convective heat flux once again rises to a positive value as the foil temperature rises above that of the air in the gap. Here, when the convective heat flux is so low, it is not possible to disen-tangle the heat flux to the air in the gap from that to the bubble; this is a minor shortcoming of the test facility. Once the bubble is stationary on the surface it assumes a near hemispherical shape, although not shown here.
3.3.3. Point c
The third point of interest is Point (c). As depicted in Fig. 8, this point is located at the front edge of the bub-ble during its impact stage and roughly in the centre of the bubble when it is attached to the surface subsequent to the second impact stage.
Referring to Fig. 13 it is seen that during the initial impact there is a spike in convective heat flux which is similar in magnitude to that of Point (a) shown in Fig. 9, although with a delay of approximately 4msi.e 6 ms after impact. The delay in the initial spike is due to the right hand side (if viewed at an angle of 45 degrees) of the bubble impacting first, followed by the left, such that Point (c) is on the side which impacts last.
Similar to the other two points discussed above the rapid increase in the convective heat flux draws on en-ergy stored within the foil and thus causes the magni-tude of the storage heat flux term to increase with an associated decrease in the wall temperature. Between 6 – 14ms, Fig. 13 shows a decrease in the convective heat flux and, associated with this, a reduction in the rate at which the wall temperature decreases. Interestingly, compared with Point (a) which is also located near the edge of the bubble, the convective heat flux does not drop below zero which indicates that the way in which
−10 0 10 20 30 40 50 60 70 80 90 100 110 120 130 140 −90
−80 −70 −60 −50 −40 −30 −20 −10 0 10 20 30 40 50 60 70 80 90
Heat flux [kW/m
2]
Convective Flux [kW/m2]
Stored Flux [kW/m2]
Generated Flux [kW/m2]
−10 0 10 20 30 40 50 60 70 80 90 100 110 120 130 140
42 44 46 48
50
52 54
Time [ms]
Temperaute [
oC]
[image:12.595.313.519.119.390.2](A) Impact
{
(B) Bouncing{
{
AttachmentFigure 13: Time trace of heat flux and temperature at Pointc, shown in Fig. 8. Thexaxis time begins from when the bubble impacts the surface. The upper graph illustrates the change in surface heat flux, with the lower graph illustrating the change in surface temperature.
the bubble deforms during the impact event makes the heat transfer very specific to the location.
Similar to the trend observed for Point (b), when the bubble begins its rebound away from the surface at t
=14ms, there is a notable inflection in the convective heat flux for Point (c) and this is believed to be caused by the bubble recovering its shape as depicted in Fig. 12 (c). As the bubble moves downward away from the sur-face the convective heat flux decreases to approximately that of the generated heat flux and the wall temperature plateaus.
dis-cussed previously this is due to the warm air above the foil heating the cool surface slightly.
Once the bubble is fully attached to the surface, the surface temperature immediately increases sharply. This temperature increase is a result of the surface be-ing in direct contact with the air within the bubble. The convective heat transfer to the bubble is close to zero whilst the storage heat flux term is comparable to that of the generated heat flux and as a result, the surface temperature increases.
3.3.4. Point d
−10 0 10 20 30 40 50 60 70 80 90 100 110 120 130 140 −220
−200 −180 −160 −140 −120
−100−80
−60 −40
−200
20 40 60 80 100 120 140 160 180 200 220
Heat flux [kW/m
2]
Convective Flux [kW/m2]
Stored Flux [kW/m2]
Generated Flux [kW/m2]
−10 0 10 20 30 40 50 60 70 80 90 100 110 120 130 140
24 29 34 39 44 49 54
Time [ms]
Temperaute [
oC]
[image:13.595.68.275.278.563.2](A) Impact
{
(B) Bouncing{
{
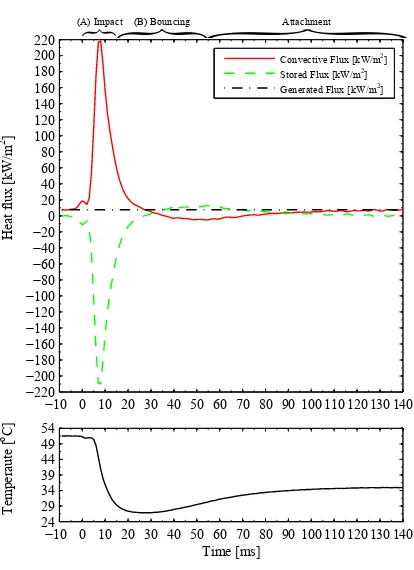
AttachmentFigure 14: Time trace of heat flux and temperature at Pointd, shown in Fig. 8. Thexaxis time begins from when the bubble impacts the surface. The upper graph illustrates the change in surface heat flux, with the lower graph illustrating the change in surface temperature.
The last point of interest is Point (d). As depicted in Fig. 8, this point is located at the first impacting edge of the bubble during its impact stage and is far outside of the bubble when it is attached to the surface subse-quent to the second impact stage. As the sequence in Fig. 8 shows, the region where Point (d) is located expe-riences a markedly different convective heat flux history compared with the other regions.
Fig. 14 illustrates the heat transfer characteristics as-sociated with Point (d) as well as the temperature at that point. At a time of t=0ms, when the bubble has just impacted the surface, there is a small rise in convective flux, which is similar to the trend at Point (b). At t≈2 msthe bubble at Point (d) starts to lift from the surface and this is seen in the photographic images of Fig. 8 be-tween t=2msand t=14ms. As the bubble lifts it draws in cool fluid and this together with the associated mix-ing causes the convective heat flux to increase rapidly to a peak of 220kW/m2, which is over twice that of the other regions discussed. This being the case, the sur-face temperature at Point (d) drops notably lower than the others which have been considered. This is an im-portant effect since, when the bubble rebounds offthe surface, the heat flux decreases as viscous dissipation settles the fluid motions and the thermal boundary layer re-establishes itself. However, it is noted that the con-vective heat flux becomes mildly negative for nearly 50 ms subsequent to the second impact. Since Point (d) is located outside of the bubble, the negative heat flux cannot be due to the hot air above the foil, since the heat transfer coefficient to the air layer would be at least an order of magnitude lower than that to the liquid. As a result, this dip in convective heat flux to negative must be due to a negative temperature differential. This is a result of the intense cooling associated with the first impact event causing the temperature to drop to a point that, when fluid is forced over this region during the sec-ond impact, it is warmer than the surface causing heat to be added to the foil by convection. The fluid during the second impact is a mixture of hot boundary layer and cool bulk fluid. For t>80msthe convective heat flux once again becomes positive and approaches that of the generated heat flux. This is to be expected since it is far enough away from the bubble to be uninfluenced by its presence.
4. Conclusion
It has been shown that once a bubble departs its growth orifice, it rapidly gains momentum and reaches a maximum terminal velocity of 333mm/sbefore impact-ing the solid surface. After the initial impact the bubble was found to rebound from the surface; for the present example only one rebound was observed. The bubble shape was found to vary quite significantly during its rise and even more so during its impact and rebound from the surface.
The effect that a single bouncing bubble has on the surface temperature was found to be significant, with its effect lasting as long as 8 seconds. This lasting effect was found to be related to the wake of the bubble fol-lowing its initial impact. However the main focus of this study is on heat transfer during the bubble impact and rebound processes. Once the bubble has impacted the surface a substantial variation in convective heat trans-fer occurred. This variation was found to be spatially symmetric, both within the confines of the bubble and the ensuing wake.
Within an area close to the bubble, substantial and rapid fluctuations in convective heat flux were observed. On some occasions negative heat flux was observed, in-dicating that warm liquid was momentarily in contact with the previously cooled surface. The fluid dimple formed during the bubble’s rise was found to initially retard enhancement, although during the bubble’s re-bound from the surface, the captured fluid was propelled due to the inversion of the bubble back to a spherical shape. Once the bubble has returned to the surface the next process occurs: rupture of the film separating the bubble from the surface. Once the bubble is fully at-tached, there is an immediate rise in the surface temper-ature within the confines of the bubble. Overall the bub-ble motion is found to enhance convective heat transfer quite significantly.
Acknowledgment
The authors acknowledge the technical support staff of the Mechanical and Manufacturing Engineering De-partment of Trinity College Dublin. The project is funded by Science Foundation Ireland (SFI) grant num-ber 09-RFP-ENM2151.
References
[1] M. A. Atmane, D. B. Murray, The effect of the liquid motion induced by air and vapor bubbles on heat transfer around a cylinder, International Journal of Heat and Mass Transfer 48 (6) (2005) 1084–1095.
[2] K. Cornwell, The influence of bubbly flow on boiling from a tube in a bundle, International Journal of Heat and Mass Trans-fer 33 (12) (1990) 2579–2584.
[3] A. Sato, M. Shirota, T. Sanada, M. Watanabe, Modeling of bouncing of a single clean bubble on a free surface, Physics of Fluids 23 (2011) 013307.
[4] R. Kirkpatrick, M. Lockett, The influence of approach velocity on bubble coalescence, Chemical Engineering Science 29 (12) (1974) 2363–2373.
[5] H. K. Tsao, D. L. Koch, Observations of high Reynolds number bubbles interacting with a rigid wall, Physics of Fluids 9 (1997) 44.
[6] M. Krzan, K. Lunkenheimer, K. Malysa, Pulsation and bouncing of a bubble prior to rupture and/or foam film formation, Lang-muir 19 (17) (2003) 6586–6589.
[7] M. Krasowska, M. Krzan, K. Malysa, Bubble collisions with hydrophobic and hydrophilic surfaces inα-terpineol solutions, Physicochemical Problems of Mineral Processing 37 (2003) 37– 50.
[8] K. Malysa, M. Krasowska, M. Krzan, Influence of surface ac-tive substances on bubble motion and collision with various in-terfaces, Advances in Colloid and Interface Science 114 (2005) 205–225.
[9] D. Legendre, C. Daniel, P. Guiraud, Experimental study of a drop bouncing on a wall in a liquid, Physics of Fluids 17 (2005) 097105.
[10] J. Zawala, M. Krasowska, T. Dabros, K. Malysa, Influence of bubble kinetic energy on its bouncing during collisions with var-ious interfaces, The Canadian Journal of Chemical Engineering 85 (5) (2007) 669–678.
[11] M. Krasowska, K. Malysa, Kinetics of bubble collision and at-tachment to hydrophobic solids: I. effect of surface roughness, International Journal of Mineral Processing 81 (4) (2007) 205– 216.
[12] R. Zenit, D. Legendre, The coefficient of restitution for air bub-bles colliding against solid walls in viscous liquids, Physics of Fluids 21 (2009) 083306.
[13] M. Fujasov´a-Zedn´ıkov´a, L. Vobeck´a, J. Vejrazka, Effect of solid material and surfactant presence on interactions of bubbles with horizontal solid surface, The Canadian Journal of Chemical En-gineering 88 (4) (2010) 473–481.
[14] D. Kosior, J. Zawala, K. Malysa, Influence of n-octanol on the bubble impact velocity, bouncing and the three phase contact formation at hydrophobic solid surfaces, Colloids and Surfaces A: Physicochemical and Engineering Aspects.
[15] D. B. R. Kenning, Y. Yan, Pool boiling heat transfer on a thin plate: features revealed by liquid crystal thermography, Interna-tional Journal of Heat and Mass Transfer 39 (15) (1996) 3117– 3137.
[16] G. E. Thorncroft, J. F. Klausner, R. Mei, An experimental in-vestigation of bubble growth and detachment in vertical upflow and downflow boiling, International Journal of Heat and Mass Transfer 41 (23) (1998) 3857–3871.
[17] G. E. Thorncroft, J. F. Klausner, The influence of vapor bub-ble sliding on forced convection boiling heat transfer, Journal of Heat Transfer 121 (1999) 73.
[18] D. Qiu, V. K. Dhir, Experimental study of flow pattern and heat transfer associated with a bubble sliding on downward facing in-clined surfaces, Experimental Thermal and Fluid Science 26 (6-7) (2002) 605–616.
[19] B. B. Bayazit, D. K. Hollingsworth, L. C. Witte, Heat transfer enhancement caused by sliding bubbles, Journal of Heat Trans-fer 125 (3) (2003) 503–510.
con-vection flow, Experimental Thermal and Fluid Science 27 (8) (2003) 911–926.
[21] B. Donnelly, T. S. O’Donovan, D. B. Murray, Bubble enhanced heat transfer from a vertical heated surface, Journal of Enhanced Heat Transfer 15 (2) (2008) 159–169.
[22] B. Donnelly, T. S. O’Donovan, D. B. Murray, Surface heat trans-fer due to sliding bubble motion, Applied Thermal Engineering 29 (7) (2009) 1319–1326.
[23] D. B. Donoghue, B. Donnelly, D. B. Murray, The enhancement effects of a plume of rising bubbles on natural convection from a heated vertical plate, Journal of Enhanced Heat Transfer 19 (4) (2012) 379–395.
[24] S. Manickam, V. Dhir, Holographic interferometric study of heat transfer to a sliding vapor bubble, International Journal of Heat and Mass Transfer 55 (4) (2012) 925–940.
[25] C. Br¨ucker, Structure and dynamics of the wake of bubbles and its relevance for bubble interaction, Physics of Fluids 11 (1999) 1781–1796.
[26] T. Sanada, M. Shirota, M. Watanabe, Bubble wake visualiza-tion by using photochromic dye, Chemical Engineering Science 62 (24) (2007) 7264–7273.
[27] S. Houston, K. Cornwell, Heat transfer to sliding bubbles on a tube under evaporating and non-evaporating conditions, Interna-tional Journal of Heat and Mass Transfer 39 (1) (1996) 211–214. [28] Y. Y. Yan, D. B. R. Kenning, I. A. Grant, K. Cornwell, Heat transfer to sliding bubbles under plane and curved surfaces, in: Institution of Mechanical Engineers Conference Publications, Vol. 2, Medical Engineering Publications Ltd, 1995, pp. 295– 295.
[29] I. Golobic, J. Petkovsek, M. Baselj, A. Papez, D. B. R. Kenning, Experimental determination of transient wall temperature distri-butions close to growing vapor bubbles, Heat and mass transfer 45 (7) (2009) 857–866.
[30] O. Raghu, J. Philip, Thermal properties of paint coatings on dif-ferent backings using a scanning photo acoustic technique, Mea-surement Science and Technology 17 (2006) 2945.
[31] J. Stafford, E. Walsh, V. Egan, Characterizing convective heat transfer using infrared thermography and the heated-thin-foil technique, Measurement Science and Technology 20 (2009) 105401.
[32] I. Golobic, J. Petkovsek, D. B. R. Kenning, Bubble growth and horizontal coalescence in saturated pool boiling on a titanium foil, investigated by high-speed IR thermography, International Journal of Heat and Mass Transfer 55 (4) (2012) 1385–1402. [33] H. Coleman, W. Steele, Experimentation, validation, and
uncer-tainty analysis for engineers, Wiley, 2009.
[34] J. Kim, T. Simon, R. Viskanta, Journal of heat transfer policy on reporting uncertainties in experimental measurements and re-sults, Journal of Heat Transfer 115 (1993) 5.
[35] Z. Zapryanov, S. Tabakova, Dynamics of bubbles, drops, and rigid particles, Vol. 50, Springer, 1999.
[36] M. H. Hendrix, R. Manica, E. Klaseboer, D. Y. Chan, C.-D. Ohl, Spatiotemporal evolution of thin liquid films during impact of water bubbles on glass on a micrometer to nanometer scale, Physical Review Letters 108 (24) (2012) 247803.