The Demand and Supply of
Engineers and Engineering
Technicians
A Study for the Expert Group on Future
Skills Needs
by
McIver Consulting
Final Report
May 2003
Foreword by Dr. Danny O'Hare,
Chairman, Expert Group on Future
Skills Needs
This report is submitted by the Expert Group on Future Skills Needs to Mary Harney, T.D., Tanáiste, and Minister for Enterprise, Trade ane Employment, and Noel Dempsey, T.D., Minister for Education and Science. The report was prepared as part of the ongoing work of the Expert Group in looking at the future skills needs of the Irish economy.
Ireland's economic development since the 1980s has been built in large part on its supply of engineering graduates. The Expert Group on Future Skills Needs fully recongises the importance of engineers and engineering to the Irish economy and believes the provision of engineering skills is critical to the competitiveness of the Irish economy. However, the Group has also publicly expressed its concerns regarding the falling numbers of individuals taking engineering courses at third level. Lack of awareness among second level students of the exciting career prospects and opportunities in the engineering profession has undoubtedly played a role in the decline. The STEPS Programme organised by the Insitution of Engineers of Ireland, together with the Expert Group's National Skills Awareness Campaign have made significant efforts to try to address this imbalance.
The aim of the current study was to identify the existing and anticipated mismatches between supply and demand for the engineering profession across all sectors of the economy. The report highlights the contribution of engineers to the economy in all sectors, from ICT to construction, pharmachem and medical devices. It quantifies gaps in the supply of engineers and engineering technicians across all engineering disciplines in these sectors, and identifies some important reasons for the short-fall in numbers within secondary level taking up engineering-related courses. The report makes important recommendations for government, state agencies, educational institutions, employers and the engineering profession to increase the take-up of engineering as a career by second level students and to increase the output of engineers and engineering technicians by the third level system.
On behalf of the Expert Group on Future Skill Needs, I would like to thank the Steering Group who guided the work and Catherine Kavanagh of Forfás who chaired the Steering Group and without whose dedicated management of the project this
publication would not have been possible. The findings of this study are important and I would encourage the speedy implementation of the recommendations it makes to ensure an adequate supply of engineering skills in the future.
Dr Daniel O'Hare Chairman
Expert Group on Future Skills Needs
s n ai ci n h
c eT
g ni
r
e
e
ni
g
n
E
&
sr
e
e
n
i
g
n
E
f
o
yl
p
p
u
S
d
n
a d
n
a
me
D
e
h
T
Foreword by Brian Kearney,
President IEI, 2002-2003
The strength of the Irish economy is based on visionary and what have proved to be very sound industrial development and allied education policies adopted by Government through the eighties.
These policies were aimed at making Ireland an attractive location for high technology international companies to set up and remain while also encouraging the establishment of a competitive indigenous technological sector. The success of these policies in growing the Celtic Tiger is in no small way a result of the availability of a pool of highly skilled engineering and technological personnel through the eighties and nineties. This pool of engineering expertise has also allowed the significant increase in infrastructure development required under the National Development Plan to be progressed.
However, we cannot afford to be complacent. The Annual Competitiveness Report 2002 paints a disturbing picture of Ireland's deteriorating performance in areas which involve investment in engineering - hard and soft infrastructure. The 2002 Report of the Task Force on the Physical Sciences paints an equally disturbing picture of a decline in interest in the physical science subjects at second level and in careers in science, engineering and technology.
Ireland's industrial and economic performance into the future and our ability to redress the current infrastructure deficit and to meet the challenges of the National Spatial Strategy, are dependent on the availability over the coming decades of an adequate supply of appropriately qualified engineering professionals. The Institution of Engineers of Ireland therefore welcomes the Report by the Expert Group on Future Skills Needs on the Demand and Supply of Engineers and Engineering Technicians in the Irish Economy. It will be an invaluable reference for those charged with formulating policy in the education sector, for third level institutions and for human resource personnel in the private sector. I congratulate the Expert Group on Future Skills Needs on the production of such a comprehensive and much needed Report and strongly urge that its
recommendations be implemented in full.
Brian Kearney Chartered Engineer President 2002-2003
The Institution of Engineers of Ireland
Contents
The Demand and Supply of Engineers and Engineering Technicians
List of Tables and Figures iv
Executive Summary viii
Chapter 1 Introduction, Context and Methodology
1.1 Introduction 1
1.2 Role of Engineers and Engineering Technicians 1
1.3 Irish Industrial Development and its Consequences 3
1.4 The Engineering-Intensive Industries that Have Contributed 4
1.5 Engineering Graduate Output 7
1.6 Future of Irish Industry 8
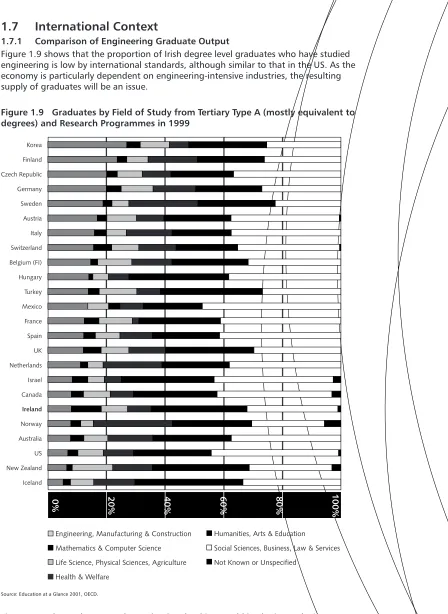
1.7 International Context 10
1.8 Careers of Engineers 14
1.9 Methodology 15
Chapter 2 Literature Review 22
2.1 Introduction 22
2.2 Previous Reports of the Expert Group on Future Skills Needs 22
2.3 Reports by the Institution of Engineers of Ireland 24
2.4 Report of Task Force on the Physical Sciences 26
2.5 A Sample of International Engineering Skills Studies 27
2.6 Reports from International Engineering Institutions 28
2.7 Key Conclusions from Literature Review 29
Chapter 3 Demand Analysis 30
3.1 Introduction 30
3.2 Industries Employing Engineers and Engineering Technicians 31
3.3 Current State of Demand for Engineering Graduates 37
3.4 Demand from ICT Sectors 38
3.5 Demand from Construction-Related Industries 59
3.6 Demand from Medical Devices and Pharmaceutical/Chemical
Industries 66
3.7 Rest of Economy 72
3.8 Summary Projections for Total Economy 74
3.9 Demand for Higher Degree Graduates 76
Chapter 4 Supply Analysis 77
4.1 Introduction 77
4.2 History of Supply of Engineers 77
4.3 Supply for the Immediate Future 77
4.4 First Destination of Award Recipients Analysis 79
4.5 Estimating Availability of Graduates to Employers 81
4.6 Projections of Supply of New Graduates Available to Industry 82
4.7 Longer Term View of Supply of Graduates 83
4.8 Part-Time and Other Non-Standard Programmes 95
4.9 Supply-Side Measures by Employers 95
4.10 Conclusions on Supply 97
Chapter 5 Gap Analysis 98
5.1 Introduction 98
5.2 Supply Scenarios 98
5.3 Balance Between Projected Supply and Projected Demand 101
5.4 Sensitivity to Sectoral Outcomes 103
5.5 Immigration as a Means of Balancing Supply and Demand 103
5.6 Policy Implications of Gap Analysis 104
Chapter 6 Conclusions & Recommendations 105
6.1 Introduction 105
6.2 Promoting Study of Engineering to Second Level Students 106
6.3 Actions at Third Level 110
6.4 Mature Students and Lifelong Learning 112
6.5 Immigration 113
6.6 Statistics 114
Appendix A - Statistical Appendix 115
Appendix B - Expert Group on Future Skills Needs, List of Members 124 Appendix C - Reports Published by the Expert Group on Future Skills Needs 125 Appendix D - Engineering Professionals Study, Steering Group List of Members126 s
n ai ci n h
c eT
g ni
r
e
e
ni
g
n
E
&
sr
e
e
n
i
g
n
E
f
o
yl
p
p
u
S
d
n
a d
n
a
me
D
e
h
T
List of Figures and Tables
Table E.1 Total Projections of Engineering Graduate Numbers for Whole
Economy x
Table E.2 Overall Balance Between Supply and Demand Under Two Supply
Scenarios xi
Figure 1.1 Growth in Real GDP 3
Figure 1.2 Growth in Labour Productivity 3
Table 1.3 Comparative Data on Performance of Irish Economy 4
Figure 1.4 Irish Unemployment Rate (%) 4
Figure 1.5 Employment by Industry in Ireland (000s), 1977 and 1983 to
2001 5
Figure 1.6 Recruitment of New Primary Degree Engineering Graduates by Irish
Employers Classified by HEA Industry Sector Graduates of '91
to '00 6
Table 1.7 Engineering Graduate Numbers to 2000 8
Figure 1.8 Disciplinary Mix of Primary Degree Graduates, 1982 to 2000 8
Figure 1.9 Graduates by Field of Study from Tertiary Type A (mostly equivalent
to degrees) and Research Programmes in 1999 10
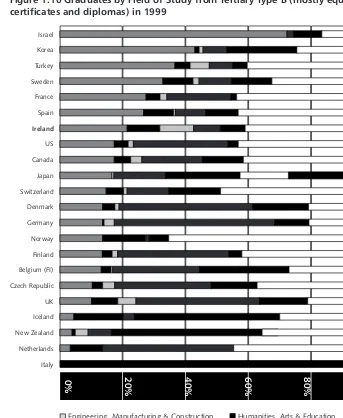
Figure 1.10 Graduates by Field of Study from Tertiary Type B (mostly equivalent
to certificates and diplomas) in 1999 11
Figure 1.11 % of Primary Degree Engineering Graduates Going to Study or
Work Outside Ireland 13
Table 2.1 Annual Average Demand and Supply of Third Level Skills in
Information Technology, 2001 2005, from Third Report of
Expert Group 23
Figure 3.1 Recruitment of New Primary Degree Graduates by Irish Employers
Classified by HEA Industry Graduates of 1991 to Graduates of 2000 32
Figure 3.2 Recruitment of New Higher Degree Graduates by Irish Employers
Classified by HEA Industry Graduates of 1991 to Graduates of 2000 32
Figure 3.3 Recruitment of New Dip and Cert Graduates by Irish Employers
Classified by HEA Industry Graduates of 1991 to Graduates of 2000 33
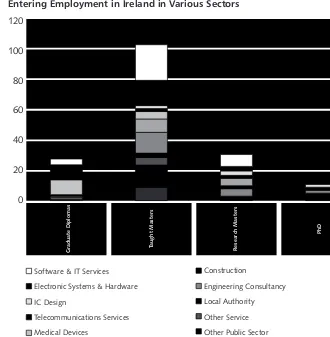
Figure 3.4 Estimates of Numbers of Primary Engineering Degree Graduates of
2000 Entering Employment in Ireland in Various Sectors. 34
Figure 3.5 Estimates of Numbers of Postgraduate Engineering Graduates of
2000 Entering Employment in Ireland in Various Sectors 35
Figure 3.6 Estimates of Percentages of Diploma Graduates Qualifying in 2000
Entering Employment in Ireland in Various Sectors 36
Figure 3.7 Estimates of Percentages of Certificate Graduates Qualifying in 2000
Entering Employment in Ireland in Various Sectors 36
Figure 3.8 Year-on-Year Growth in Employment in US SIC 737 Computer &
Data Processing Services Jan 1973 to Dec 2002 39
Figure 3.9 US Real GDP Growth (seasonally adjusted at annual rates) Q1
1990 to Q3 2002 40
Figure 3.10 US Non-Residential Fixed Private Investment (All and ICT) as % of
GDP Q2 1990 to Q3 2002 40
Figure 3.11 Share of US Non-Residential Fixed Private Investment Accounted
for by Information Processing Equipment & Software Q1 1990 to
Q3 2002 40
Figure 3.12 Employment in Irish Software and IT Services Industry 42
Table 3.13 Employment Projections for Irish Software and IT Services Industry 45
Table 3.14 Projections of Demand from the Software & IT Services Sector for
Engineers and Engineering Technicians (excluding Computer
Engineering) 45
Table 3.15 Projection of Demand from Software & IT Services Sector for
Engineering Degree Graduates, by Discipline 46
s n ai ci n h
c eT
g ni
r
e
e
ni
g
n
E
&
sr
e
e
n
i
g
n
E
f
o
yl
p
p
u
S
d
n
a
d
na me
D
e
h
T
Table 3.16 Projection of Demand from Software & IT Services Sector for
Diploma and Certificate Graduates, by Discipline 47
Figure 3.17 Employment in Irish Electronic Systems and Hardware* 48
Table 3.18 Employment Projections for Irish Electronic Systems and Hardware
Sector 50
Table 3.19 Projections of Demand from the Electronic Systems and Hardware
Sector for Engineers and Engineering Technicians 51
Table 3.20 Projection of Demand from Electronic Hardware & IC Production
Sector for Degree Graduates, by Discipline 51
Table 3.21 Projection of Demand from Electronic Hardware & IC Production
Sector for Diploma and Certificate Graduates, by Discipline 52
Figure 3.22 Employment in Irish IC Design Sector (excluding units associated
with production operations) 52
Table 3.23 Employment Projections for IC Design Sector (excluding units
attached to production operations) 53
Table 3.24 Projections of Demand from the IC Design Sector for Engineers and
Engineering Technicians 54
Table 3.25 Projection of Demand from IC Design Sector for Degree Graduates,
by Discipline 55
Table 3.26 Projection of Demand from IC Design Sector for Diploma and
Certificate Graduates, by Discipline 55
Table 3.27 Projections of Demand from the Telecommunications Services
Sector for Engineers and Engineering Technicians 56
Table 3.28 Projection of Demand from Telecommunications Services Sector
for Degree Graduates, by Discipline 57
Table 3.29 Projection of Demand from Telecommunications Services Sector for
Diploma and Certificate Graduates, by Discipline 57
Table 3.30 Projection of Demand from Total ICT Sector for Degree Graduates,
by Discipline 58
Table 3.31 Projection of Demand from Total ICT Sector for Diploma and
Certificate Graduates, by Discipline 58
Figure 3.32 Irish Construction Industry Employment 60
Figure 3.33 Recruitment of New Engineering Graduates by "Construction, Civil
Engineering" Industry and "Professional Services, Private Practice"
Industry* 60
Table 3.34 Construction Industry Employment Projection 61
Table 3.35 Projections of Demand from the Construction and Engineering
Consultancy Sector for Engineers and Engineering Technicians 62
Table 3.36 Projection of Demand from the Construction and Engineering
Consultancy Sector for Degree Graduates, by Discipline 62
Table 3.37 Projection of Demand from the Construction and Engineering
Consultancy Sector for Diploma and Certificate Graduates, by
Discipline 63
Table 3.38 Offers of Engineering Positions in Public Service 63
Table 3.39 Engineering Graduates of Years 1991 to 2000 Recruited by Local
Authorities 64
Table 3.40 Projections of Demand Local Authorities for Engineers and
Engineering Technicians 65
Table 3.41 Projection of Demand from Local Authorities for Degree Graduates,
by Discipline 65
Table 3.42 Projection of Demand from Local Authorities for Diploma and
Certificate Graduates, by Discipline 65
Table 3.43 Overall Graduate Recruitment by "Chemicals, Rubber, Plastics,
Pharmaceuticals, Healthcare" Industry 66
Table 3.44 Overall Recruitment of Primary Degree Graduates of 2000 by
"Chemicals, Rubber, Plastics, Pharmaceuticals, Healthcare" Industry 67
Figure 3.45 Employment in NACE (Rev 1) 331 (Manufacture of Medical and Surgical Equipment and Orthopaedic Appliances) and of NACE 37
(Instrument Engineering)* 67
Table 3.46 Employment Projections for Medical Devices Sector 68
Table 3.47 Projections of Demand from the Medical Devices Sector for
Engineers and Engineering Technicians 69
Table 3.48 Projection of Demand from the Medical Devices Sector for Degree
Graduates, by Discipline 69
Table 3.49 Projection of Demand from Medical Devices Sector for Diploma and
Certificate Graduates, by Discipline 69
Figure 3.50 Employment in NACE (Rev.1) 24 (Chemicals, Chemical Products &
Manmade Fibres), and its Predecessors NACE 25-26 70
Table 3.51 Employment Projections for Pharmachem Sector 71
Table 3.52 Projections of Demand from the Pharmachem Sector for Engineers
and Engineering Technicians 71
Table 3.53 Projection of Demand from the Pharmachem Sector for Degree
Graduates, by Discipline 72
Table 3.54 Projection of Demand from Pharmachem Sector for Diploma and
Certificate Graduates, by Discipline 72
Table 3.55 Projection of Demand from Rest of Economy for Degree Graduates,
by Discipline 73
Table 3.56 Projection of Demand from Rest of Economy for Diploma and
Certificate Graduates, by Discipline 73
Table 3.57 Projection of Demand from Total Economy for Engineering Degree
Graduates, by Discipline 74
Table 3.58 Projection of Demand from Total Economy for Engineering Diploma
and Certificate Graduates, by Discipline 75
Figure 3.59 First Destinations of Engineering Research Graduates of 2000 76
Table 4.1 Numbers of Engineering Graduates Employed in Ireland, graduating
1991 to 2000 77
Table 4.2 Projections of Full Time Primary Degree Level Engineering Graduate
Numbers (extending to the expected year of graduation of the first
years of academic year 2001/02) 78
Table 4.3 Projections of Full Time Diploma Level Engineering Graduate
Numbers (extending to the expected year of graduation of the first
years of academic year 2001/02) 79
Table 4.4 Projections of Full Time Certificate Level Engineering Graduate
Numbers (extending to the expected year of graduation of the
first years of academic year 2001/02) 79
Table 4.5 First Destinations of Primary Degree Engineering Graduates of 2000 80
Table 4.6 First Destinations of Higher Degree Engineering Graduates of 2000 80
Table 4.7 First Destinations of HETAC Diploma Engineering Graduates of 2000 81
Table 4.8 First Destinations of HETAC Certificate Engineering Graduates of
2000 81
Table 4.9 Assumed Rates of Availability to Irish Employers of Diploma and
Certificate Level Engineering Graduates 82
Table 4.10 Supply of Degree Level Engineering Graduates Available to Irish
Industry 82
Table 4.11 Supply of Diploma Level Engineering Graduates Available to Irish
Industry 83
Table 4.12 Supply of Certificate Level Engineering Graduates Available to Irish
Industry 83
Figure 4.13 Applications and Acceptances for Engineering / Technology
Certificate and Diploma Courses 84
Figure 4.14 Projection of Leaving Certificate Age Cohort 85
Table 4.15 Applications for Third Level Engineering / Technology Courses,
1992 - 2002 85
Table 4.16 Changes in First Preference Applications for Engineering and
Related Disciplines 2001-2002 86
Table 4.17 Changes in Degree Applications by Subject Area* 86
Table 4.18 Average Percentage Change in Applications from 2001 to 2002 for
Engineering Courses of Various Types, based on Responses to a
Survey of Colleges 87
Table 4.19 % of Students for Each Leaving Certificate* Subject Taking the
Subject at Higher Level 90
Figure 4.20 % of Students At or Above Each Level of CAO Points* from Each of
the "Compulsory" Leaving Certificate Subjects, 2000 90
Figure 4.21 Distribution of Grades for Each Leaving Certificate Compulsory
Subject Taken at Ordinary Level, 2000 91
Table 4.22 % of Students for Each Junior Certificate* Subject Taking the Subject
at Higher Level 93
Table 4.23 Number of Part Time Engineering Students in HEA-Funded
Institutions Academic Year 2000/2001 95
Table 4.24 Survey of Engineering Employers Responses to Question: Which of
the following measures have you used to cope with shortfalls in the supply of engineers and engineering technicians in the Irish Labour
market? 96
Table 4.25 Survey of Engineering Employers Responses to Question on
Upskilling 96
Table 4.26 Survey of Engineering Employers Responses to Question: "What is
the nature of any involvement your organisation has in upskilling
people for engineering or technician work?" 96
Table 5.1 Degree Level Graduate Supply Under Supply Scenario 1 98
Table 5.2 Diploma and Certificate Level Supply Under Supply Scenario 1 99
Table 5.3 Degree Level Graduate Supply Under Supply Scenario 2 99
Table 5.4 Diploma and Certificate Level Supply Under Supply Scenario 2 100
Table 5.5 Balance Between Supply and Demand for Degree Graduates 101
Table 5.6 Balance Between Supply and Demand for Engineering Diploma and
Certificate Graduates, by Discipline 102
Table A.1 Estimates of Numbers of Primary Engineering Degree Graduates of
2000 Entering Employment in Ireland in Various Sectors 115
Table A.2 Estimates of Numbers of Postgraduates Qualifying in 2000 Entering
Employment in Ireland in Various Sectors 116
Table A.3 Estimates of Percentages of Diploma Graduates Qualifying in 2000
Entering Employment in Ireland in Various Sectors 117
Table A.4 Estimates of Percentages of Certificate Graduates Qualifying in 2000
Entering Employment in Ireland in Various Sectors 118
Figure A.5 Recruitment of New Higher Degree Engineering Graduates by Irish
Employers Classified by HEA Industry Sector Graduates of 91 to 00 119
Figure A.6 Recruitment of New Diploma and Certificate Engineering Graduates
by Irish Employers Classified by HEA Industry Sector Graduates of
91 to 00 119
Figure A.7 Disciplinary Mix of Diploma & Certificate Graduates, 1982 to 2000 120
Figure A.8 % of Diploma Engineering Graduates Going to Study or Work
Outside Ireland 120
Figure A.9 % of Certificate Engineering Graduates Going to Study or Work
Outside Ireland 121
Figure A.10 Sources of Inflows into Professional Occupations ('000s) 121
Figure A.11 Sources of Inflows into Associate Professional Occupations ('000s) 122
Table A.12 Relationship between Change in Degree Applications for Courses
and Dependence on ICT Industries for Employment 122
Figure A.13 % of Leaving Certificate Mathematics Candidates Taking Higher
Level Paper 122
Table A.14 % of Candidates Taking Each Junior Certificate Subject*, 2000 123
s n ai ci n h
c eT
g ni
r
e
e
ni
g
n
E
&
sr
e
e
n
i
g
n
E
f
o
yl
p
p
u
S
d
n
a d
n
a
me
D
e
h
T
Executive Summary
E.1
Introduction
The Expert Group on Future Skills Needs commissioned this report to examine how the future supply of engineers and engineering technicians in Ireland will match the requirements of industry and public bodies. The report also makes recommendations on how to bridge any gaps that are likely to be significant.
The conclusions are based on the following research activities:
A survey of engineering employers. This informed the demand projections and provided information on continuing training activities;
Visits to all Irish third level institutions providing courses in engineering to undertake interviews with engineering academic staff, and group interviews with engineering students;
Interviews with a range of industry organisations and the industrial development agencies;
A collation of historical student and graduate statistics, sourced at course level from the Higher Education Authority (HEA), the Department of Education & Science, the Higher Education and Training Awards Council (HETAC), and supplemented with current data obtained by surveying colleges;
An analysis of anonymised data from the First Destination of Award Recipients databases held by the HEA and HETAC; and
Review of literature, and other relevant sources of data.
In looking to the future, the report attempts to envision how Irish industry may develop, focusing on industries that appear to have the greatest potential for growth, and which are significant employers of engineers and engineering technicians. The demand projections in the report indicate roughly how many engineers and engineering technicians will be required if the vision is realised.
Two main issues emerge from the analysis:
A fall in numbers entering electronic engineering has the potential to limit the growth of a range of ICT sectors once markets for ICT products and services recover from the current global economic slowdown; and
There is a threat of a general decline in numbers graduating in engineering, which may limit the potential of a much wider range of sectors.
In response, the report recommendations focus on boosting the numbers graduating in engineering from Irish education institutions.
E.2
Demand for Graduates
The report makes projections of demand for engineers and engineering technicians for each of the following industry sectors, disaggregated by discipline:
Software and IT Services;
Electronic Systems and Hardware;
Integrated Circuit Design;
Telecommunications Services;
Construction and Engineering Consultancy;
Local Authorities;
Medical Devices; and
Pharmachem.
Between them, these sectors employ more than 80% of engineers and engineering technicians who graduated in 2000. The report also makes demand projections for the rest of the economy.
The main issues reflected in the projections are the following.
The ICT sector has experienced its worst ever downturn. This has caused significant loss of employment and may cause significantly more losses before industry growth resumes. Projections are made on the basis that the upturn will begin before the end of 2003, with a positive impact on employment in 2004, and strong growth thereafter. The projections show demand for new graduate engineers and engineering technicians from the ICT sector being depressed in 2003, but recovering in 2004 and rising thereafter. The ICT sector employs graduates from all engineering disciplines, but is particularly dependent on graduates in electronic engineering.
It is assumed that the construction sector has come to the end of a period of very rapid growth, which was paralleled by a rapid rise in demand for engineers and engineering technicians, predominantly for civil engineers. It is projected that demand for civil engineers and technicians from the construction and engineering consultancy sectors will stabilise.
It is anticipated the pharmachem and medical devices sectors will continue to grow strongly with a progressively greater emphasis on research and
development work in Ireland. A significant part of this growth in both cases will be connected to the application of biotechnology. Continued growth will drive significant demand for chemical engineers in the pharmachem and engineering
1
consultancy sectors, and for biomedical engineers in the medical devices sector.
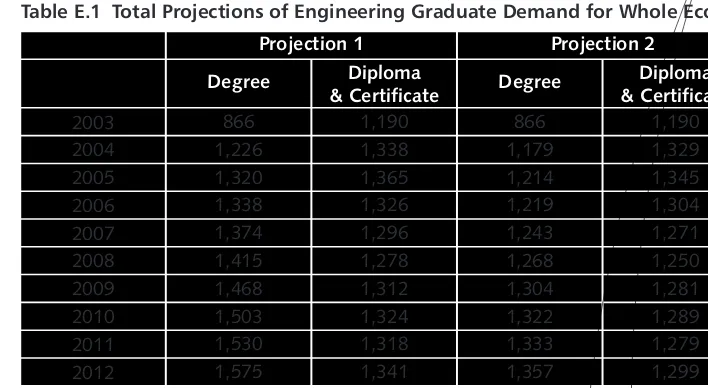
Table E.1 summarises the "total economy" projections, which represent the sum of the sectoral projections. As two projections (Projections 1 & 2) are presented for the software & IT services sector, two separate totals are presented for each level of qualification.
The steep rise in projected demand for engineering graduates early in the period reflects a recovery in demand arising from a recovery in global ICT markets. The disciplines for which most demand is projected are civil engineering and electronic engineering, both at degree level and at diploma and certificate level. The demand for civil engineering graduates is driven mainly by construction activity, while the demand for electronic engineering graduates is driven by projections of a resumption of growth in ICT industries.
The degree level projections do not distinguish between demand for primary degree graduates and that for higher degree graduates. Other studies by the Expert Group on Future Skills Needs have projected that there will be a major need for graduates with research degrees to staff many of the research and development positions that are expected to emerge. Also, the view of the future projected is one in which there will be
s n ai ci n h
c eT
g ni
r
e
e
ni
g
n
E
&
sr
e
e
n
i
g
n
E
f
o
yl
p
p
u
S
d
n
a d
n
a
me
D
e
h
T
very much more product development work undertaken in Ireland. Across all sectors this will lead to a greater need for graduates with research degrees.
Table E.1 Total Projections of Engineering Graduate Demand for Whole Economy
E.3
Supply of Graduates
The number of students graduating in engineering has increased markedly since the 1980s, although general growth in graduate output in Ireland means that the share of graduates accounted for by engineering has fallen since around 1986.
Not all engineering graduates become available for employment by Irish industry. Many, particularly at certificate and diploma level, proceed to obtain a higher qualification, and thus do not enter the labour market at the level at which they graduate initially. Significant numbers also emigrate at degree level. However, the percentage of degree level engineering graduates remaining in Ireland has increased substantially over time.
The number of students graduating is likely to increase over the period to 2004, and there is likely to be a modest fall in degree level output in 2005. Over this period there will be a shift in the mix away from electronic engineering, with continued growth in civil engineering.
In the long-term, the supply of engineering graduates is in large part a function of the number and quality of applicants for engineering courses. As relatively few mature students applying for admission to third level have a strong mathematical and
scientific/technical background, this means that the supply of degree level graduates is mainly a function of the number and mix of school leavers applying to study
engineering.
Both the number of college applications and the number of students in the school leaving age cohort peaked in 1998. Both have already fallen since, and are expected to fall further, with school leaving numbers falling to approximately 60,000 in 2006 and approximately 50,000 in 2012. This would reduce the number of students applying for engineering courses by an equivalent amount. This is equivalent to a fall in degree
2
output from 1,720 projected for 2002 to 1,441 in 2010 and 1,208 in 2016 .
Based on interviews with engineering students and engineering academics undertaken for the current study, it is apparent that the other major factors affecting the level of interest in studying engineering include:
Perceptions of opportunities for engineering graduates;
Projection 1 Projection 2
1,190 1,329 1,345 1,304 1,271 1,250 1,281 1,289 1,279 1,299
Degree Diploma
& Certificate
Diploma & Certificate Degree
2003 2004 2005 2006 2007 2008 2009 2010 2011 2012
866 1,226 1,320 1,338 1,374 1,415 1,468 1,503 1,530 1,575
1,190 1,338 1,365 1,326 1,296 1,278 1,312 1,324 1,318 1,341
866 1,179 1,214 1,219 1,243 1,268 1,304 1,322 1,333 1,357
Subject choice at Leaving Certificate and Junior Certificate level; and
Perceptions of engineering among school students.
E.5
Gap Analysis
The gap analysis undertaken is based on two scenarios that provide different indications of the future development of the supply of graduates in engineering.
Scenario 1 is based on the assumption that recruitment into engineering courses will fall in proportion to the falling size of the school leaving age cohort, and that this will have a proportionate impact on the number of graduates these courses will produce.
Scenario 2 takes Scenario 1 as its starting point, and further assumes that the fall in applications for engineering courses experienced in 2002 is maintained, and has a persistent impact on the number of graduates produced.
Table E.2 summarises the overall balance between supply and demand under each of
3
the two scenarios . It shows the balance between supply and demand shifting from
4
surplus to shortage conditions under each of the supply scenarios .
Table E.2 Overall Balance Between Supply and Demand Under Two Supply Scenarios
It is important to exercise some caution in interpreting the results. Even if the views on the future encapsulated in this report turn out to be fairly accurate, variations in demand, changes in course provision, and changes in the disciplines attracting the most applications, could overturn an overall over-supply or under-supply of some hundreds of graduates.
Also, an indication of an excess of supply over demand does not in itself suggest that there is a problem. Where the numbers likely to do this are not overwhelming, an oversupply of graduates should be seen in a positive light.
When individual disciplines within engineering are considered, the following are the most important issues that arise.
At both degree and diploma/certificate levels, the supply of electronic engineering and telecommunications engineering graduates is projected to
Degree Dip & Cert
357 11 -62 -50 -25 -18 -124 -212 -225 -230
Supply Scenario 1
2003 2004 2005 2006 2007 2008 2009 2010 2011 2012
767 411 292 232 171 153 34 -116 -210 -317
357 172 94 102 127 132 18 -79 -94 -97
767 411 166 109 50 31 -83 -224 -313 -416
Supply Scenario 2
Supply Scenario 1
Supply Scenario 2 s
n ai ci n h
c eT
g ni
r
e
e
ni
g
n
E
&
sr
e
e
n
i
g
n
E
f
o
yl
p
p
u
S
d
n
a d
n
a
me
D
e
h
T
exceed demand in the short-term, but there is potential for a severe shortage in the longer-term. As the availability of electronic engineers is a prerequisite for many of the industry developments envisioned, the degree level shortage could have significant negative industrial development implications. This shortage at both levels has the potential to be worse if interest in electronic engineering among college applicants does not recover.
There is potential for a shortage of graduates with diplomas and certificates in
5
civil engineering .
There is a general issue across all disciplines and levels that the balance between supply and demand for graduates is projected to tighten significantly over the period to 2012.
In very broad terms over the period addressed by the projections, and aside from a significant over-supply being likely in some disciplines in the short-term, there is no very major discipline specific supply imbalance projected at degree level in other engineering disciplines.
In summary, the main areas where gaps in supply are projected are in electronic engineering and degree level telecommunications engineering. In these areas, the main constraint is to do with the number and quality of college applicants wishing to apply for courses. The provision of further places will only become a significant policy issue if this can be resolved.
E.6
Summary of Recommendations
Recommendation 1: Expanding and Reviewing STEPS
It is recommended that the extent of existing STEPS activities should be expanded so as to reach a significantly higher proportion of second level students. This will require a significantly greater commitment of funding from industry and from the Department of Education & Science. It will also require a greater commitment of time and effort from employers of engineers, from engineers and engineering academics, and from the IEI.
Recommendation 2: Reviewing STEPS
It is recommended that IEI should undertake a review of the operation of STEPS. Implementation of the other recommendations on STEPS presented in the current report should not be delayed for this review.
Recommendation 3: Taster Courses
It is recommended that STEPS should become involved in engineering taster courses, through:
facilitating the sharing of expertise and experience between colleges;
providing support materials; and
developing, in co-operation with the colleges, an overall planning framework that ensures good coverage of the key target groups.
Recommendation 4: Research into Engineering Careers
It is recommended that the IEI in association with Forfás should initiate an analysis of actual long-term career outcomes of people with third level engineering qualifications. This will have potential use in future promotional activities.
Recommendation 5: Marketing Resource for Third Level Colleges
It is recommended that the HEA and the Department of Education & Science should consider financing a marketing resource to support the engineering, science and computing faculties and schools in each third level college.
Recommendation 6: Guidance Counsellors
It is recommended that the Department of Education & Science should develop and provide a labour market in-service training programme for guidance counsellors, placing emphasis on careers in engineering, science and technology and the industries that employ graduates in these disciplines. It should develop and revise regularly a suite of materials on the labour market to support guidance work.
Recommendation 7: Review of Mathematics
It is recommended that the review of mathematics recommended by the Task Force on the Physical Sciences should be asked to address increasing the number of students taking Higher Level Mathematics.
The review should take account of the evidence on marking and of the recommendation of the Task Force on the Physical Sciences that problems of this nature should be resolved.
The group should consider the possibility of offering bonus CAO points for mathematics for all college courses, both to give students at all levels an incentive to treat it as one of their core six subjects, and to compensate them for the perceived heavy workload associated with taking the subject seriously.
The review should also address the factors at primary level and at junior cycle second level that may limit the take-up of Higher Level Mathematics at Junior Cycle, thus limiting the size of the pool from which students taking Higher Level Mathematics to Leaving Certificate level can be drawn.
Recommendation 8: Common Entry Options for College Entry
It is recommended that colleges should move to increase the percentage of engineering degree students recruited through common entry mechanisms. The HEA should monitor trends in entry through these mechanisms.
Recommendation 9: Labour Market Information for Engineering Academics
It is envisaged that the Expert Group on Future Skills Needs and Forfás will communicate a thorough and balanced analysis of the labour market position and outlook to key engineering academics.
Recommendation 10: Research Resources and Facilities
The HEA should consult with colleges about the space and other resources they need for postgraduate engineering research, with a view to providing a separate fund for investment in additional space, and upgraded space, where sufficient suitable space cannot be sourced within the college.
Recommendation 11: Funding for Postgraduate Research
It is recommended that the Government and relevant funding bodies should ensure that sufficient funding for research by engineering postgraduates is made available so as to avoid making funding an important constraint on the number of well qualified people able to take up postgraduate research in engineering. Funding bodies should review the operation of funding cycles so as to ensure that it is possible for engineers to take up postgraduate studies as they become available for study, rather than necessarily waiting for the start of the next academic year. The HEA should monitor progress on this recommendation.
s n ai ci n h
c eT
g ni
r
e
e
ni
g
n
E
&
sr
e
e
n
i
g
n
E
f
o
yl
p
p
u
S
d
n
a d
n
a
me
D
e
h
T
Recommendation 12: Approaches to Learning in Engineering
It is recommended that the Engineering Deans and Heads of School in third level colleges should form an ad-hoc taskforce to examine the potential benefits from, and obstacles to, moving towards a more project-based and problem-based approach to learning. A report should be prepared based on this examination for consideration by the Expert Group on Future Skills Needs, the HEA and the Department of Education & Science.
Recommendation 13: Pre-Engineering Courses
It is recommended that, where sufficient demand exists from people with suitable levels
6
of ability and commitment, institutions including further education colleges and third level colleges should run pre-engineering courses designed to bring mature students to a level in mathematics and the physical sciences equivalent to at least a higher level C3. Where such courses already exist, they should be continued. Forfás should monitor the provision of such courses.
Recommendation 14: National Programmes
It is recommended that the Institutes of Technology should continue the Industry Trainee Programme and Accelerated Technician Programme where there is sufficient demand from trainees and industry.
Recommendation 15: Certification of People Up-skilled in Companies
It is recommended that engineering departments of third level colleges, particularly of Institutes of Technology, should work with HETAC, industry and the IEI to develop more active systems of accreditation of prior and experiential learning, and also to provide tailored upskilling opportunities to bridge existing learning and the requirements of higher levels of qualification.
Recommendation 16: Promoting Immigration by Engineers
It is recommended that the Government should take into account in future immigration policies the likelihood that there will be a need for immigration by engineers from within the EU and from beyond the EU. It should also allow flexibility to introduce targeted skills initiatives.
Recommendation 17: Drawing Students from Overseas
The Expert Group on Future Skills Needs recommends that interested bodies should take positive action towards attracting engineering students from overseas, and that they should use the forthcoming HEA study of the issue to inform their responses. Forfás and the HEA should monitor progress in this area.
Recommendation 18: Systems of Statistical Classification
The Expert Group on Future Skills Needs recommends that Forfás should initiate a review of industry data sources. This should include its own data and that from other agencies including FAS, HEA, Enterprise Ireland and IDA Ireland, and at CSO data sources, in the context of the requirements of skills policy research, formulation, implementation and review. The review should make recommendations on industry classifications and survey coverage applicable across all relevant agencies.
1. Introduction, Context and
Methodology
1.1
Introduction
Forfás, acting on behalf of the Expert Group on Future Skills Needs commissioned McIver Consulting to undertake an examination of the future supply of engineers and engineering technicians. The findings and recommendations have implications for the education, business and government sectors to ensure an adequate supply of this key profession in the future.
The purpose of this chapter is to describe the context for the study. It begins by
reviewing the role of engineers and engineering technicians in the economy. It continues by examining Irish industrial development and its beneficial consequences, and
highlights the central role that engineering-intensive industries have played. It shows how these industries have depended on being able to recruit large and increasing numbers of graduates in engineering disciplines.
The analysis shows, however, that engineering has not kept pace with higher education generally in terms of the number of graduates produced. Engineering's share of degree graduates has fallen from 15.2% in 1986 to just 10.2% in 2000. The share of diploma and certificate graduates accounted for by engineering has fallen from 31.7% in 1991 to 25.1% in 2000.
The chapter goes on to examine the future of Irish industry, and shows that the vision of the future implicit in the strategies of the industrial development agencies is one in which engineering-intensive industries will continue to play a central role. This being the case, the supply of graduates in engineering will be an important determinant of Ireland's future economic success.
However, the supply of graduates in engineering into the future faces a number of challenges. These include the ongoing decline in the number of people in the school leaving age cohort, and a loss of popularity for some key engineering disciplines among college applicants.
The chapter proceeds to investigate the international context. First it compares Ireland's output of engineering graduates with that of a range of other countries. Then it examines how countries overseas have responded to similar threats to the supply of engineers and other technological professionals. Finally the chapter analyses the potential to source engineers and engineering technicians from overseas. The chapter concludes with an overview of the methodologies used for the study.
1.2
Role of Engineers and Engineering Technicians
Engineers and engineering technicians play a crucially important role in many sectors of Irish industry, and also in a range of areas of public service provision.
Key roles undertaken by engineers include:
Designing, developing and producing new products, software etc., and improving existing products, software etc.;
Designing, managing and improving production processes; s
n ai ci n h c eT g ni
r
e
e
ni
g
n
E
&
sr
e
e
n
i
g
n
E
f
o
yl
p
p
u
S
d
n
a d
n
a
me
D
e
h
T
Planning, designing and implementing infrastructure development; Designing and managing construction projects; and
Advising on technical issues across the public and private sectors.
These are roles that drive improvements in productivity, innovation and competitiveness. Engineers also play a role in health & safety and environmental management, and setting and ensuring compliance with public regulations.
Many of Ireland's companies, big and small, have engineers in senior leadership roles. Major organisations with engineers as managing directors include Intel, Hewlett Packard, Boston Scientific, Iona Technology, Xilinx, Bausch & Lomb, ESB, CRH and Ascon, among others.
Typical roles undertaken by engineering technicians include:
supporting engineers in any of the above roles, often through hands-on work such as fabricating prototypes, preparing drawings, using computer aided design tools, testing products, or operating quality assurance systems; and
working in engineering roles, although usually at a significantly lower level than an engineer with an equivalent duration of experience.
The roles described here overlap with those of some other professions. In some industries, scientists have key roles in developing and improving products, and in designing, managing and improving production processes. In industries such as pharmaceuticals and food, most of the technicians undertaking support work are science technicians, rather than engineering technicians.
In the area of IT skills, there is no well-established boundary between engineer software developers and non-engineer software developers. Even where job titles suggest a distinction, this tends to be a matter of local terminology, rather than anything systematic. The IEI now accredits some computing courses, but it remains to be seen whether this will have a meaningful impact on actual occupational structures in industry.
In order to undertake this study, there was a need to establish a clear basis for determining whether or not a third level course should be considered to be within the scope of the study. The following points address the main areas where the choice was not clear-cut.
In the broad IT area, courses with titles such as Electronic Engineering, Telecommunications Engineering or Computer Engineering are treated as falling within the scope of the study. Courses with titles such as Software Engineering, Computer Science, Computing or Computer Applications are treated as falling outside the scope, as it would not be feasible to distinguish between demand for graduates of these and other software development related courses. Previous studies undertaken by the Expert Group on Future Skills Needs have
1 drawn the distinction between engineering at approximately the same point .
Graduates of Science departments in the Institutes of Technology are generally treated as being outside the scope of the study. Thus, while there are Chemical Engineers within the scope of the study, there are no Chemical Engineering technicians. Graduates in Instrumentation Physics, who often enter employment as Instrumentation Technicians and Instrumentation Engineers are also excluded from the scope of the study.
No distinction is made between degree courses accredited by the IEI and those unaccredited. The main areas where unaccredited courses occur within the scope of the study are in manufacturing/industrial engineering, and in some construction-related areas that are classified with civil engineering for the purposes of this study.
1.3
Irish Industrial Development and its Consequences
Much of the success that the Irish economy has experienced in recent years has its origins in earlier decades. A pattern of inward investment in pharmaceuticals was established by the 1960s. The roots of the software sector lie in the 1970s. Inward investment in electronics hardware was also established by the 1970s, but accelerated after the landmark establishment of Irish operations by Digital Equipment Corporation in 1982.From the late 1980s, these developments and others brought the Irish economy's rate of growth significantly above the average for other developed countries, a pattern that has continued since.
Figure 1.1 Growth in Real GDP
Source: Data from OECD Economic Outlook, various editions, including June 2002 edition.
This high rate of economic growth has reflected a rate of increase in labour productivity that far exceeds the average for other developed economies.
Figure 1.2 Growth in Labour Productivity
Source: Data from OECD Economic Outlook, various editions, including June 2002 edition.
This has increased Irish output per capita from a level well below the average for developed countries to a level that is now well above the average. It has increased Irish household consumption per capita to a level similar to that in other developed
countries, which demonstrates that a substantial part of the increase in productivity has been captured by workers in increased spending power. It has lowered the
unemployment rate in Ireland to well below the EU and OECD average.
14 12 10 8 6 4 2 0 -2 2 0 0 3 (f ) 2 0 0 2 (f ) 2 0 0 1 2 0 0 0 1 9 9 9 1 9 9 8 1 9 9 7 1 9 9 6 1 9 9 5 1 9 9 4 1 9 9 3 1 9 9 2 1 9 9 1 1 9 9 0 1 9 8 9 1 9 8 8 1 9 8 7 1 9 8 6 1 9 8 5 1 9 8 4 1 9 8 3 1 9 8 2 1 9 8 1 1 9 8 0 1 9 7 9 1 9 7 8 1 9 7 0 -1 9 7 7
Ireland
EU
OECD
10 8 6 4 2 0 -2 -4
Ireland
EU
OECD
2 0 0 3 (f ) 2 0 0 3 (f ) 2 0 0 2 (f ) 2 0 0 1 2 0 0 0 1 9 9 9 1 9 9 8 1 9 9 7 1 9 9 6 1 9 9 5 1 9 9 4 1 9 9 3 1 9 9 2 1 9 9 1 1 9 9 0 1 9 8 9 1 9 8 8 1 9 8 7 1 9 8 6 1 9 8 5 s n ai ci n h c eT g ni r e e ni g n E & sr e e n i g n E f o yl p p u S d n
a d
Table 1.3 Comparative Data on Performance of Irish Economy
Source: National Accounts of OECD Countries: Main Aggregates, 2002, OECD; Unemployment Rate Data (including forecasts) from OECD Economic Outlook, various editions, including June 2002 edition.
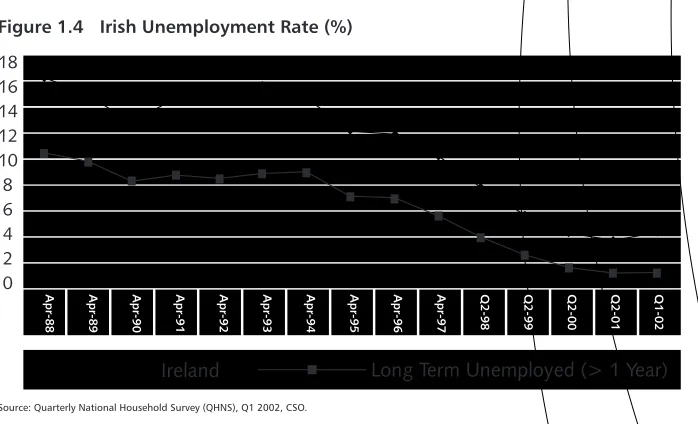
It has directly benefited many of the most vulnerable groups in Irish society by reducing the long term unemployment rate to less than one eighth of what it was, from 10.4% in 1988 to 1.2% in Q2 2002.
Figure 1.4 Irish Unemployment Rate (%)
Source: Quarterly National Household Survey (QHNS), Q1 2002, CSO.
1.4
The Engineering-Intensive Industries that have
Contributed
1.4.1 History of Industry Growth and of Recruitment of Engineering Graduates
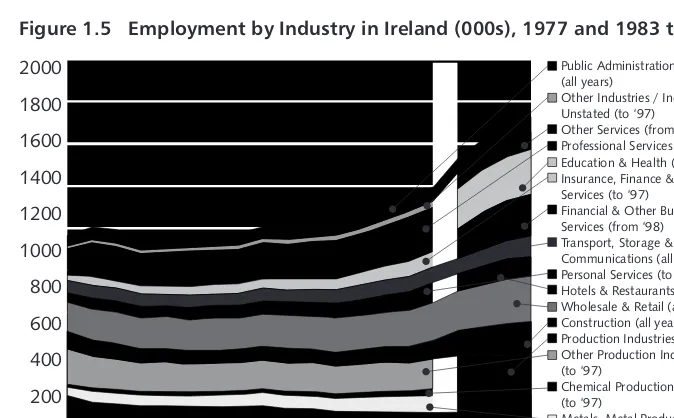
The fall in the Irish unemployment rate has reflected a large rise in employment. Having stabilised at around 1.1m by the mid-1980s, Irish employment rose to 1.7m in 2001, despite the continuation of a long term decline in employment in agriculture.
Figure 1.5 summarises sectoral employment statistics drawn from the Labour Force Survey and the Quarterly National Household Survey. These surveys present less sectoral detail than other CSO surveys, but have the benefit that they cover the whole economy.
GDP per Capita in 1995 US$, Based on Purchasing Power
Parities
Household Final Consumption per Capita in 1995 US$,
Based on Purchasing Power Parities
Unemployment Rate (%)
1970 1980 1985 1990 1995 2000 2001
IRL EU 15 OECD IRL EU 15 OECD IRL EU 15 OECD
7,772 10,706 11,662 14,824 18,157 27,672
11,609 14,958 16,036 18,461 19,454 21,852
12,000 15,216 16,586 18,908 19,987 22,662
5,416 7,038 6,875 8,260 9,352 13,232
6,398 8,503 8,938 10,521 11,018 12,428
7,153 9,218 10,015 11,433 12,142 13,811
7.3 16.5 12.8 12.2 4.3 3.9
5.9 9.8 8.1 10.7
8.5 8.0
5.7 7.4 5.7 7.3 6.1 6.4
18 16 14 12 10 8 6 4 2
0 Q
1
-0
2
Q
2
-0
1
Q
2
-0
0
Q
2
-9
9
Q
2
-9
8
A
p
r-9
7
A
p
r-9
6
A
p
r-9
5
A
p
r-9
4
A
p
r-9
3
A
p
r-9
2
A
p
r-9
1
A
p
r-9
0
A
p
r-8
9
A
p
r-8
8
Ireland
Long Term Unemployed (> 1 Year)
[image:19.686.154.503.399.611.2]An examination of these statistics shows that the key internationally-traded sectors involved, in terms of the classifications used by the CSO, were:
Metals, Metal Products; Mechanical, Electrical and Instrument Engineering;
Chemical, Rubber and Plastic Products; and
(Insurance,) Finance and Business Services.
Much of the rest of the increase in employment came from domestically-traded sectors that expanded to service the needs of these sectors, or to service the needs of
consumers whose income derived ultimately from these sectors. Key among these is the construction sector, where employment rose to 81,500 in 1995, and then more than doubled to 180,200 in 2001.
Figure 1.5 Employment by Industry in Ireland (000s), 1977 and 1983 to 2001
Source: Data from 1977 to 1997 drawn from annual Labour Force Survey, CSO. Data from 1998 to 2001 drawn from QHNS, CSO. The detailed industry classifications published in the QNHS were changed from those published in the LFS, its predecessor. Some industry definitions were changed very little, and these areas of continuity are shown as being continuous in the chart.
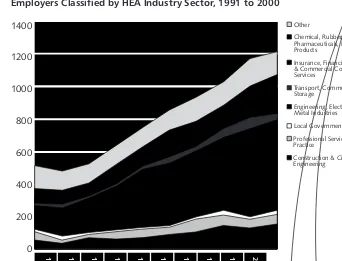
There is a close correlation between the sectors where employment growth has occurred and the sectors which mainly recruit engineers, as can be seen from Figure 1.6, which
2
shows how recruitment of new engineering graduates by sector has developed over the last ten years. The substantial increase in employment in these sectors has been
reflected by very substantial recruitment of engineering graduates.
2000
1800
1600
1400
1200
1000
800
600
400
200
0 Q
2
-2
0
0
1
Q
2
-2
0
0
0
Q
2
-1
9
9
9
Q
2
-1
9
9
8
1
9
9
7
1
9
9
6
1
9
9
5
1
9
9
4
1
9
9
3
1
9
9
2
1
9
9
1
1
9
9
0
1
9
8
9
1
9
8
8
1
9
8
6
1
9
8
5
1
9
8
4
1
9
8
3
1
9
7
7
Public Administration & Defence (all years)
Other Industries / Industry Unstated (to ‘97) Other Services (from ‘98) Professional Services (to ‘97) Education & Health (from ‘98) Insurance, Finance & Business Services (to ‘97)
Financial & Other Business Services (from ‘98) Transport, Storage & Communications (all years) Personal Services (to ‘97) Hotels & Restaurants (from ‘98) Wholesale & Retail (all years) Construction (all years) Production Industries (from ‘98) Other Production Industries (to ‘97)
Chemical Production Industries (to ‘97)
Metals, Metal Products; Mechanical, Electrical & Instrument Engineering (to ‘97) Agriculture, Forestry, Fishing (all years)
s n ai ci n h c eT g ni
r
e
e
ni
g
n
E
&
sr
e
e
n
i
g
n
E
f
o
yl
p
p
u
S
d
n
a d
n
a
me
D
e
h
T
[image:20.686.154.491.351.560.2]Figure 1.6 Recruitment of New Primary Degree Engineering Graduates by Irish Employers Classified by HEA Industry Sector, 1991 to 2000
Source: Grossed up from data from First Destination of Award Recipients in Higher Education, editions from 1991 to 2000, HEA.
The increase in recruitment has mainly been concentrated at primary degree level. Recruitment of primary degree engineering graduates by Irish industry more than doubled between 1991 and 2000. Over the same period, recruitment of holders of diplomas and certificates in engineering rose by just over half. Recruitment of higher degree engineering graduates by Irish industry has been more volatile reflecting in part
3 a fall-off in higher degree numbers after 1995 .
1.4.2 Industry Definitions
While the industry classification systems behind the CSO industry data and the HEA graduate data are very similar, these systems of classification provide insufficient detail in key growth areas for the purposes of this report. The following, (cross-referenced to HEA classifications in italics) were the key growth areas that recruited engineers and engineering technicians:
Software and IT Services (part of Insurance, Finance and Business Services and of Metals, Metal Products; Mechanical, Electrical and Instrument Engineering);
Electronics Hardware & Systems (part of Metals, Metal Products; Mechanical, Electrical and Instrument Engineering);
4
Integrated Circuit Design (part of Metals, Metal Products; Mechanical, Electrical and Instrument Engineering);
Medical Devices (part of Metals, Metal Products; Mechanical, Electrical and Instrument Engineering);
Pharmaceuticals (part of Chemical, Rubber and Plastic Products);
Construction; and
Engineering Consultancy (part of Other Services / Professional Services).
1400
1200
1000
800
600
400
200
0
2
0
0
0
1
9
9
9
1
9
9
8
1
9
9
7
1
9
9
6
1
9
9
5
1
9
9
4
1
9
9
3
1
9
9
2
1
9
9
1
Other
Chemical, Rubber, Plastics Pharmaceuticals, Health Care Products
Insurance, Financial, Business & Commercial Computer Services
Transport, Communications Storage
Engineering, Electronics, Metal Industries Local Government Professional Services, Private Practice
Construction & Civil Engineering
[image:21.686.153.495.179.440.2]More detailed information about the history of employment in most of these sectors is presented in Chapter 3. Recruitment of degree level engineering graduates is also presented at a more detailed level, based on an analysis of the actual employers recorded in the HEA's First Destination database carried out for this study on graduates
5 of 2000 .
1.5
Engineering Graduate Output
1.5.1 Levels of Qualification
The levels of qualification at which projections are made are as follows:
Degree (primary degrees, higher degrees and postgraduate diplomas); and
Diploma or certificate (undergraduate qualifications).
A certificate in engineering typically takes two years of study. A diploma typically takes three years. This may be through a three year "ab-initio" programme, or through taking a one year "add-on" programme after a certificate programme.
A primary degree in engineering takes four years if pursued ab-initio. If pursued as an add-on to a diploma, it takes a further two years if it leads to a Bachelor of engineering
6
(B.E. or B.Eng.) accredited by the IEI , or one year otherwise. A graduate diploma takes one year of study. Graduate diplomas in engineering may be taken by engineering graduates. Some also take significant numbers of Science graduates. A taught masters degree in engineering takes one or two years of study with full time courses usually taking one year, and part time courses usually taking two years. The duration of study towards research degrees varies.
1.5.2 History of Engineering Graduate Output
In the latter half of the 1970s, the establishment of two new National Institutes of 7
Higher Education , and an initiative to increase the number of graduates available to the electronics sector, combined to increase the intake into primary degree programmes in engineering. Primary degree output rose steeply, before leveling off after 1986. Steady growth in primary degree output resumed after 1990, continuing through the 1990s.
Higher degree output has been more volatile, responding both to increases in the number of students receiving primary degrees, and to labour market conditions. In times of strong demand, such as the latter half of the 1990s, the proportion of primary degree graduates continuing their studies has fallen. Most of the Institutes of
Technology were formed in the early to mid 1970s, initially producing small numbers of graduates with certificates in engineering, and eventually adding diploma level courses. Diploma and certificate engineering graduate numbers from these, and from the existing Dublin colleges that later merged to form Dublin Institute of Technology, increased over time, falling back after peaking in 1995, before increasing again in the period up to 2000.
5 Limitations in the data recorded meant that it was not possible to repeat this exercise for diploma and certificate graduates.
6 The IEI is established by Charter. It is empowered under its Charter to admit to membership, classify and confer titles on its members to indicate their professional standing and classification or grade. In doing so it has regard to current international practice and the various international agreements it has entered into in promotingthe standing and standards of Irish engineering expertise. These agreements provide benchmarks against international standards for Irish Engineering qualifications, and provide a basis for recognition of Irish Engineering qualifications overseas.
Accredited degree programmes, which allow full membership of the Institute, are recognised internationally through the Washington Accord. Accreditation also makes a course eligible for inclusion in the list of programmes whose graduates are eligible for the Eur Eng title of FEANI - Fédération Européenne d'Associations
s n ai ci n h c eT g ni
r
e
e
ni
g
n
E
&
sr
e
e
n
i
g
n
E
f
o
yl
p
p
u
S
d
n
a d
n
a
me
D
e
h
T
8 Table 1.7 Numbers of Engineering Graduate to 2000
Source: Data from First Destination of Award Recipients in Higher Education , HEA, 1982-2000. (Earlier editions disaggregate Diploma and Certificate graduate numbers by discipline.)
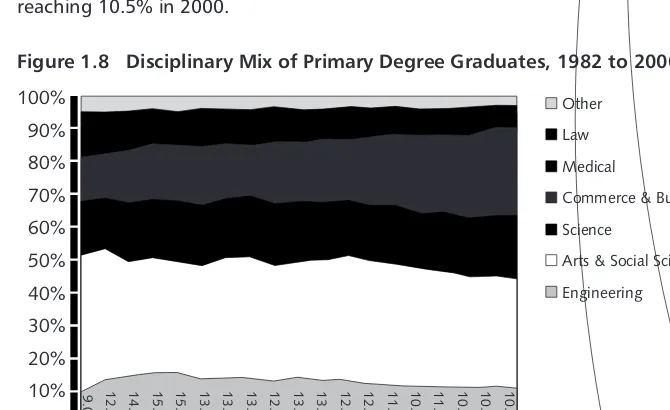
Increases in the number of engineering graduates over time should be seen in the context of a general rapid expansion in higher education in Ireland. In the period up to 1996, the share of all primary degree graduates accounted for by engineering increased, from 9.6% in 1982 to 15.2% in 1986. Since then, engineering's share has fallen slowly, reaching 10.5% in 2000.
Figure 1.8 Disciplinary Mix of Primary Degree Graduates, 1982 to 2000
Source: Drawn from First Destination of Award Recipients in Higher Education , HEA, 1982 -2000.
Engineering's share of all diploma and certificate graduates is lower than it was in the 1980s and early 1990s, but has been fairly stable since 1996.
1.6
Future of Irish Industry
In order to take a useful view as to future requirements for engineers and engineering technicians in Ireland, it is necessary to develop a vision of Irish industry in five and ten years time.
9 The industrial development agencies have a view of where the key opportunities lie . Areas highlighted are as follows.
Information and Communications Technologies: The ICT industries have served
100% 90% 80% 70% 60% 50% 40% 30% 20% 10% 0% Other Law Medical
Commerce & Business
Science
Arts & Social Science
Engineering 2 0 0 0 1 9 9 8 1 9 9 6 1 9 9 4 1 9 9 2 1 9 9 0 1 9 8 8 1 9 8 6 1 9 8 4 1 9 8 2 1 0 .5 1 0 .8 1 0 .6 1 1 .0 1 0 .8 1 1 .4 1 2 .0 1 2 .6 1 3 .1 1 3 .9 1 2 .9 1 3 .6 1 3 .7 1 3 .6 1 5 .2 1 5 .2 1 4 .4 1 2 .9 9 .0 4,000 3,500 3,000 2,500 2,000 1,500 1,000 500
0 20
0 0 1 9 9 9 1 9 9 8 1 9 9 7 1 9 9 6 1 9 9 5 1 9 9 4 1 9 9 3 1 9 9 2 1 9 9 1 1 9 9 0 1 9 8 9 1 9 8 8 1 9 8 7 1 9 8 6 1 9 8 5 1 9 8 4 1 9 8 3
Diploma & Cert Primary Degrees Higher Degrees
8 Note that many of those receiving diplomas have previously received certificates. Thus the net output of graduates with diplomas and certificates is less than that shown here.
9 ”Two fundamental technologies, biotechnology and information technology, are likely to be at the heart of future growth", IDA Ireland Annual Report 2001. The
[image:23.686.155.490.434.639.2]Ireland well as a basis for industrial development at least since the early 1980s. They are receiving backing from the State in the form of substantial funding for research through Science Foundation Ireland and the Higher Education
Authority. The industrial development agencies see them continuing to provide 10
many of the key opportunities in the future .
Biotechnology: Biotechnology is a major focus of State spending on research, 11
and of promotion by the industrial development agencies .
These future industry areas are rooted in the industries in which Ireland has
demonstrated comparative advantage in the past, but will represent an ongoing shift towards higher value adding activities. In many cases, the industries will be more engineering-intensive than in the past, with a higher proportion of engineers in the occupational mix. With a shift in focus from manufacturing towards product development and other knowledge-intensive activities, the