Munich Personal RePEc Archive
A Data Survey on International Capital
Flows to Developing Countries
Keskinsoy, Bilal
Anadolu University
5 May 2017
Online at
https://mpra.ub.uni-muenchen.de/78957/
1
Anadolu University Department of Economics,
IIBF Building, Tepeba ı 26210 Eski ehir/TURKEY [email protected]
This paper examines the data on international capital flows to developing economies for
the period 197002006. Besides the most aggregate group of all developing countries,
developing world is categorised with respect to five regions (Developing Asia, Europe and
Central Asia, Latin America and Caribbean, Middle East and North Africa and Sub Saharan
Africa) and three income groups (upper middle, lower middle and low). The overall structure
and defining features of the data are discussed with reference to the main data sources, span
of time and cross0section units and the core variables of interest. Trends and developments in
aggregate capital flows, equity (FDI and portfolio) flows and debt (long0term and short0term)
flows are assessed. Growth and cyclicality of these flows, FDI share of gross domestic
investment, foreign participation in domestic stock markets and cost and maturity structure of
external borrowing are analysed.
Capital flows, Equity flows, Debt flows, Portfolio flows
2 !"
This paper examines the data on international capital flows to developing economies. The
overall structure and defining features of the data are discussed with reference to the main
data sources, span of time and cross0section units and the core variables of interest.
The Global Development Finance (GDF) database of the World Bank is the key source for
the data series on capital movements. Although there is the word ‘global’ in its name, GDF
covers only developing regions and countries including emerging and less developed. Being
another and yet more extensive World Bank database, World Development Indicators (WDI)
is used to get the indicators—mostly macroeconomic and financial sector—that are not
available from the GDF. Databases such as International Financial Statistics (IFS), Balance of
Payments Statistics (BOPS), World Economic Outlook (WEO) of the International Monetary
Fund (IMF), United Nations Conference on Trade and Development (UNCTAD) and
statistics portal of the Organisation for Economic Co0operation and Development (OECD)
are also consulted for comparison and cross checks.
The years of observations range from 1970 to 2006, covering a maximum of 37 annual
data points. This is the general case for the regions and income groups for which the data are
available. The time length, particularly because of the changing initial years, varies
considerably across countries and by different types of capital flow. As I look at the overall
trends and developments in financial movements to developing markets in this paper, that
should not be a concern at all. Country groups that are composed of developing countries
from different income classes and geographical regions constitute the spatial domain.
Although some data illustrations are based on the income groups for comparison purposes,
the cross0section emphasis is on regions. The two Asian regions, East Asia and Pacific and
South Asia, that are separately identified by the World Bank are combined under the name of
Developing Asia (DA) as in WEO. Europe and Central Asia (ECA) comprises so0called
transitional economies located in Eastern Europe and Central Asia as well as Turkey.1 The
remaining regions, Latin America and Caribbean (LAC), Middle East and North Africa
(MENA) and Sub0Saharan Africa (SSA) are the same as in Word Bank classifications. The
chief grouping is All Developing Countries (ADC) for which the aggregate data consist of
individual sums of regional data. Income groups are based on the World Bank’s classification
of countries according to the level of 2009 GNI per capita, calculated using the Atlas method:
1
3
upper middle income countries (UMIC), which are also known as emerging markets, lower
middle income countries (LMIC) and low income countries (LIC).
Despite the fact that all capital flow types serve similar economic goals through financing
productive real investment opportunities, smoothing business and consumption cycles and
offering diversification and risk sharing, there are differences in terms of functionality, type
of the security, original contractual maturity, direction of the investment, and other
contractual arrangements. For this study, cross0border capital flow data are collected and
organized under the standard sub0aggregates of equity and debt flows. Figure 1 provides a
taxonomic portrayal of the major and minor global funding components covered. Due to
space considerations, seven different data series for which the compositional structures are
shown in the figure are identified for focus: total capital flows, total equity flows, total debt
flows, foreign direct investment (FDI), foreign portfolio equity investment (FPEI), short0term
debt flows and long0term debt flows. The items and information beyond the third level (i.e.
after the node ‘by debtor’) are given for illustrative purposes only.
[Figure 1]
Aggregate total net capital flows for a country group is the sum of total net equity and debt
flows to that group. International aid allocations (concessional loans and grants), IMF credits,
non0residents’ deposits and interest arrears on external debt are excluded. Total equity
inflows comprise net flows of FDI and FPEI. Foreign direct investment refers to the net
financial investments that involve acquisition of a lasting management interest (10 percent or
more of voting stock) in an enterprise operating in an economy other than that of the
investor.2 It is the sum of equity capital, reinvested earnings and other long0term and short0
term capital of similar character. FPEI includes net inflows from equity securities other than
those recorded as direct investment, inflows from traded shares, stocks, depository receipts
(American or global) and direct purchases of shares in local stock markets by foreign
investors. Long0term and short0term debt inflows add up to the total net debt flows. Long0
term debt inflows are disbursements minus principal repayments on private nonguaranteed
(PNG) and public and publicly guaranteed (PPG) debt securities (e.g. publicly issued and
privately placed bonds) and international loans (official and private non0concessional) with
an original or extended maturity of more than one year and that are repayable in foreign
2
4
currency, goods or services. Net short0term debt flows consist of disbursements less principal
repayments on loans, trade credits and negotiable money market debt instruments (such as
repos, treasury bills, commercial and financial papers, bankers’ acceptances, certificates of
deposit and other short0term notes issued under the note issuance facilities that render the
bearer the unconditional right to receive a contractually stipulated, reserved and fixed sum of
money on a specified date) with an original maturity of one year or less.
Following the convention in World Bank (2008), I construct the ‘net’ aggregate capital
flow indicators by summing up net annual credit (if the balance of the flow is positive) or
debit (if it is negative) of the relevant liability accounts in the balance of payments. A
positive numeric figure for a given year, therefore, implies that the financial liability items
end up with a net inflow in that year, while any negative amount would reflect a net outflow
for the year. By this practice, I concentrate on the foreigners’ financial claims on the country
group receiving the funding and ignore those of the domestic residents on foreign entities.
The data are usually expressed either in nominal billions of US dollars (USD) or as
percent of the group’s gross domestic product (GDP), unless otherwise stated. Nominal
values are reported to show the actual realizations (i.e. the data) as they are. It is crucial to
consider these values, as they are the essential or base data of interest throughout the paper.
The primary focus is on nominal values because these figures have actual meaning in that
international financial transactions originally bear these monetary values. In contrast to some
economic and financial indicators or accounts (e.g. GDP), these values are not attached or
assigned by statisticians but perpetually reported through the relevant money and capital
market security accounts. The pertinent recordings in the balance of payments follow crude
realizations and market activities which are mostly denominated in US dollars. Furthermore,
it is the standard treatment in the periodic reports of multilateral organizations and in some
academic articles when they review this kind of data (World Bank, 2012, Bosworth and
Collins, 1999).
Wealth or income scaling is performed to take relative economic sizes or masses,
exchange0rate movements and domestic price changes into account, along with real GDP
growth.3 It also improves the accuracy and reliability of the comparisons across country
groups, as the changing number of countries and observations for each group could bias the
3
5
comparisons based on nominal values. Hence, GDP0scaled data are preferred in comparing
geographical regions and income groups. Currency conversion, aggregation and gap0filling
procedures of the World Bank are adopted and applied for some years in some cases.
The paper proceeds as follows. Section 2 focuses on trends and developments in capital
flow aggregates, whilst Section 3 reviews the level and direction of foreign direct and
portfolio equity investments. The evolution and financial implication of international lending
are covered in Section 4 and the key observations are summarized in Section 5.
#" $ %
I describe the level, composition and direction of global financial flows to developing
countries for the period 197002006. The moving averages of total net capital flows and
aggregate components are provided in Table 1. For all developing countries, total capital
inflows jumped from about $13 billion a year to the nominal level of $350 billion within
three decades. Modest during the initial years, total net equity flows have experienced the
most outstanding rise by ending up with average annual inflows of almost $262 billion. Debt
flows rose very little and fell below 1% of GDP in the most recent sub0period. Although
capital flows as a share of GDP are variable throughout, in these terms total net capital flows
doubled and total equity inflows rose by more than six times eventually.
[Table 1]
The period0averages of total capital and equity inflows are always, while those of debt
inflows are almost always, positive (except for MENA during 1995099 and for SSA during
the last two sub0periods). This shows that external funding is a persistent and prevalent
reality for developing economies and a manifestation of continual investor and creditor
interest in them. The individual sub0periods of 1975079 and 1990094 witness remarkably
higher surges that are driven by debt inflows in the former and by equity inflows in the latter.
Economic slowdown in advanced countries could have contributed to both surges, while
surges during the second episode may additionally be linked to concomitant liberalizations in
developing countries. Total capital inflows were dwarfed by paralyzed debt inflows during
1985089 due most probably to the Latin American debt crisis that had broken out one sub0
period earlier. The effects of 1997 East Asian financial crisis are not that visible from this
table. Initially strong in receiving foreign capital, Latin America and Caribbean loses its
6
Central Asia where debt flows most in the latest sub0periods. Middle East and North Africa
and Sub0Saharan Africa have weak capital flows that remain under $20 billion per year.
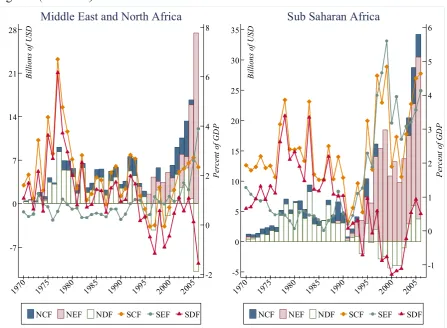
Figure 2 shows the distribution and evolution of aggregate capital inflows over time.
Foreign borrowing and financial investments in developing countries have risen from
relatively low levels to unprecedented amounts within nearly 40 years, approaching to $750
billion in nominal terms. However, this escalation was not monotonic. Lending driven cross0
border financing, displaying largely similar profile across geographical regions, has increased
rather gradually until 1980s. It is depressed throughout this decade because of debt problems
and international credit dry0up in some LAC countries (i.e. Latin American debt crisis that
started in 1982). Financial integration, capital account liberalization and privatization of the
late 1980s have facilitated and accelerated the international investment process that has led
net capital flows to escalate. Exceeding aggregate net debt flows from early 1990s onwards,
aggregate net equity flows have acted as a lean0against0the0wind in keeping total capital
inflows uninhibited from devastating impacts (visible in this figure) of the contagious East
Asian financial crisis that started in 1997 and resulted in lingering debt overhangs in most of
the regions.4 Relative to GDP however, the rise is less impressive and regular, given growth
of GDP and depreciation of the US dollar against some developing country currencies.
[Figure 2]
Aggregate debt flows are more volatile than aggregate equity flows, making the former
responsible for much of the fluctuations in total capital flows. Regarding the individual
regions, note that total debt flows to DA have never been more than 3% of GDP. This low
level of dynamic external leverage of the region coincides with the conventional view that
economic and financial fundamentals of Developing Asian countries had not, in fact,
deteriorated to the extent of giving rise to a crash, which happened nonetheless. Second and
third generation models of financial crises have, therefore, been devised to address this sort of
anomaly by incorporating the investor behaviour, capital market imperfections and systemic
inefficiencies (balance sheet distortions, deposit insurance schemes etc.) into their
formulations.5 Europe and Central Asia is the region where debt flows shape the total capital
flows0that ultimately achieve a high GDP share, being over 10% as of 20060for the majority
of years. As most of the heavily indebted poor countries (HIPC) are in Sub0Saharan Africa,
4
Contagion in 1990s with special emphasis on East Asian financial crisis is documented in Fratzscher (2003)
and Caramazza . (2004).
5
7
the apparent downward course of the region’s SDF over time mirrors the effects of debt
reduction and restructuring policies in these countries. International equity flows to SSA,
albeit quite unstable, increasingly compensate for any possible shortfall in foreign financing
due to borrowing constraints in the region. Following the new millennium, Middle East and
North African capital flows in the last year and Latin American and Caribbean capital flows
for a couple of years has diminished.
[Figure 3]
To enable more explicit comparisons among different country groups, four panels of bar
graphs of the aggregate capital flow component averages are presented in Figure 3.
According to nominal evaluations, Developing Asia, followed by LAC and ECA, ranks the
first among five geographical regions in getting total capital and equity flows. Most of the
aggregate debt inflows go to Europe and Central Asia. However, Latin America and
Caribbean has the highest GDP shares in all categories. The other difference is that equity
flows stand out to be the dominant aggregate component in Panel (a), whereas they are
slightly superseded by debt flows in (b). These differences are most probably due to the
valuation effects (exchange rate and price level changes) that are uncontrolled in Panel (a).
As the exchange rate movements and price level changes may cause the later or recent period
data to dominate the averages in nominal panels, GDP0scaled panels are believed to provide
more accurate and consistent comparisons. Nonetheless, there is a common aspect of both
panels in that the positions of MENA and SSA as being the least popular foreign capital
destinations remain unaltered. The plain truth discernible from the lower half of the figure is
that the global funds are lower in lower income countries. Cross0border capital moving to
developing world, which is already meagre as most of the average GDP shares are well below
3%, seems to be channelled mainly to the upper middle income country (emerging or richer
developing) markets.6
Growth rates and cyclicality measures of capital flows to developing countries are
reported in Table 2. For the purpose of assessing relative growth performances, Panel (a)
gives average and median annual percentage changes in aggregate real capital flows, real
GDP, international reserves (RES) and total external debt (TED) stocks (all in fixed 2005 US
dollars). As capital flows are year0on0year changing net foreign liabilities, they are more
dynamic and have higher growth rates than memorandum items (GDP, RES and TED).
6
8
Setting total capital flows to LIC and total debt flows to LAC, MENA and LIC aside, all of
the real capital flow aggregates grow. Real debt flows to low income countries and to Middle
East and North Africa are shrinking. Reading negative medians and positive means
respectively, note that total capital flows to low income countries and total debt flows to
Latin America and Caribbean are characterized by weak but frequent ebbs and intermittent
but torrential flows, so that whether they are actually growing or contracting is difficult to
tell. While growth in equity flows is more regular and steady, in debt flows, by and large, it is
bulky and lumpy. All memorandum items, even cumulative external debt stocks, grow
everywhere. The positive growth of TED in LIC and MENA0where the mostly private debt
inflows were dwindling0is perhaps because of undisbursed credit commitments, concessional
loans, interest arrears and IMF credits. Faster accumulation of total external debt than real
output is likely to be accommodated by even faster build0up of external reserves, which are in
turn fed by capital inflows. Considering the means and medians, all forms of capital flows to
developing economies in Europe and Central Asia appear to have the highest compound
growth rates.
[Table 2]
The correlations between annual percentage changes in the capital flow aggregates and in
the real GDP that are used to measure the cyclicality of these real aggregates are provided in
Panel (b) of the table. In general, total capital flows and its aggregate components are
acyclical with a few exceptions; total net capital and equity flows to UMIC, aggregate equity
and debt flows to LAC and aggregate net debt flows to LMIC and DA are procyclical. Two
implications are worth to mention. First, no countercyclicality is observed in capital flows.
Second, of the detected procyclicality the most is in the total debt flows.
&" $ % '
A data summary on total net, direct and portfolio equity flows to developing countries is
given in Table 3. As reasonably expected, a quick scan of the entire table indicates that
aggregate equity inflows and FDI are all, and FPEI is mostly, positive. In case of all
developing countries, I see a virtually exponential increase in aggregate equity inflows as
they are up from 0.5% of GDP per year to 3.1% over the 197002006 period. The yearly
average inflows of FDI reached nearly to $225 billion, whilst the equity funds that have been
created by share purchases of foreign portfolio investors soared from almost nil levels (e.g.
9
continuously (even more rapidly after 1980s as a result of economic and financial
liberalization, integration, capital market establishment and privatization), their GDP
proportions do not always follow an increasing pattern0they were smaller than or equal to
0.5% during the pre01990s and showed consecutive increases only in case of total and direct
equity flows thereafter. Average annual GDP share of foreign portfolio equity investments in
developing markets has never transcended 0.4%. As a matter of compositional evaluation,
total equity flows have been shaped almost completely by FDI throughout the initial two
decades and still FDI has wheeled them over the remaining years.
[Table 3]
The equity inflows, again in nominal terms, to MENA and SSA that have been getting
smaller in volume due to the lower velocity made these regions the ultimate losers against the
other two such as DA and ECA whose performances in attracting foreign equity capital have
been overwhelming, particularly in the post01980s. The competitive allocation among regions
would then translate into ‘who gets more’ instead of ‘who loses more’. For instance, Latin
America and Caribbean (Europe and Central Asia) that was getting largest (smallest) volumes
for the first fifteen years has seen its position changed afterwards. It is noteworthy that Sub0
Saharan Africa is not only the region which had available FPEI data at the outset but also it is
the one that has the highest GDP shares for total and portfolio equity inflows (in the most
recent decade). The drastic variations in nominal and scaled FPEI flows0having the only
negative figures in the table0might be taken as a clue for the sheer speculative activity in SSA
stock markets.
On an annual basis, the net foreign direct and portfolio equity flows to developing
countries that were on an upward trajectory after the early 2000s have finally arrived at about
$400 billion and $100 billion respectively (Figure 4). Albeit with varying sizes, nominal
inflows follow rising trend towards the end of the period in all regions but Latin America and
Caribbean. To rephrase the FDI dominance in total equity flows, FPEI is greater than FDI in
just two instances; in LAC, 1993 and in SSA, 1998. The adverse effects of currency and
banking crises on global equity flows are also traceable in this figure. Although total and
direct equity flows never fall below zero and hence do not pose any outflow, they are reduced
by the Latin American debt crisis in early 1980s (distinguishable in ADC and LAC graphs)
and by other regional or country level crashes in certain years from the mid01990s onwards
(Mexican, East Asian, Russian, Brazilian, Turkish and Argentine financial mayhems in 1994,
10
however, can only be seen in FPEI for at least a year in any geographical region (SSA has the
most of such cases, for example). Furthermore, it seems that FPEI flows deteriorate
concurrently with the beginning of the crisis, whereas deterioration in FDI flows comes with
some lag following the crisis.
[Figure 4]
Figure 5 shows how the aggregates and components of cross0border equity flows are
distributed among different country groups. According to Panel (a), Developing Asia has the
largest share in nominal FDI and portfolio equity flows as well as in aggregate equity flows.
As in Figure 3, GDP scaling changes the order of distribution and pulls Latin America and
Caribbean up to the highest echelon in SEF and SFDI and to the second highest in SFPEI,
after Sub0Saharan Africa. Panel (b) also demonstrates that developing regions have more
evenly distributed foreign equity investments relative to their output. The only regularity
observed across the top panels of the figure is that Middle East and North Africa has the
lowest shares in all three categories. The panels at the bottom, again similar to Figure 3,
uniformly indicate the existence of income bias in international portfolio and direct equity
investments in developing countries. Moreover, I see from the percentage averages (being as
little as around 1.5 or less) in the right panels of the figure that these investments are still well
under the economic potential of the countries at the periphery.
[Figure 5]
The compound growth rates of and cyclicality statistics for real equity inflows are reported
in Table 4. On average, aggregate net equity flows have an annual growth rate of about 10%
or more in every country group. Real portfolio equity and FDI flows to all country groups but
Sub0Saharan Africa are growing positively, and the former has much faster growth. Since
foreign direct and portfolio equity investments tend to fluctuate in SSA, the trends are
ambiguous. Europe and Central Asia (among the regions) and lower middle income countries
(from the income groups) appear to have the most buoyant equity finance. Correlations
between yearly growth rates of real GDP and equity flows reveal that, as for aggregates
above, all types of external equity flows are generally acyclical. As there is no significantly
countercyclical flow, real equity inflows (all three) to LAC and direct and total equity flows
to UMIC are the only procyclical flows.
11
Foreign contribution to gross domestic investment (GDI) in developing countries was, on
average, around 5.5% a year within the period 197002006 (Figure 6). This implies that the
extent of multinational involvement in domestic capital formation at the periphery has been
limited.7 Among the three regions with above average shares, Europe and Central Asia
achieves the highest involvement at nearly 10%, being roughly three percentage points above
the next region (Latin America and Caribbean). It is surprising that Developing Asia comes
out to be the least popular investment location for foreigners and that even Middle East and
North Africa outstrips it in this regard. Notwithstanding the fact that differences among
income groups are less pronounced, the FDI portion of GDI is biggest in emerging economies
and, peculiarly, it is bigger in low income countries than the countries of the income group in
the middle. Except for the second sub0period, the ratio is increasing over time, with a marked
acceleration in the post01980s.
[Figure 6]
Figure 7 compares the non0resident participation in developing0country domestic stock
markets across the regions and over time. Apart from the Middle East and North Africa
which has the lowest share, foreign participation has been relatively balanced throughout the
regions. Taking the rate of participation for ADC as an indicator and bearing the definitions
of foreign portfolio equity inflows and domestic stock market capitalization in mind (such as
that the former additionally includes depository receipts), I estimate that international
investors would have weighted developing country assets in their portfolio at an average rate
of about 1%. This confirms the common view that developing and emerging market equities
are underweighted in global portfolios as a result of home bias and lack of diversification.8
Because there was no stock exchange in every country until the late 1980s I could not depict
the proportions for the first 15 years. Once the bourses are properly established, the non0
resident engagement began to materialize and stood above 1.5% per year during the initial
episode (which is very close to the estimate of Bekaert . (2002) who find that, after the
liberalization, foreign portfolio equity flows increase by 1.4% of market capitalization);
overshooting by 2% in the first half of 1990s has subsequently declined.
[Figure 7]
7
In a partially similar vein, Aizenman . (2007) find that just 10% of the domestic capital stock in developing countries has been externally financed throughout the 1990s.
8
12
(" $ %
External debt flows to developing countries have been more variable than equity flows
over the period 197002006. The episodes of upward surges have been interrupted by the next
episodes of slumps or decelerations because of either financial crises or voluntary and
discretionary debt reduction policies in different countries. Although these structural break0
like episodes were transitory in some countries, they could have been rather prolonged in
others. The overall observation is that the volumes of cross0border lending have recorded
higher amounts at the end of the period than at the beginning, although this is not the case
when expressed relative to income.
A factual synopsis of the total, long0term and short0term debt movements is provided in
Table 5. Within about four decades, average annual short0term debt inflows soared from $2
billion to $46 billion; a 230times increase that ultimately put the short0term debt flows ahead
of the long0term debt flows in the last sub0period. The enlargement in total and long0term
debt inflows has been relatively smaller, even though they had no outflows (i.e. always being
positive, on average and for all developing countries) unlike short0term debt inflows.
Aggregate nominal foreign borrowing has risen in all sub0periods but 1985089 when it
decreased as a result of Latin American debt crisis. In US dollar denominations, long0term
foreign borrowing has behaved similarly but it decreased in the last sub0period, reflecting the
adverse effects of financial crises in East Asia and in some other developing countries that
had taken place earlier. Voluntary debt restructuring and reduction operations might also
have contributed to this diminution. The declines in nominal short0term net foreign
borrowing have occurred during the same sub0periods when the crises erupted. To stylize the
fact that has become clear so far, I note that the deterioration in short0term debt inflows goes
along with the advent of the crisis whilst long0term debt inflows degenerate with some lag
after the crisis. This sequential process, which is similar to the one in equity flows described
before, largely continues during the recovery phase after the crisis. Following the peak in the
second half of the 1970s, all forms of debt flows as a percentage of GDP have fluctuated but
never attained their pre01980 levels, even below 1% in the most recent sub0period.
[Table 5]
Net outflows are detected in some regions. As the table shows the rolling averages but not
the exact yearly realizations, the negative incidences are quite few. Clustering of outflows in
13
new borrowing) rather than contagious currency and banking crises. There are two reasons
behind this argument; the first is that the most numerous outflows occurred in Sub0Saharan
Africa and Middle East and North Africa which are the regions without any notorious
financial crashes, and the second is that the number of outflows is the same across the two
sub0periods of which the latter does not include as many crises as does the former. Only in
Developing Asia are short0term debt outflows during a crisis period (1995099) succeeded by
long0term debt outflows in the next period. Being the most active region that has got ever0
increasing external debt funding, Europe and Central Asia saw outflows on its short0term
debt twice. First was during the Latin American debt crisis and the second was during the
sub0period 1990094 that includes several prominent transformations and upheavals like the
dissolution of the USSR, the Gulf War and the 1994 Turkish currency crisis.9 The retardation
processes in Latin America and Caribbean have been symmetrical in the sense that block
declines in all types of debt inflows have been preceded by the initial drops in short0term debt
inflows (disrupted by the corresponding crisis) that eventually turned out to be net outflows.
Being always positive and driving the flow of external lending after 1980s, short0term debt
flows to Africa and Middle East did not contribute to total debt outflows which are rather
produced by consecutive plummets in long0term debt flows to these regions.
Figure 8 shows the 370year progression of foreign borrowing in developing countries.
Within this period, total debt inflows have risen to about $225 billion which is less than even
half of the same0year value of total equity inflows in Figure 4 and just equal to the seventh
sub0period average of FDI in Table 3. This implies that the pace of increase in debt flows has
been much slower than equity flows. There are many factors that might have badly
influenced the influx of international debt capital to a developing economy. Deteriorating
macroeconomic fundamentals (like chronically high inflation rates, unsustainable internal and
external balances, inadequate foreign reserves etc.), debt overhang, credit rationing and
negative investor sentiments that either lead to financial crises or urge the economic agents to
reduce their indebtedness could be identified as the main factors. Besides these structural
failures, factors like asymmetric information, moral hazard and costly state verification that
9
14
are nearly intrinsic to the real functioning of international capital markets may create
systemic failures (or risks) that ultimately result in credit crunches.10
[Figure 8]
The effects of such factors could be traced explicitly in Figure 8. The steady increase in all
types of external borrowing of developing countries during 1970s has been depressed by the
Latin American debt crisis at the beginning of the next decade. Despite the fact that only
short0term debt gave outflows, the depression in every component lingered for almost a
decade. Apart from the curtailing in 1994 due to Mexican and Turkish currency crises, the
resumption in late 1980s has continued until the 1997 East Asian financial turmoil. The
outflows on short0term debt that approximately amounted to $45 billion in the following year
showed the first severe sign of the turmoil. As a result of the periodic and spatial contagion,
the net foreign borrowings (which have already been hampered) stopped completely and
recorded net reimbursements as of 2002. Thereafter, the final rebound came in and pushed
them to successively higher levels. Output shares of debt inflows have never repeated their
previous gains and levels and stayed below 3% in the majority of years. This is because the
valuation effects put a wedge between the nominal and scaled flows. It is clearer from the
line plots of the GDP proportioned series that short0term debt inflows go first in worsening0
recovery cycle around the crisis periods and long0term debt inflows engage in the cycle later.
They also indicate that long0term debt flows are at least as volatile as short0term debt flows.
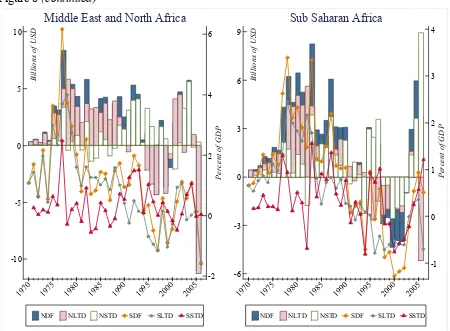
[Figure 9]
The allocation of international lending among the developing country groups is presented
in Figure 9. Rankings with respect to the nominal components shift within the top recipients.
Once the economic mass is taken into consideration, LAC outperforms the other regions in
receiving total and long0term debt. The SSTD bars which are nearly at the same length
indicate that developing countries weight short0term foreign borrowing by their wealth at
around 0.4. Overall, Sub0Saharan Africa has had the lowest share in global (private and non0
concessional) debt allocation. The larger the size of the economy the greater is the external
debt capital it raises. As a structural matter, long0term debt flows dominate short0term debt
flows and the latter is relatively closer to the former in SSA.
10
15
In general, real debt inflows are growing (Table 6). Europe and Central Asia has the
highest compound growth rates, whereas Middle East and North Africa has the lowest. In
income groups, upper middle income countries have the most firmly growing debt inflows.
Total debt flows to low income countries and long0term debt flows to lower middle income
countries shrink. As per components, short0term debt grows more rapidly than long0term
debt. Comparing Panel (b) in this table and in Table 4, acyclicality is less prevalent in debt
flows than it was in equity flows. The most striking observation is that Europe and Central
Asian debt flows (particularly short0term debt, at 5% significance level) are countercyclical.
This may safeguard economic entities in the region from the harms of excessive leverage that
they tend to have. Real debt flows to DA, LAC and LMIC are procyclical. Of the significant
cases, short0term debt flows are more (pro)cyclical than long0term debt flows.
[Table 6]
To give an idea about the cost and maturity structure of external borrowing in developing
countries, Figure 10 demonstrates time series plots and comparative graphs of weighted
average interest rates and years to maturity on new external debt commitments. Over 19700
2006, the global averages of annual interest rate on and maturity of a public or publicly
guaranteed loan have been about 6% and 18 years respectively. These figures, being
relatively worse than they were at the beginning, clue tightened international lending
conditions for developing countries over time.
[Figure 10]
The main distinction between interest and maturities is that they move in opposite
directions for the majority of years. The gap widens particularly around the crises in such a
way that as the interest rates hike years to maturity fall, putting the developing economy in
further jeopardy. This opposite movement implies an inverted (i.e. quasi0convex) yield curve
for the public or publicly guaranteed foreign credits. Higher growth rates of short0term debt
flows corroborate this inference because an inverted yield curve exists when the demand for
short0term funds (or the incentive to hold short0maturity securities) is greater than the
demand for long0term funds (or the incentive to hold long0maturity securities).11 The inverted
yield curve may also portend the rigidity in international money markets and the economic
recession in developing markets, which were all witnessed during or in the aftermath of the
Latin American and East Asian financial crises.
11
16
The reversion of interest rates, but not maturities (except for Latin America and
Caribbean), to their pre01975 levels in the final years constitutes the other distinction. This is
also discernible in the lower half of Panel (c) where the interest rate actively rises throughout
the first three sub0periods, peaks during the Latin American debt crisis and declines
thereafter. Maturity, however, shows limited changes after the initial drop. The variation of
maturities and interest rates across country groups mirrors the development objective behind
the global lending (the upper part of Panel (c)).
)"
This paper surveys the data on international capital flows to developing countries for the
period 197002006. Developing countries are represented by either the most aggregate group
of ‘all developing countries’, five geographical regions (Developing Asia, Europe and
Central Asia, Latin America and Caribbean, Middle East and North Africa and Sub0Saharan
Africa) or three income groups (upper middle income countries, lower middle income
countries and low income countries). Trends and developments in seven fundamental capital
flow aggregates (total capital flows, total debt flows, total equity flows, foreign direct
investment, foreign portfolio equity investment, long0term debt flows and short0term debt
flows) are discussed under different settings of these country groups. Because it is a review
paper that uses alternative measures to present and discuss the data for several spatial groups
and types of capital flow, it has a lengthy exposition.
Total net capital flows denominated in nominal US dollars have surged within about four
decades. They were driven by total debt inflows in 1970s and by total equity inflows from
1990s onwards. Rising gradually before 1990s, FDI0shaped total equity inflows have soared
thereafter due to financial globalization and liberalization. The overall increase in long0term
debt0driven total debt inflows has been less impressive, because not only the financial crises
outburst during the period (i.e. 1982 Latin American debt crisis, 1997 East Asian financial
crash and many other country crises) severely hit them but they were also decreased as a
result of voluntary and discretionary debt reduction policies. These crises dwarfed total
capital inflows and depressed total equity inflows as well. Increases in capital inflows as a
share of GDP have been more variable and modest. Nevertheless, similar episodes of ebb and
flow as well as the compositional features are observed (though less evidently) in GDP0
17
Among the regions, Latin America and Caribbean got the highest amount of foreign
capital relative to its wealth during the four decades. Africa and the Middle East were the
least popular developing market destinations. The other regions, Developing Asia and
particularly Europe and Central Asia, have been the growing external fund recipients.
There was a strong wealth bias in foreign capital flows to developing economies as the
18 $
! $ * % + ,
World Bank, and author’s depictions.
FDI denotes foreign direct investment and FPEI refers to foreign portfolio equity investment. Private nonguaranteed (PNG) debt comprises the external obligations of private debtors that are not guaranteed for repayment by a public entity of their country. Public and publicly guaranteed (PPG) debt covers the external obligations of public and private borrowers that are insured by a public entity. Bilateral creditors are governments and their agencies, including central banks, official export credit agencies and autonomous agencies. Multilateral creditors are international financial institutions such as the World Bank, regional development banks and other multilateral and intergovernmental agencies whose lending is administered on a multilateral basis. Commercial bank loans comprise loans from private banks and other private financial institutions. Bonds include publicly issued or privately placed bonds. Credits from ‘other’ private creditors contain credits by manufacturers, exporters and other suppliers of goods plus bank credits covered by a guarantee of an export credit agency. Foreign aid (i.e. concessional loans and grants), credits from the International Monetary Fund (IMF), non0residents’ deposits and interest arrears on all sorts of debt are excluded.
Total capital flows
Total equity flows
FDI
FPEI
Total debt flows
Short0term debt
Long0term debt
by debtor
PNG debt PPG debt
by creditor
Official creditors
Bilateral loans
Multilateral loans
Private creditors
Commercial bank loans
Bonds
19
$ ! $ - . / + 0
1 % !234.3( !23).32 !254.5( !25).52 !224.2( !22).22 #444.46
Total Capital Inflows 13.42
(2.0) 48.59 (3.9) 64.69 (2.0) 45.11 (1.2) 127.27 (3.1) 236.86 (4.2) 349.02 (4.0)
Total Equity Inflows 3.22
(0.5) 6.03 (0.5) 11.24 (0.3) 15.72 (0.4) 66.82 (1.6) 161.92 (2.8) 261.91 (3.1)
Total Debt Inflows 10.20
(1.5) 42.56 (3.4) 53.45 (1.7) 29.39 (0.8) 60.45 (1.5) 74.94 (1.3) 87.11 (0.9)
Total Capital Inflows 1.62
(0.6) 6.07 (1.4) 15.98 (2.4) 18.34 (2.0) 56.20 (4.5) 79.89 (4.0) 143.53 (4.0)
Total Equity Inflows 0.35
(0.1) 0.72 (0.2) 2.44 (0.4) 6.00 (0.7) 29.99 (2.3) 63.92 (3.2) 116.33 (3.3)
Total Debt Inflows 1.27
(0.5) 5.35 (1.2) 13.54 (2.0) 12.34 (1.4) 26.20 (2.2) 15.96 (0.8) 27.20 (0.7)
Total Capital Inflows 1.01
(n/a) 4.88 (n/a) 6.47 (0.5) 7.19 (0.4) 12.29 (1.7) 37.99 (3.6) 108.50 (5.6)
Total Equity Inflows 0.14
(n/a) 0.25 (n/a) 0.52 (0.04) 1.02 (0.1) 5.40 (0.7) 17.56 (1.7) 49.43 (2.6)
Total Debt Inflows 0.87
(n/a) 4.63 (n/a) 5.94 (0.5) 6.17 (0.4) 6.90 (1.1) 20.43 (1.9) 59.07 (3.0)
Total Capital Inflows 8.21
(3.3) 27.04 (5.6) 31.60 (4.0) 9.75 (1.2) 51.15 (3.8) 105.27 (5.4) 69.41 (3.2)
Total Equity Inflows 1.50
(0.7) 3.34 (0.7) 6.13 (0.8) 6.07 (0.8) 27.44 (2.0) 65.35 (3.4) 68.90 (3.2)
Total Debt Inflows 6.71
(2.7) 23.70 (4.9) 25.47 (3.2) 3.68 (0.5) 23.70 (1.8) 39.92 (2.1) 0.51 (00.03)
Total Capital Inflows 0.93
(1.9) 6.10 (4.5) 4.22 (1.8) 4.87 (1.8) 4.97 (1.9) 1.48 (0.4) 10.78 (2.0)
Total Equity Inflows 0.37
(0.7) 0.95 (0.7) 1.07 (0.5) 1.34 (0.5) 1.91 (0.7) 2.75 (0.7) 10.35 (1.8)
Total Debt Inflows 0.56
(1.2) 5.15 (3.8) 3.16 (1.4) 3.53 (1.3) 3.06 (1.2) 01.27 (00.3) 0.43 (0.2)
Total Capital Inflows 1.66
(1.9) 4.51 (2.6) 6.43 (2.5) 4.95 (1.8) 2.66 (0.9) 12.24 (3.7) 16.81 (3.1)
Total Equity Inflows 0.85
(1.0) 0.78 (0.5) 1.09 (0.4) 1.28 (0.5) 2.07 (0.7) 12.34 (3.7) 16.91 (3.4)
Total Debt Inflows 0.80
(0.9) 3.73 (2.1) 5.34 (2.1) 3.67 (1.4) 0.58 (0.2) 00.10 (00.03) 00.10 (00.3)
World Bank, ! " .
20
# 7 - 1 / !234.#446
# $ %
0 1 2 3 4 5 6
&
&
0 125 250 375 500 625 750
'
(
1970 1975 1980 1985 1990 1995 2000 2005
NCF NEF NDF SCF SEF SDF
All Developing Countries
02 01 0 1 2 3 4 5 6 7
&
&
040 0 40 80 120 160 200 240 280 320
'
(
1970 1975 1980 1985 1990 1995 2000 2005
NCF NEF NDF SCF SEF SDF
Developing Asia
0 2 4 6 8 10
&
&
0 55 110 165 220 275
'
(
1970 1975 1980 1985 1990 1995 2000 2005
NCF NEF NDF SCF SEF SDF
Europe and Central Asia
02 0 2 4 6 8
&
&
030 0 30 60 90 120
'
(
1970 1975 1980 1985 1990 1995 2000 2005
NCF NEF NDF SCF SEF SDF
21
Figure 2 # %
World Bank, ! " .
Bars show the levels of aggregate net capital flows which are in current U.S. dollars (left axis),
whilst lines indicate the percentage amounts for the same flows that are by current GDP (right axis). The
common letters, and , at the beginning of the legend labels denote ‘nominal’ and ‘scaled’ respectively. CF refers to (aggregate) capital flows, EF is equity flows and DF stands for debt flows. Only white bars exactly match their legends (both keys and labels), whereas light and dark shaded bars represent their labels partly. The true NCF for a year is the vertical sum of all the bars within that year and the true NEF is what remains from the white bar (NDF) in a certain year. Light shaded bars exhibit merely the amount of NEF in excess of NDF when both have the same signs and they show the whole NEF when the signs are opposite. See notes to Table 1.
02 0 2 4 6 8
&
&
07 0 7 14 21 28
'
(
1970 1975 1980 1985 1990 1995 2000 2005
NCF NEF NDF SCF SEF SDF
Middle East and North Africa
01 0 1 2 3 4 5 6
&
&
05 0 5 10 15 20 25 30 35
'
(
1970 1975 1980 1985 1990 1995 2000 2005
NCF NEF NDF SCF SEF SDF
22
& + + , 8 1 % ,
World Bank, ! " .
Geographical regions are Developing Asia (DA), Europe and Central Asia (ECA), Latin America and Caribbean (LAC), Middle East and North Africa (MENA), and Sub0Saharan Africa (SSA). Income groups refer to the World Bank’s classification of countries according to the level of 2009 GNI per capita, calculated using the World Bank Atlas method. From those mutually exclusive groups; included are upper middle income countries (UMIC) which are also known as emerging economies, lower middle income countries (LMIC) and low income countries (LIC). Capital flow component bars indicate the simple arithmetic averages for the corresponding region or income group. See also notes to Figure 2.
0 10 20 30 40 50
'
(
DA ECA LAC MENA SSA
(a) Geographical Regions, Nominal
NCF NEF NDF
0 1 2 3 4
&
&
DA ECA LAC MENA SSA
(b) Geographical Regions, Scaled
SCF SEF SDF
0 22 44 66 88 110
'
(
UMIC LMIC LIC
(c) Income Groups, Nominal
NCF NEF NDF
0 1 2 3
&
&
UMIC LMIC LIC
(d) Income Groups, Scaled
23
$ # , 8 + $ % 9
, 8 1 % ,
: 7 0: :
; < : , 8 ;9 <
) 12.58 21.68 174.14 24.51 945.40 30.11 17.12 69.22 220.01
) 14.34 19.30 55.74 15.58 28.56 90.44 21.47 18.87 86.17
) 40.88 35.97 67.95 170.00 08.23 42.35 178.85 37.91 064.20
& 5.42 4.34 2.39 3.89 4.83 2.57 4.12 3.42 0.84
) 13.28 11.99 8594.84 8.41 12.72 9.07 9.36 9.96 4.80
* 6.07 6.13 10.84 4.45 5.74 5.00 6.62 4.54 5.38
) 15.03 18.75 30.02 14.78 9.20 7.47 12.48 11.88 06.09
) 7.63 11.68 18.27 14.36 0.54 7.77 10.50 20.22 6.45
) 9.36 14.93 35.12 00.50 07.31 7.98 7.65 11.00 011.37
& 3.98 3.38 3.73 5.33 4.57 1.15 3.33 3.56 1.14
) 9.96 9.92 20.66 12.05 13.18 6.99 9.56 8.52 3.99
* 6.50 6.57 7.28 3.94 3.06 3.94 6.10 4.11 4.49
; < 8 1 , 9 , 8 ; ++ <
) 0.18
(0.30)
0.27 (0.11)
0.15 (0.46)
0.19 (0.27)
00.06 (0.73)
0.27 (0.11)
0.37 (0.02)
0.22 (0.20)
0.07 (0.69)
) 0.06
(0.74)
0.24 (0.16)
00.01 (0.95)
0.42 (0.01)
0.15 (0.37)
0.16 (0.36)
0.46 (0.00)
00.04 (0.82)
0.01 (0.94)
) 0.01
(0.94)
0.34 (0.04)
00.24 (0.23)
0.35 (0.04)
00.07 (0.68)
0.25 (0.15)
00.13 (0.45)
0.35 (0.04)
0.06 (0.74)
World Bank, ! " .
24
$ & ' - . / + 0
1 % !234.3( !23).32 !254.5( !25).52 !224.2( !22).22 #444.46
Total Equity Inflows 3.22
(0.5) 6.03 (0.5) 11.24 (0.3) 15.72 (0.4) 66.82 (1.6) 161.92 (2.8) 261.91 (3.1)
Direct Equity 3.22
(0.5) 6.01 (0.5) 11.14 (0.3) 15.26 (0.4) 51.14 (1.2) 144.72 (2.5) 224.72 (2.7)
Portfolio Equity 0.004
(0.0) 0.02 (0.0) 0.10 (0.0) 0.46 (0.0) 15.68 (0.4) 17.21 (0.3) 37.19 (0.4)
Total Equity Inflows 0.35
(0.1) 0.72 (0.2) 2.44 (0.4) 6.00 (0.7) 29.99 (2.3) 63.92 (3.2) 116.33 (3.3)
Direct Equity 0.35
(0.1) 0.72 (0.2) 2.41 (0.4) 5.49 (0.6) 26.80 (2.1) 59.63 (3.0) 91.74 (2.7)
Portfolio Equity n/a
(n/a) 0.002 (0.0) 0.03 (0.0) 0.51 (0.1) 3.19 (0.2) 4.29 (0.2) 24.59 (0.7)
Total Equity Inflows 0.14
(n/a) 0.25 (n/a) 0.52 (0.04) 1.02 (0.1) 5.40 (0.7) 17.56 (1.7) 49.43 (2.6)
Direct Equity 0.14
(n/a) 0.25 (n/a) 0.52 (0.04) 1.02 (0.1) 4.95 (0.6) 15.81 (1.5) 46.36 (2.5)
Portfolio Equity n/a
(n/a) n/a (n/a) n/a (n/a) 0.02 (0.0) 0.44 (0.1) 1.75 (0.2) 3.06 (0.1)
Total Equity Inflows 1.50
(0.7) 3.34 (0.7) 6.13 (0.8) 6.07 (0.8) 27.44 (2.0) 65.35 (3.4) 68.90 (3.2)
Direct Equity 1.50
(0.7) 3.34 (0.7) 6.13 (0.8) 5.92 (0.7) 15.44 (1.1) 60.19 (3.1) 64.61 (3.0)
Portfolio Equity n/a
(n/a) 0.00 (0.0) 0.003 (0.0) 0.15 (0.02) 12.00 (0.9) 5.16 (0.3) 4.28 (0.2)
Total Equity Inflows 0.37
(0.7) 0.95 (0.7) 1.07 (0.5) 1.34 (0.5) 1.91 (0.7) 2.75 (0.7) 10.35 (1.8)
Direct Equity 0.37
(0.7) 0.94 (0.7) 1.00 (0.4) 1.32 (0.5) 1.84 (0.7) 2.47 (0.7) 9.77 (1.7)
Portfolio Equity n/a
(n/a) 0.001 (0.0) 0.07 (0.03) 0.02 (0.01) 0.07 (0.03) 0.28 (0.1) 0.58 (0.1)
Total Equity Inflows 0.85
(1.0) 0.78 (0.5) 1.09 (0.4) 1.28 (0.5) 2.07 (0.7) 12.34 (3.7) 16.91 (3.4)
Direct Equity 0.85
(1.0) 0.76 (0.5) 1.08 (0.4) 1.52 (0.6) 2.11 (0.7) 6.61 (2.0) 12.23 (2.6)
Portfolio Equity 0.004
(0.0) 0.02 (0.01) 0.003 (0.0) 00.23 (00.1) 00.04 (00.01) 5.72 (1.7) 4.68 (0.8)
World Bank, ! " .
25
( 7 ' - 1 / !234.#446
# $ %
0 1 2 3 4 5
&
&
0 100 200 300 400 500
'
(
1970 1975 1980 1985 1990 1995 2000 2005
NEF NFDI NFPEI SEF SFDI SFPEI All Developing Countries
0 1 2 3 4 5
&
&
0 50 100 150 200 250
'
(
1970 1975 1980 1985 1990 1995 2000 2005
NEF NFDI NFPEI SEF SFDI SFPEI Developing Asia
0 1 2 3 4 5
&
&
0 25 50 75 100 125
'
(
1970 1975 1980 1985 1990 1995 2000 2005
NEF NFDI NFPEI SEF SFDI SFPEI Europe and Central Asia
0 1 2 3 4 5
&
&
0 20 40 60 80 100
'
(
1970 1975 1980 1985 1990 1995 2000 2005
26
Figure 4 # %
World Bank, ! " .
FDI refers to foreign direct investment and FPEI stands for foreign portfolio equity investment. The true NEF for a year is the vertical sum of all the bars within that year, while the true NFDI is what remains from the white bar (NFPEI) in a certain year. Light shaded bars exhibit the amount of NFDI in excess of NFPEI when both have the same signs and they show the whole NFDI when the signs are opposite. See notes to Figure 2.
0 1 2 3 4
&
&
0 7 14 21 28
'
(
1970 1975 1980 1985 1990 1995 2000 2005
NEF NFDI NFPEI SEF SFDI SFPEI Middle East and North Africa
0 1 2 3 4 5 6
&
&
0 5 10 15 20 25 30
'
(
1970 1975 1980 1985 1990 1995 2000 2005
27
) + ' + , 8 1 % ,
World Bank, ! " .
See notes to Figures 3 and 4.
0 9 18 27 36
'
(
DA ECA LAC MENA SSA
(a) Geographical Regions, Nominal
NEF NFDI NFPEI
0 .5 1 1.5 2
&
&
DA ECA LAC MENA SSA
(b) Geographical Regions, Scaled
SEF SFDI SFPEI
0 14 28 42 56 70
'
(
UMIC LMIC LIC
(c) Income Groups, Nominal
NEF NFDI NFPEI
0 .5 1 1.5
&
&
UMIC LMIC LIC
(d) Income Groups, Scaled
28
$ ( , 8 + ' % 9
, 8 1 % ,
: 7 0: :
; < : , 8 ;9 <
) 14.34 19.30 55.74 15.58 28.56 90.44 21.47 18.87 86.17
) ! 13.25 18.19 55.59 15.22 28.43 24.80 20.15 17.31 71.66
) & ! 587.63 377.06 75.53 112.79 140.21 073.7 146.53 865.43 1256.51
) 7.63 11.68 18.27 14.36 0.54 7.77 10.50 20.22 6.45
) ! 7.30 10.63 16.38 5.58 3.83 04.54 10.37 16.96 8.90
) & ! 58.72 34.31 58.74 15.13 6.65 13.74 61.60 69.31 13.73
; < 9 8 1 , 9 , 8
) 0.06
(0.74)
0.24 (0.16)
00.01 (0.95)
0.42 (0.01)
0.15 (0.37)
0.16 (0.36)
0.46 (0.00)
00.04 (0.82)
0.01 (0.94)
) ! 0.06
(0.74)
0.19 (0.27)
00.02 (0.94)
0.43 (0.01)
0.15 (0.38)
00.18 (0.30)
0.46 (0.00)
00.07 (0.68)
0.02 (0.90)
) & ! 0.00 (0.99)
00.24 (0.19)
00.01 (0.96)
0.38 (0.04)
0.09 (0.65)
0.30 (0.10)
00.04 (0.82)
00.14 (0.44)
00.27 (0.14)
World Bank, ! " .
29
6 8 + , % % 8 9 8 / !234.#446
World Bank, ! # !% and author’s calculations.
Gross domestic investment (GDI), or gross capital formation as in WDI, consists of outlays on additions to the fixed assets of the economy plus net changes in the level of inventories. Fixed assets include land improvements (fences, ditches, drains and so on), plant, machinery and equipment purchases and the construction of roads, railways and the like, including schools, offices, hospitals, private residential dwellings and commercial and industrial buildings. Inventories are stocks of goods held by firms to meet temporary or unexpected fluctuations in production or sales and work in progress. According to the United Nations’ (UN) System of National Accounts (SNA) in 1993, net acquisitions of valuables are also considered capital formation. Bars show arithmetic averages for the corresponding period or country group. See also notes to Figure 3.
0 2 4 6 8 10
&
!
ADC DA ECA LAC MENA SSA UMIC LMIC LIC
(a) Country Groups
0 3 6 9 12
&
!
1970074 1975079 1980084 1985089 1990094 1995099 2000006
30
3 9 : 8 9 8 / !25).#446
World Bank, ! # !% and author’s calculations.
Market capitalization (also known as market value) of domestically listed companies is the share price times the number of shares outstanding as of the yearend. Listed domestic companies are the domestically incorporated companies listed on the country's stock exchanges. Excluded are investment companies, mutual funds or other collective investment vehicles. The figure does not show the plots for income groups and some earlier sub0periods due to data unavailability. Bars demonstrate country group and period averages of FPEI that is expressed as percent of domestic stock market capitalization. See notes to Figure 6 as well.
0 .5 1 1.5
,
-.
ADC DA ECA LAC MENA SSA
(a) Country Groups
0 .5 1 1.5 2
,
-.
1970074 1975079 1980084 1985089 1990094 1995099 2000006
31
$ ) - . / + 0
1 % !234.3( !23).32 !254.5( !25).52 !224.2( !22).22 #444.46
Total Debt Inflows 10.20
(1.5) 42.56 (3.4) 53.45 (1.7) 29.39 (0.8) 60.45 (1.5) 74.94 (1.3) 87.11 (0.9)
Long0term Debt 8.52
(1.3) 31.35 (2.5) 46.71 (1.5) 21.50 (0.6) 38.06 (0.9) 64.41 (1.1) 40.85 (0.4)
Short0term Debt 2.10
(0.3) 11.21 (0.9) 6.74 (0.2) 7.89 (0.2) 22.39 (0.5) 10.53 (0.2) 46.26 (0.5)
Total Debt Inflows 1.27
(0.5) 5.35 (1.2) 13.54 (2.0) 12.34 (1.4) 26.20 (2.2) 15.96 (0.8) 27.20 (0.7)
Long0term Debt 1.00
(0.4) 3.57 (0.8) 10.09 (1.5) 9.97 (1.1) 16.77 (1.4) 17.28 (0.9) 00.62 (00.1)
Short0term Debt 0.34
(0.1) 1.78 (0.4) 3.45 (0.5) 2.37 (0.3) 9.43 (0.8) 01.32 (00.03) 27.82 (0.8)
Total Debt Inflows 0.87
(n/a) 4.63 (n/a) 5.94 (0.5) 6.17 (0.4) 6.90 (1.1) 20.43 (1.9) 59.07 (3.0)
Long0term Debt 0.70
(n/a) 3.92 (n/a) 6.31 (0.5) 3.45 (0.2) 8.42 (1.1) 14.01 (1.3) 40.62 (2.0)
Short0term Debt 0.21
(n/a) 0.71 (n/a) 00.37 (00.03) 2.72 (0.2) 01.52 (00.04) 6.42 (0.6) 18.45 (1.0)
Total Debt Inflows 6.71
(2.7) 23.70 (4.9) 25.47 (3.2) 3.68 (0.5) 23.70 (1.8) 39.92 (2.1) 0.51 (00.03)
Long0term Debt 5.72
(2.3) 16.77 (3.5) 22.87 (3.0) 3.29 (0.5) 11.94 (0.9) 37.52 (1.9) 2.39 (0.1)
Short0term Debt 1.24
(0.5) 6.94 (1.4) 2.60 (0.2) 0.39 (0.01) 11.77 (0.9) 2.40 (0.1) 01.87 (00.14)
Total Debt Inflows 0.56
(1.2) 5.15 (3.8) 3.16 (1.4) 3.53 (1.3) 3.06 (1.2) 01.27 (00.3) 0.43 (0.2)
Long0term Debt 0.50
(1.1) 4.28 (3.2) 3.15 (1.3) 3.06 (1.1) 0.48 (0.2) 02.72 (00.7) 00.49 (0.02)
Short0term Debt 0.07
(0.1) 0.87 (0.7) 0.01 (0.03) 0.47 (0.2) 2.58 (1.0) 1.44 (0.4) 0.92 (0.2)
Total Debt Inflows 0.80
(0.9) 3.73 (2.1) 5.34 (2.1) 3.67 (1.4) 0.58 (0.2) 00.10 (00.03) 00.10 (00.3)
Long0term Debt 0.62
(0.7) 2.81 (1.6) 4.29 (1.6) 1.73 (0.6) 0.46 (0.2) 01.69 (00.5) 01.05 (00.3)
Short0term Debt 0.23
(0.3) 0.92 (0.5) 1.05 (0.4) 1.94 (0.8) 0.13 (0.03) 1.59 (0.5) 0.95 (0.0)
World Bank, ! " .
32
5 7 - 1 / !234.#446
# $ %
01 0 1 2 3 4 5
&
&
045 0 45 90 135 180 225
'
(
1970 1975 1980 1985 1990 1995 2000 2005
NDF NLTD NSTD SDF SLTD SSTD All Developing Countries
03 02 01 0 1 2 3
&
&
040 020 0 20 40 60 80
'
(
1970 1975 1980 1985 1990 1995 2000 2005
NDF NLTD NSTD SDF SLTD SSTD Developing Asia
01 0 1 2 3 4 5 6
&
&
0 22 44 66 88 110 132 154
'
(
1970 1975 1980 1985 1990 1995 2000 2005
NDF NLTD NSTD SDF SLTD SSTD Europe and Central Asia
03 01.5 0 1.5 3 4.5 6
&
&
030 015 0 15 30 45 60
'
(
1970 1975 1980 1985 1990 1995 2000 2005
33
Figure 8 # %
World Bank, ! " .
LTD refers to long0term debt and STD stands for short0term debt. The true NDF for a year is the vertical sum of all the bars within that year, while the true NLTD is what remains from the white bar (NSTD) in a certain year. Light shaded bars exhibit merely the amount of NLTD in excess of NSTD when both have the same signs and they show the whole NLTD when the signs are opposite. Also see notes to Figure 2.
02 0 2 4 6
&
&
010 05 0 5 10
'
(
1970 1975 1980 1985 1990 1995 2000 2005
NDF NLTD NSTD SDF SLTD SSTD Middle East and North Africa
01 0 1 2 3 4
&
&
06 03 0 3 6 9
'
(
1970 1975 1980 1985 1990 1995 2000 2005
34
2 + + , 8 1 % ,
World Bank, ! " .
See notes to Figures 3 and 8.
0 6 12 18
'
(
DA ECA LAC MENA SSA
(a) Geographical Regions, Nominal
NDF NLTD NSTD
0 .5 1 1.5 2
&
&
DA ECA LAC MENA SSA
(b) Geographical Regions, Scaled
SDF SLTD SSTD
0 10 20 30 40
'
(
UMIC LMIC LIC
(c) Income Groups, Nominal
NDF NLTD NSTD
0 .5 1 1.5
&
&
UMIC LMIC LIC
(d) Income Groups, Scaled
35
$ 6 , 8 + % 9
, 8 1 % ,
: 7 0: :
; < : , 8 ;9 <
) 40.88 35.97 67.95 170.00 08.23 42.35 178.85 37.91 064.20
) * 09.22 9.15 52.17 12.49 033.31 48.65 44.21 01.23 10.03
) * 75.03 08.36 415.78 020.29 257.10 6.61 56.43 115.26 2050.81
) 9.36 14.93 35.12 00.50 07.31 7.98 7.65 11.00 011.37
) * 7.17 7.75 22.09 02.28 015.79 05.41 7.38 06.67 5.77
) * 21.02 1.62 46.82 43.43 20.85 3.89 33.84 32.22 19.08
; < 9 8 1 , 9 , 8
) 0.01
(0.94)
0.34 (0.04)
00.24 (0.23)
0.35 (0.04)
00.07 (0.68)
0.25 (0.15)
00.13 (0.45)
0.35 (0.04)
0.06 (0.74)
) * 0.10
(0.56)
0.19 (0.26)
00.19 (0.36)
0.30 (0.07)
00.04 (0.83)
0.26 (0.12)
0.26 (0.12)
0.37 (0.03)
0.05 (0.78)
) * 0.12
(0.49)
0.32 (0.06)
00.40 (0.04)
0.34 (0.05)
0.03 (0.85)
0.30 (0.08)
0.15 (0.38)
0.38 (0.02)
0.03 (0.88)
World Bank, ! " .