Demographic Factors Improve Classification Performance
Dirk Hovy
Center for Language Technology University of Copenhagen, Denmark
Njalsgade 140 [email protected]
Abstract
Extra-linguistic factors influence language use, and are accounted for by speakers and listeners. Most natural language pro-cessing (NLP) tasks to date, however, treat language as uniform. This assump-tion can harm performance. We investi-gate the effect of including demographic information on performance in a variety of text-classification tasks. We find that by including age or gender information, we consistently and significantly improve performance over demographic-agnostic models. These results hold across three text-classification tasks in five languages.
1 Introduction
When we use language, we take demographic factors of the speakers into account. In other words, we do have certain expectations as to who uses “super cute,” “rather satisfying,” or “rad, dude.” Sociolinguistics has long since studied the interplay between demographic factors and lan-guage use (Labov, 1964; Milroy and Milroy, 1992; Holmes, 1997; Macaulay, 2001; Macaulay, 2002; Barbieri, 2008; Wieling et al., 2011; Rickford and Price, 2013, inter alia).1 These factors greatly in-fluence word choice, syntax, and even semantics.
In natural language processing (NLP), however, we have largely ignored demographic factors, and treated language as a uniform medium. It was ir-relevant, (and thus not modeled) whether a text was produced by a middle-aged man, an elderly lady, or a teenager. These three groups, how-ever, differ along a whole host of demographic axes, and these differences are reflected in their language use.
1Apart from the demographic factors, other factors such
as mood, interpersonal relationship, authority, language atti-tude, etc. contribute to our perception of language.
A model that is agnostic to demographic dif-ferences will lose these distinctions, and perfor-mance suffers whenever the model is applied to a new demographic. Historically, the demograph-ics of training and test data (newswire) were rela-tively homogenous, language was relarela-tively uni-form, and information the main objective. Un-der these uniform conditions, the impact of demo-graphics on performance was small.
Lately, however, NLP is increasingly applied to other domains, such as social media, where language is less canonical, demographic informa-tion about the author is available, and the authors’ goals are no longer purely informational. The in-fluence of demographic factors in this medium is thus much stronger than on the data we have tra-ditionally used to induce models. The resulting performance drops have often been addressed via various domain adaptation approaches (Blitzer et al., 2006; Daume III and Marcu, 2006; Reichart and Rappoport, 2007; Chen et al., 2009; Daum´e et al., 2010; Chen et al., 2011; Plank and Moschitti, 2013; Plank et al., 2014; Hovy et al., 2015b, inter alia). However, the authors and target demograph-ics of social media differ radically from those in newswire text, and domain might in some case be a secondary effect to demographics. In this paper, we thus ask whether we also need demographic adaptation.
Concretely, we investigate
1. how we can encode demographic factors, and 2. what effect they have on the performance of
text-classification tasks
We focus on age and gender, and similarly to Bamman et al. (2014a), we use distributed word representations (embeddings) conditioned on these demographic factors (see Section 2.1) to incorporate the information.
We evaluate the effect of demographic informa-tion on classificainforma-tion performance in three NLP
tasks: sentiment analysis (Section 2.2), topic de-tection (Section 2.3), and author attribute classifi-cation (Section 2.4).2
We compare F1-performance of classifiers a)
trained with access to demographic information, or b) under agnostic conditions. We find that demographic-aware models consistently outper-form their agnostic counterparts in all tasks.
Our contributions
We investigate the effect of demographic fac-tors on classification performance. We show that NLP systems benefit from demographic aware-ness, i.e., that information about age and gender can lead to significant performance improvements in three different NLP tasks across five different languages.
2 Data
We use data from an international user review website, Trustpilot. It contains information both about the review (text and star rating), as well as the reviewer, in form of a profile. The profile in-cluded a screen name, and potentially information about gender and birth year.
Since demographic factors are extra-linguistic, we assume that the same effects hold irrespective of language. To investigate this hypothesis, we use data from several languages (Danish, French, and German) and varieties (American English, British English).
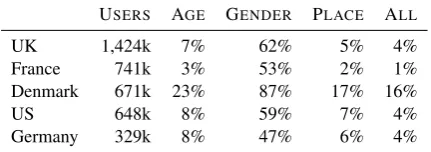
We use data from the countries with most users, i.e., Great Britain, Denmark, Germany, France, and the US. The selection was made based on the availability of sufficient amounts of training data (see Table 1 for more details). The high number of users in Denmark (one tenth of the country’s pop-ulation) might be due to the fact that Trustpilot is a Danish company and thus existed there longer than in other countries. Danish users also provide (in relative terms) more information about them-selves than users of any other country, so that even in absolute numbers, there is oftentimes more in-formation available than for larger countries like France or Germany, where users are more reluc-tant to disclose information.
While most of this profile information is vol-untary, we have good coverage for both age and
2We selected these tasks to represent a range of
text-classification applications, and based on the availability of suitable data with respect to target and demographic vari-ables.
USERS AGE GENDER PLACE ALL
UK 1,424k 7% 62% 5% 4%
France 741k 3% 53% 2% 1%
Denmark 671k 23% 87% 17% 16%
US 648k 8% 59% 7% 4%
[image:2.595.309.525.65.141.2]Germany 329k 8% 47% 6% 4%
Table 1: Number of users and % per variable per country (after applying augmentations).
gender. In case of missing gender values, we base a guess on the first name (if given), by choosing the gender most frequently associated with that name in the particular language. We do require that one gender is prevalent (accounting for 95% of all mentions), and that there is enough support (at least 3 attributed instances), though. For age, coverage is less dense, so the resulting data sets are smaller, but still sufficient.
For more information on Trustpilot as a re-source, see Hovy et al. (2015a).
We split each review into sentences, tokenize, replace numbers with a0, lowercase the data, and join frequent bigrams with an underscore to form a single token.
For each language, we collect four sub-corpora, namely two for gender (male and female) and two for age (under 35 and over 45). The sub-corpora for the discrete variable gender are rela-tively straightforward (although see (Bamman et al., 2014b)), but the split for the continuous age variable are less clear. While the effect of age on language use is undisputed (Barke, 2000; Barbieri, 2008; Rickford and Price, 2013), providing a clear cut-off is hard. We therefore use age ranges that result in roughly equally sized data sets for both groups, and that are not contiguous.
For each independent variable (age and gender), we induce embeddings for the two sub-groups (see section 2.1), as well as a “mixed” setting. We also extract labeled data for each task (see sections 2.2, 2.3, and 2.4). Each of these data sets is ran-domly split into training and test data, 60:40. Note that we donotset any parameters on development data, but instead use off-the-shelf software with default parameters for classification. Table 2 gives an overview of the number of training and test in-stances for each task and both variables (gender and age).
GENDER AGE
TASK COUNTRY TRAIN TEST TRAIN TEST
TOPIC
Denmark 72.48k 48.32k 26.89k 17.93k
France 33.34k 22.23k 3.67k 2.45k
Germany 18.35k 12.23k 4.82k 3.22k
UK 110.40k 73.60k 13.26k 8.84k
US 36.95k 24.63k 7.25k 4.84k
SENTIMENT
Denmark 150.29k 100.19k 45.18k 30.12k
France 40.38k 26.92k 3.94k 2.63k
Germany 17.35k 11.57k 3.52k 2.35k
UK 93.98k 62.65k 15.80k 10.53k
US 43.36k 28.91k 3.90k 2.60k
ATTRIBUTES
Denmark 180.31k 120.20k 180.31k 120.20k
France 10.69k 7.12k 10.69k 7.12k
Germany 11.47k 7.64k 11.47k 7.64k
UK 70.87k 47.25k 70.87k 47.25k
US 28.10k 18.73k 28.10k 18.73k
[image:3.595.138.463.61.338.2]total 918.32k 612.20k 429.66k 286.43k
Table 2: Number of sentences per task forgenderandageas independent variable
vocabulary of the tasks (there is some loss due to frequency cut-offs inword2vec). The out-of-vocabulary rate on the tasks is thus artificially low and can inflate results. In a standard “improve-ment over baseline”-setup, this would be problem-atic. However, the results should not be interpreted with respect to their absolute value on the respec-tive tasks, but with respect to the relarespec-tive differ-ences.
2.1 Conditional Embeddings
COUNTRY AGE GENDER
Denmark 495k 1.6m
France 36k 490k
Germany 47k 211k
UK 232k 1.63m
US 70k 576k
total 880k 4.51m
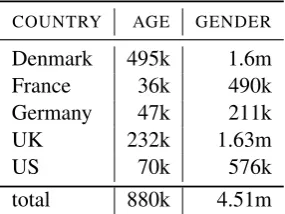
Table 3: Number of sentences used to induce em-beddings
Embeddings are distributed representations of words in a vector space, capturing syntactic and semantic regularities among the words. We
learn our word embeddings by usingword2vec3 (Mikolov et al., 2013) on unlabeled review data. Our corpora are relatively small, compared to the language modeling tasks the tool was developed for (see Table 3 for the number of instances used for each language and variable). We thus follow the suggestions in theword2vecdocumentation and use the skip-gram model and hierarchical soft-max rather than the standard continuous-bag-of-words model. This setting penalizes low-frequent words less. All out-of-vocabulary (OOV) words are replaced with an “unknown” token, which is represented as the averaged vector over all other words.
In this paper, we want to use embeddings to capture group-specific differences. We therefore train embeddings on each of the sub-corpora (e.g.,male,female, andU35,O45) separately. As comparison, we create a mixed setting. For each variable, we combine half of both sub-corpora (say, men and women) to form a third corpus with no demographic distinction. We also train embeddings on this data. This setting assumes that there are no demographic differences, which is the common approach in NLP to date.
Since embeddings depend crucially on the
[image:3.595.110.253.560.667.2]size of the available training data, and since we want to avoid modeling size effects, we balance the three corpora we use to induce embeddings such that all three contain the same number of instances.4
Note that while we condition the embeddings on demographic variables, they arenot task-specific. While general-purpose embeddings are widely used in the NLP community, task-specific embed-dings are known to lead to better results for var-ious tasks, including sentiment analysis (Tang et al., 2014). Inducing task-specific embeddings car-ries the risk of overfitting to a task and data set, though, and would make it harder to attribute per-formance differences to demographic factors.
Since we are only interested in therelative dif-ference between demographic-aware and unaware systems, not in the absolute performance on the tasks, we do not use task-specific embeddings.
2.2 Sentiment Analysis
Sentiment analysis is the task of determining the polarity of a document. In our experiments, we use three polarity values: positive, negative, and neutral. To collect data for the sentiment analysis task, we select all reviews that contain the target variable (gender or age), and a star-rating. Fol-lowing previous work on similar data (Blitzer et al., 2007; Hardt and Wulff, 2012; Elming et al., 2014), we use one, three, or five star ratings, cor-responding to negative, neutral, and positive senti-ment, respectively.
We balance the data sets so that both training and test set contain equal amounts of all three la-bels. We do this in order to avoid demographic-specific label distributions (women and people over 45 tend to give more positive ratings than men and people under 35, see Section 3.1).
2.3 Topic Identification
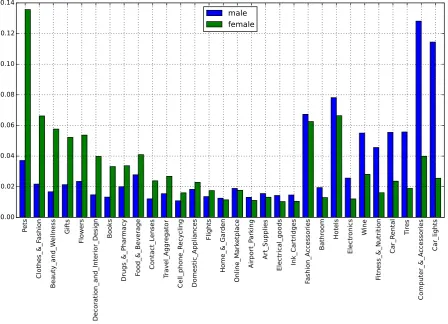
Topic identification is the task of assigning a high-level concept to a document that captures its con-tent. In our case, the topic labels are taken from the Trustpilot taxonomy for companies (e.g., Elec-tronics,Pets, etc.). Again, there is a strong gender bias: the most common topic for men isComputer & Accessories, the most common topic among women is Pets. There is thus considerably less overlap between the groups than for the other
4Note, however, that the vocabulary sizes still vary among
languages and between age and gender.
tasks. In order not to model gender-specific topic bias and to eliminate topic frequency as a con-founding factor, we restrict ourselves to the five most frequent labels that occur in both groups. We also ensure that we have the same number of ex-amples for each label in both groups. However, in the interest of data size, we do not enforce a uniform distribution over the five labels (i.e., the classes are not balanced).
2.4 Author Attribute Identification
Author attribute identification is the task of infer-ring demographic factors from linguistic features (Alowibdi et al., 2013; Ciot et al., 2013; Liu and Ruths, 2013). It is often used in author profiling (Koppel et al., 2002) and stylometrics (Goswami et al., 2009; Sarawgi et al., 2011). Rosenthal and McKeown (2011) have shown that these attributes are correlated.
In this paper, we restrict ourselves to using gen-der to predict age, and age to predict gengen-der. This serves as an additional test case. Again, we bal-ance the class labels to minimize the effect of any confounding factors.
3 Experiments 3.1 Data Analysis
Before we analyze the effect of demographic differences on NLP performance, we investigate whether there is an effect on the non-linguistic cor-relates, i.e., ratings and topics. To measure the in-fluence of demographic factors on these values, we quantify the distributions over the three sentiment labels and the five topic labels. We analyze both gender and age groups separately, but in the inter-est of space average across all languages.
negativ e
neutral positive
0 20 40 60 80 100
[image:4.595.328.502.589.720.2]male female
nega tive
neut ral
posit ive
0 10 20 30 40 50 60 70 80 90
[image:5.595.94.270.71.206.2]U35 O45
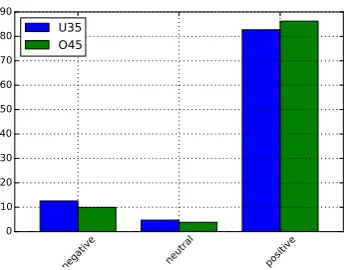
Figure 2: Label distribution for age groups
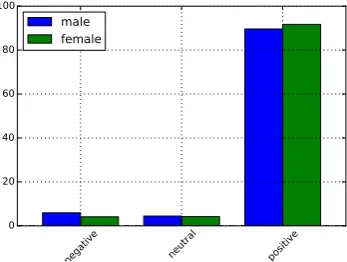
Figures 1 and 2 show the distributions over sentiment labels. We note that men give more negative and fewer positive ratings than women. The same holds for people in the younger group, who are more skewed towards negative ratings than people in the older group. While the differ-ences are small, they suggest that demographics correlate with rating behavior have a measurable effect on model performance.
The gender distributions over categories ex-hibit a very different tendency. Table 3 shows that the review categories (averaged over all languages) are highly gender-specific. With the exception ofHotelsandFashion Accessories, the two distributions are almost bimodal opposites. However, they are still significantly correlated (Spearmanρis 0.49 atp <0.01).
The difference in the two distributions illus-trates why we need to control for topic frequency in our experiments.
3.2 Models
Classifiers For all tasks, we use logistic regres-sion models5with standard parameter settings. In order to isolate the effect of demographic dif-ferences on performance in all text classification tasks, we need to represent variable length doc-uments based only upon the embeddings of the words they contain.
We follow Tang et al. (2014) in using convo-lutional layers over word embeddings (Collobert et al., 2011) to generate fixed-length input repre-sentations. Figure 4 schematically shows the pro-cedure for the minimum of a 4-dimensional toy
5http://scikit-learn.org/stable/ modules/generated/sklearn.linear_model. LogisticRegression.html
example. For each instance, we collect five N -dimensional statistics over the t by N input ma-trix, whereN is the dimensionality of the embed-dings (here: 100), andt is the sentence length in words.
From the matrix representation, we compute the dimension-wise minimum, maximum, and mean representation, as well as one standard deviation above and below the mean. We then concate-nate those five 100-dimensional vectors to a 500-dimensional vector thats represents each instance (i.e., review) as input to the logistic regression classifier.
Taking the maximum and minimum across all embedding dimensions is equivalent to represent-ing the exterior surface of the “instance manifold” (the volume in embedding space within which all words in the instance reside). Adding the mean and standard deviation summarizes the density per-dimension within the manifold. This way, we can represent any input sentence solely based on the embeddings, and with the same feature vector dimensionality.
that was cool
0.1
0.8
0.2
0.4 0.4
0.5
0.6
0.3 0.9
0.6
0.7
0.2
0.1
0.5
0.2
0.2 min()
0.9
0.8
0.7
0.4 max()
0.46
0.63
0.5
0.3 mean()
0.14
0.5
0.28
0.22 -std()
0.8
0.76
0.72
0.38 +std()
Figure 4: Example for deriving embedding statis-tics from sentence in 4-dimensional space. Mini-mum shaded
The approach is the same for all three tasks, and we did not tune any parameters to maximize per-formance. The results are thus maximally compa-rable to each other, albeit far from state-of-the-art. Overall performance could be improved with task-specific features and more sophisticated models, but it would make the results less comparable, and complicate identifying the source of performance differences. We leave this for future research.
Comparison In order to compare demographic-aware and agnostic models, we use the following setup for each task and language:
[image:5.595.310.525.387.470.2]fe-Pe ts Clo the s_& _Fa sh ion Be au ty_a nd _W ell ne ss Gif ts Flo we rs De co rat ion _a nd _In ter ior _De sig n Bo ok s Dr ug s_& _Ph arm ac y Fo od _& _Be ve rag e Co nta ct_L en se s Tra ve l_A gg reg ato r Ce ll_p ho ne _R ec yc lin g Do me sti c_A pp lia nc es Fli gh ts Ho me _& _G ard en On lin e_M ark etp lac e Air po rt_P ark ing Ar t_S up pli es Ele ctr ica l_g oo ds Ink _C art rid ge s Fa sh ion _A cc esso rie s Ba thr oo m Ho tel s Ele ctr on ics Wi ne Fit ne ss_& _Nu tri tio n Ca r_R en tal Tir es Co mp ute r_& _A cc esso rie s Ca r_l igh ts 0.00 0.02 0.04 0.06 0.08 0.10 0.12 0.14
male
female
Figure 3: Distribution of the 30 most frequent categories per gender over all languages
male) and group-agnostic training data (i.e., data that contains an equal amount of in-stances from either sub-group).
2. In thedemographic-awaresetting, we train a logistic-regression model for each of the two sub-groups (e.g., male and female). For each sub-group, we use the group-specific embed-dings (i.e., embedembed-dings induced on, say, male data) and group-specific training data (i.e., instances collected from male data).
We measure F1-performance for both settings
(agnostic and demographic-aware) on the test set. The test data contains an equal amount of in-stances from both sub-groups (say, male and fe-male). We use the demographic-aware classifier appropriate for each instance (e.g., male classi-fier for male instances), i.e., we assume that the model has access to this information. For many user-generated content settings, this is realistic, since demographic informationisavailable. How-ever, we only predict the target variable (senti-ment, topic, or author attribute). We donotrequire
the model to predict the sub-group (age or gender group).
We assume that demographic factors hold irrespective of language. We thus compute a
macro-F1 over all languages. Micro-F1 would
favor languages for which there is more data available, i.e., performance on those languages would dominate the average performance. Since we do not want to ascribe more importance to any particular language, macro-F1 is more
appropriate.
Even if there is a difference in performance between the agnostic and aware settings, this dif-ference could still be due to the specific data set. In order to test whether the difference is also sta-tistically significant, we use abootstrap-sampling test. In a bootstrap-sampling test, we sample subsets of the predictions of both settings (with replacement) 10,000 times. For each sample, we measure F1 of both systems, and compare
SENTIMENTANALYSIS TOPICCLASSIFICATION AGECLASSIFICATION
COUNTRY AGNOSTIC AWARE AGNOSTIC AWARE AGNOSTIC AWARE
Denmark 61.75 ∗62.00 49.19 ∗50.08 59.94 ∗60.22
France 61.21 61.09 38.45 ∗39.33 53.85 54.21
Germany 60.50 61.36 60.45 61.11 60.19 60.20
UK 65.22 65.12 66.02 66.26 59.78 ∗60.35
US 60.94 61.24 65.64 65.37 61.97 62.68
[image:7.595.87.510.68.195.2]avg 61.92 62.16 55.95 56.43 59.15 59.53
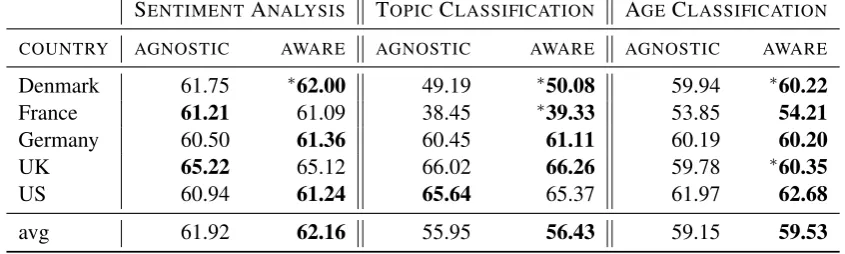
Table 4:F1 forgender-aware and agnostic models on tasks. Averages are macro average.∗ :p <0.05
the sample winner differs from the entire data set, divided by 10,000, is the reported p-value. Bootstrap-sampling essentially simulates runs of the two systems on different data sets. If one system outperforms the other under most of these conditions (i.e., the test returns a lowp-value), we can be reasonably sure that the difference is not due to chance.
As discussed in Berg-Kirkpatrick et al. (2012) and Søgaard et al. (2014), this test is the most ap-propriate for NLP data, since it does not make any assumptions about the underlying distributions, and directly takes performance into account. Note that the test still depends on data size, though, so that small differences in performance on larger data sets can be significant, while larger differ-ences on small sets might not.
We test for significance with the standard cutoff of p < 0.05. However, even under a bootstrap-sampling test, we can only limit the number of likely false positives. If we run enough tests, we increase the chance of reporting a type-I error. In order to account for this effect, we use Bonferroni corrections for each of the tasks.
4 Results
For each task, we compare the demographic-aware setting to an agnostic setting. The latter is equiva-lent to the currently common approach in NLP. For each task and language, the setting with the higher performance is marked in bold. Statistically sig-nificant differences (atp <0.05) are marked with a star (∗). Note that for the macro-averaged scores,
we cannot perform bootstrap significance testing.
4.1 Gender
Table 4 shows theF1scores for the different tasks.
In the left column of each task (labeled AGNOS
-TIC), the system is trained on embeddings and data frombothgenders, in the same ratios as in the test data. This column is similar to the configuration normally used in NLP to date, where – at least in theory – data comes from a uniformly distributed sample.
In the right column (labeled AWARE), the classification is based on the classifier trained on embeddings and data from the respective gender.
While the improvements are small, they are consistent. We do note some variance in consis-tency across tasks.
The largest average improvement among the three tasks is on topic classification. This improve-ment is interesting, since we have seen stark dif-ferences for the topic distribution between gen-ders. Note, however that we controlled for this factor in our experiments (cf. Table 3). The re-sults thus show that taking gender into account improves topic classification performance even af-tercontrolling for prior topic distribution as a con-founding factor.
The improvements in age classification are the most consistent. This consistency is likely due to the fact that author attributes are often corre-lated. The fact that the attributes are related can be exploited in stacking approaches, where the at-tributes are predicted together.
SENTIMENTANALYSIS TOPICCLASSIFICATION GENDERCLASSIFICATION
COUNTRY AGNOSTIC AWARE AGNOSTIC AWARE AGNOSTIC AWARE
Denmark 58.74 59.12 45.11 46.00 58.82 58.97
France 53.50 53.40 43.54 42.64 54.64 54.24
Germany 51.91 52.83 ∗56.91 55.41 54.04 54.51
UK 59.72 ∗60.83 59.40 ∗60.88 57.69 ∗58.25
US 55.57 56.00 61.14 61.38 60.05 60.97
avg 55.89 56.44 53.22 53.26 57.05 57.59
Table 5:F1forage-aware and agnostic models on tasks. Averages are macro average.∗ :p <0.05
4.2 Age
Table 5 presents the results for systems with age as independent demographic variable. Again, we show the difference between the agnostic and age-aware setting in parallel columns for each task.
The improvements are similar to the ones for gender. The smaller magnitude across tasks indicates that knowledge of age offers less dis-criminative power than knowledge of gender. This in itself is an interesting result, suggesting that the age gap is much smaller than the gender gap when it comes to language variation (i.e., older people’s language is more similar to younger people than the language of men is to women). The difference between groups could be a domain-effect, though, caused by the fact that all subjects are using a form of “reviewese” when leaving their feedback. Why this effect would be more prevalent across ages than across genders is not obvious from the data.
When averaged over all languages, the age-aware setup again consistently outperforms the ag-nostic setup, as it did for gender. While the final numbers are lower than in the gender setting, av-erage improvements tend to be just as decisive.
5 Related Work
Most work in NLP that has dealt with demo-graphic factors has either a) looked at the corre-lation of socio-economic attributes with linguis-tic features (Eisenstein et al., 2011; Eisenstein, 2013a; Eisenstein, 2013b; Doyle, 2014; Bamman et al., 2014a; Eisenstein, to appear), or b) used lin-guistic features to infer socio-economic attributes (Rosenthal and McKeown, 2011; Nguyen et al., 2011; Alowibdi et al., 2013; Ciot et al., 2013; Liu
and Ruths, 2013; Bergsma et al., 2013; Volkova et al., 2015).
Our approach is related to the work by Eisen-stein (2013a) and Doyle (2014), in that we in-vestigate the influence of extralinguistic factors. Both of them work on Twitter and use geocoding information, whereas we focus on age and gen-der. Also, rather than correlating with census-level statistics, as in (Eisenstein et al., 2011; Eisenstein, 2013a; Eisenstein, to appear), we take individual information of each author into account.
Volkova et al. (2013) also explore the influence of gender and age on text-classification. They include demographic-specific features into their model and show improvements on sentiment anal-ysis in three languages. Our work extends to more languages and three different text-classification tasks. We also use word representations trained on corpora from the various demographic groups, rather than incorporating the differences explicitly as features in our model.
Recently, Bamman et al. (2014a) have shown how regional lexical differences (i.e.,situated lan-guage) can be learned and represented via dis-tributed word representations (embeddings). They evaluate the conditional embeddings intrinsically, to show that the regional representatives of sports teams, parks, etc. are more closely associated with the respective hypernyms than other representa-tives. We also use embeddings conditioned on de-mographic factors (age and gender instead of loca-tion), but evaluate their effect on performance ex-trinsically, when used as input to an NLP system, rather than intrinsically (i.e., for discovering cor-relations between language use and demographic statistics).
We follow their methodology in using embeddings to represent variable length inputs for classifica-tion.
The experiments on author attribute identifi-cation are inspired by a host of previous work (Rosenthal and McKeown, 2011; Nguyen et al., 2011; Alowibdi et al., 2013; Ciot et al., 2013; Liu and Ruths, 2013; Volkova et al., 2015, in-ter alia). The main difference is that we use em-beddings trained on another demographic variable rather than n-gram based features, and that our goal is not to build a state-of-the-art system.
6 Discussion
The results in Section 4 have shown that incor-porating information on age and gender improves performance across a host of text-classification tasks. Even though the improvements are small and vary from task to task, they hold consistently across three tasks and languages. The magnitude of the improvements could be improved by using task-specific embeddings, additional features, and more sophisticated models. This would obscure the influence of the individual factors, though.
The observed improvements are solely due to the fact that different demographic groups use lan-guage quite differently. Sociolinguistic research suggests that younger people and women tend to be more creative in their language use than men and older groups. The former are thus of-ten the drivers of language change (Holmes, 2013; Nguyen et al., 2014). Modeling language as uni-form loses these distinctions, and thus causes per-formance drops.
As NLP systems are increasingly used for busi-ness intelligence and decision making, systematic performance differences carry the danger of dis-advantaging minority groups whose language use differs from the norm.
7 Conclusion
In this paper, we investigate the influence of age and gender on topic identification, sentiment anal-ysis, and author attribute identification. We induce embeddings conditioned on the respective demo-graphic variable and use those embeddings as sole input to classifiers to build both demographic-agnostic and aware models. We evaluate our mod-els on five languages.
Our results show that the models using de-mographic information perform on average better
than the agnostic models. The improvements are small, but consistent, and in 8/30 cases, also statis-tically significant atp < 0.05, according to boot-strap sampling tests.
The results indicate that NLP systems can im-prove classification performance by incorporat-ing demographic information, where available. In most of situated texts (social media, etc.), this is the case. While the improvements vary among tasks, the results suggest that similar to domain adaptation, we should start addressing the problem ofdemographicadaptation in NLP.
Acknowledgements
Thanks to ˇZeljko Agi´c, David Bamman, Jacob Eisenstein, Stephan Gouws, Anders Johannsen, Barbara Plank, Anders Søgaard, and Svitlana Volkova for their invaluable feedback, as well as to the anonymous reviewers, whose comments helped improve the paper. The author was sup-ported under ERC Starting Grant LOWLANDS No. 313695.
References
Jalal S Alowibdi, Ugo A Buy, and Philip Yu. 2013. Empirical evaluation of profile characteristics for gender classification on twitter. InMachine Learn-ing and Applications (ICMLA), 2013 12th Interna-tional Conference on, volume 1, pages 365–369. IEEE.
David Bamman, Chris Dyer, and Noah A. Smith. 2014a. Distributed representations of geographi-cally situated language. InProceedings of the 52nd Annual Meeting of the Association for Computa-tional Linguistics, pages 828–834. Proceedings of ACL.
David Bamman, Jacob Eisenstein, and Tyler Schnoe-belen. 2014b. Gender identity and lexical varia-tion in social media. Journal of Sociolinguistics, 18(2):135–160.
Federica Barbieri. 2008. Patterns of age-based lin-guistic variation in American English. Journal of sociolinguistics, 12(1):58–88.
Broadly improving user classification via communication-based name and location clustering on twitter. InHLT-NAACL, pages 1010–1019. John Blitzer, Ryan McDonald, and Fernando Pereira.
2006. Domain adaptation with structural correspon-dence learning. InProceedings of EMNLP.
John Blitzer, Mark Dredze, and Fernando Pereira. 2007. Biographies, Bollywood, Boom-boxes and Blenders: Domain Adaptation for Sentiment Clas-sification. InProceedings of ACL.
Bo Chen, Wai Lam, Ivor Tsang, and Tak-Lam Wong. 2009. Extracting discriminative concepts for do-main adaptation in text mining. InKDD.
Minmin Chen, Killiang Weinberger, and John Blitzer. 2011. Co-training for domain adaptation. InNIPS. Morgane Ciot, Morgan Sonderegger, and Derek Ruths.
2013. Gender inference of twitter users in non-english contexts. InProceedings of the 2013 Con-ference on Empirical Methods in Natural Language Processing, Seattle, Wash, pages 18–21.
Ronan Collobert, Jason Weston, L´eon Bottou, Michael Karlen, Koray Kavukcuoglu, and Pavel Kuksa. 2011. Natural language processing (almost) from scratch. The Journal of Machine Learning Re-search, 12:2493–2537.
Hal Daum´e, Abhishek Kumar, and Avishek Saha. 2010. Frustratingly easy semi-supervised domain adaptation. In ACL Workshop on Domain Adapta-tion for NLP.
Hal Daume III and Daniel Marcu. 2006. Domain adap-tation for statistical classifiers. Journal of Artificial Intelligence Research, 26:101–126.
Gabriel Doyle. 2014. Mapping dialectal variation by querying social media. InEACL.
Jacob Eisenstein, Noah Smith, and Eric Xing. 2011. Discovering sociolinguistic associations with struc-tured sparsity. InProceedings of ACL.
Jacob Eisenstein. 2013a. Phonological factors in so-cial media writing. InWorkshop on Language Anal-ysis in Social Media, NAACL.
Jacob Eisenstein. 2013b. What to do about bad lan-guage on the internet. InProceedings of NAACL. Jacob Eisenstein. to appear. Systematic patterning
in phonologically-motivated orthographic variation. Journal of Sociolinguistics.
Jakob Elming, Barbara Plank, and Dirk Hovy. 2014. Robust cross-domain sentiment analysis for low-resource languages. InProceedings of the 5th Work-shop on Computational Approaches to Subjectivity, Sentiment and Social Media Analysis, pages 2–7, Baltimore, Maryland, June. Association for Compu-tational Linguistics.
Sumit Goswami, Sudeshna Sarkar, and Mayur Rustagi. 2009. Stylometric analysis of bloggers’ age and gender. InThird International AAAI Conference on Weblogs and Social Media.
Daniel Hardt and Julie Wulff. 2012. What is the mean-ing of 5*’s? an investigation of the expression and rating of sentiment. InEmpirical Methods in Natu-ral Language Processing, page 319.
Janet Holmes. 1997. Women, language and identity. Journal of Sociolinguistics, 1(2):195–223.
Janet Holmes. 2013. An introduction to sociolinguis-tics. Routledge.
Dirk Hovy, Anders Johannsen, and Anders Søgaard. 2015a. User review-sites as a source for large-scale sociolinguistic studies. InProceedings of WWW. Dirk Hovy, Barbara Plank, H´ector Mart´ınez Alonso,
and Anders Søgaard. 2015b. Mining for unambigu-ous instances to adapt pos taggers to new domains. InProceedings of NAACL-HLT.
Moshe Koppel, Shlomo Argamon, and Anat Rachel Shimoni. 2002. Automatically categorizing writ-ten texts by author gender. Literary and Linguistic Computing, 17(4):401–412.
William Labov. 1964. The social stratification of En-glish in New York City. Ph.D. thesis, Columbia uni-versity.
Wendy Liu and Derek Ruths. 2013. What’s in a name? using first names as features for gender inference in twitter. InAnalyzing Microtext: 2013 AAAI Spring Symposium.
Ronald Macaulay. 2001. You’re like ‘why not?’ the quotative expressions of glasgow adolescents. Jour-nal of Sociolinguistics, 5(1):3–21.
Ronald Macaulay. 2002. Extremely interesting, very interesting, or only quite interesting? adverbs and social class. Journal of Sociolinguistics, 6(3):398– 417.
Tomas Mikolov, Kai Chen, Greg Corrado, and Jef-frey Dean. 2013. Efficient estimation of word representations in vector space. arXiv preprint arXiv:1301.3781.
Lesley Milroy and James Milroy. 1992. Social net-work and social class: Toward an integrated soci-olinguistic model. Language in society, 21(01):1– 26.
Dong Nguyen, Dolf Trieschnigg, A. Seza Dogru¨oz, Ri-lana Gravel, Mariet Theune, Theo Meder, and Fran-ciska De Jong. 2014. Predicting Author Gender and Age from Tweets: Sociolinguistic Theories and Crowd Wisdom. InProceedings of COLING 2014. Barbara Plank and Alessandro Moschitti. 2013.
Em-bedding semantic similarity in tree kernels for do-main adaptation of relation extraction. In Proceed-ings of ACL.
Barbara Plank, Dirk Hovy, Ryan McDonald, and An-ders Søgaard. 2014. Adapting taggers to twitter with not-so-distant supervision. InProceedings of COLING. COLING.
Roi Reichart and Ari Rappoport. 2007. Self-training for enhancement and domain adaptation of statistical parsers trained on small datasets. InProceedings of ACL.
John Rickford and Mackenzie Price. 2013. Girlz ii women: Age-grading, language change and stylistic variation. Journal of Sociolinguistics, 17(2):143– 179.
Sara Rosenthal and Kathleen McKeown. 2011. Age prediction in blogs: A study of style, content, and online behavior in pre-and post-social media genera-tions. InProceedings of the 49th Annual Meeting of the Association for Computational Linguistics: Hu-man Language Technologies-Volume 1, pages 763– 772. Association for Computational Linguistics. Ruchita Sarawgi, Kailash Gajulapalli, and Yejin Choi.
2011. Gender attribution: tracing stylometric evi-dence beyond topic and genre. In Proceedings of the Fifteenth Conference on Computational Natural Language Learning, pages 78–86. Association for Computational Linguistics.
Anders Søgaard, Anders Johannsen, Barbara Plank, Dirk Hovy, and H´ector Mart´ınez Alonso. 2014. What’s in a p-value in nlp? In Proceedings of the Eighteenth Conference on Computational Natural Language Learning, pages 1–10, Ann Arbor, Michi-gan, June. Association for Computational Linguis-tics.
Duyu Tang, Furu Wei, Nan Yang, Ming Zhou, Ting Liu, and Bing Qin. 2014. Learning sentiment-specific word embedding for twitter sentiment clas-sification. InProceedings of the 52nd Annual Meet-ing of the Association for Computational LMeet-inguis- Linguis-tics, pages 1555–1565.
Svitlana Volkova, Theresa Wilson, and David Yarowsky. 2013. Exploring demographic language variations to improve multilingual sentiment anal-ysis in social media. In Proceedings of EMNLP, pages 1815–1827.
Svitlana Volkova, Yoram Bachrach, Michael Arm-strong, and Vijay Sharma. 2015. Inferring latent user properties from texts published in social media
(demo). InProceedings of the Twenty-Ninth Confer-ence on Artificial IntelligConfer-ence (AAAI), Austin, TX, January.