Attribution of Customers’ Actions Based
on Machine Learning Approach
Kadyrov, Timur and Ignatov, Dmitry I.
National Research University Higher School of Economics, Russian
Federation, St. Petersburg Department of Steklov Mathematical
Institute of Russian Academyof Sciences, Russia
23 September 2019
Machine Learning Approach
⋆Timur Kadyrov1 and Dmitry I. Ignatov1,2
1 National Research University Higher School of Economics, Russian Federation
[email protected] http://www.hse.ru
2 St. Petersburg Department of Steklov Mathematical Institute of Russian Academy
of Sciences, Russia
Abstract. A multichannel attribution model based on gradient boost-ing over trees is proposed, which was compared with the state of the art models: bagged logistic regression, Markov chains approach, shapely value. Experiments on digital advertising datasets showed that the pro-posed model is better than the solutions considered by ROC AUC metric. In addition, the problem of probability prediction of conversion by the consumer using the ensemble of the analyzed algorithms was solved, the meta-features obtained were enriched with consumers and offline activities of the advertising campaign data.
Keywords: Multi-touch attribution, Gradient boosting, Digital adver-tising, Data-driven marketing
1
Introduction
In recent years, the volume of advertising on the Internet has begun to reach the volume of advertising on television [1,3], which together makes up 80% of the advertising market. According to the annual issue of the World Survey of the Entertainment and Media Industry, we should expect a decrease in the share of television advertising and a significant increase in the share of online advertising by 2021 [7]. Changes in the advertising and marketing industries are encour-aging advertisers to pay particular attention to researching online advertising campaigns. One of the effective methods of researching advertising campaigns on the Internet is multichannel attribution. In the past decade, due to the lack of data on advertising campaigns, methods based on intuition and heuristics were used to solve the multichannel attribution problem, which did not always give adequate results. Currently, each advertiser uses the services of advertising servers, which allow counting the number of user interactions with advertising, such as impressions and clicks. Thanks to the data stored on advertising servers, advertisers move away from heuristic-based attribution and solve this problem
⋆Copyright c2019 for this paper by its authors. Use permitted under Creative
based on data. Which, in turn, allows you to build more complex and accurate models based on machine learning. The data-driven approach includes several well-known methods for solving problems that are part of the multichannel attri-bution spectrum. These are machine learning methods such as Bagged Logistic Regression, Hidden Markov Chains, Shapley value approach, Survival Analysis, relative weights, and probabilistic approaches. Each of these methods has its own advantages over similar methods of solving the problems of multichannel attribution, which in turn allows you to choose one or another method based on individual needs and goals of advertisers. However, it is worth noting that today, in machine learning inventory, the Gradient Boosting is proven as one of the most effective algorithms. At the same time, we assume that the Gradient Boosting method copes better with the tasks of multi-attribute attribution due to unbalanced data sets for classification.
The paper is organised as follows. Section 2 introduces mathematical formal-isation of the problem. Section 3 shortly describes how to address multichannel attribution problem with such ensemble learning techniques as Gradient Boost-ing over Decision Trees and StakBoost-ing. Related work on both heuristic-based and data-driven approaches is summarised in 4. Section 5 is devoted to machine ex-periments with the data of three real Internet advertising campaigns. Finally, Section 6 concludes the paper.
2
Problem Statement
Let us consider a set of users or clientsU ={u1, . . . , un}and a set of advertise-ment channels C = {c1, . . . , cp}. Our data are represented by a matrix-vector pair (A,y), where A ∈ Rn×p is a matrix of user-to-channel interactions, and its element aij shows the number of interactions of the user ui ∈ U with the advertising channel cj ∈C, whileyis a binary vector of size nwith yi = 1 for happened conversion action andyi= 0 otherwise.
Let the functionf(Ai, θ) describes a certain classifier that receives the vector of interactions Ii of the consumer ui with advertising channels C as an input; the function determines a certain value of r, which reflects the chance of a conversion action by this consumer. Under certain conditions, the value r can be transformed into a probability that a consumer will take a conversion action; one of these conditions is monotonicity meaning the higher the value of r, the higher the probability of a conversion. It is necessary to find such parameters under which the classifier will give the best probability estimates in terms of the selected metrics. The weight of the influence of the advertising channel on the decision to perform the conversion action should be considered as follows: we choosekconsumersU′⊆U, for them we get the matrixI′∈Rk×p. We introduce an indicator function
1(ui, cj) =
1, aij >0,
then we express the influence of the advertising channel as
impact(cj) = 1
k X
ui∈U′
f(I′, θ)·1(ui, cj).
3
Ensemble Learning for Multi-Channel Attribution
3.1 Gradient Boosting over Decision Trees
Boosting over decision trees is considered one of the most efficient machine learn-ing algorithms. The idea of boostlearn-ing approach is as follows: it iteratively trains new basic classifiers that improve the composition of previously chosen ones, i.e. each new classifier compensates the errors of the composition of all the previously ones. In turn, gradient boosting optimises the differentiable loss function. The initial idea of boosting arose from the question [11]: is it possible to get strong classifier using many weak classifiers? Due to effectiveness of this machine learn-ing approach, it is an important part of many search engines [14,4] and a tool of choice for data science athletes that won many machine learning competitions [2]. An additional motivation for using this machine learning approach comes from the reduction of the task of multi-channel attribution to the binary clas-sification problem. We need to train a classifier that can sort out consumers into two classes: those who will perform the conversion action and those who will not. Since only 0.5% –2% of all consumers who saw ads reach conversion, this classification problem contains highly unbalanced classes. Gradient boosting over trees is just one of the techniques that address this class of problems well. Here, we use one of the most successful implementations of gradient boosting over trees named XGBoost.
3.2 Other ensemble approaches and Stacking
4
Related Work
Today, there are several methods for solving the multichannel attribution prob-lem. They can be divided into two types: heuristic-based approaches and data-based approaches [16].
4.1 Heuristic approaches
Let us consider heuristic-based multichannel attribution techniques.
2. First-touch attribution is an approach, on the contrary, where the greatest “weight” is given to the first channel with which the consumer interacted. Al-though this method may be useful for understanding how consumers are involved in an advertising campaign, this method does not allow to correctly assess the impact of advertising channels on consumers. For this reason, this approach is used much less often than others.
3. In case of linear-touch attribution, all “weights” are equally distributed between all channels leading to the conversion.
4. Time decay attribution is a model in which the largest “weights” are given to the most recent consumer interactions with advertising channels.
4.2 Bagged Logistic Regression
In order to evaluate the impact of advertising channels on consumers’ deci-sion to perform a converdeci-sion action, it is proposed to use logistic regresdeci-sion [9]. Therefore, the task of multi-channel attribution is reduced to the classification problem, in which all consumers are divided into two classes, those who per-formed the conversion action and those who did not such an action within the short term (during the analysis period).
In [12] the authors propose the use of logistic regression because of its easily interpretable coefficients. To cope with the problem of multicollinearity of inde-pendent variables, the use of the bagging technique is proposed, which leads to a stable and reproducible result, while maintaining an easy interpretation of the usual logistic regression. The training of this meta-algorithm takes place in two stages:
1. From the data set, the observations are selected in accordance with a pre-determined proportion. In the same way, characteristics with a share are selected. For the selected observations, we obtain a new data set on which the logistic regression is trained. The estimated logistic regression coefficients are recorded.
2. Step 1 is repeated once. And the final estimate of the logistic regression coefficient is obtained by taking the average of all the coefficients obtained in iterations.
The proportions of observations and attributes as well as the number of iterations M are hyper parameters of bagged-logistic regression. The authors conclude that for fractions that are very different from 0 and 1, the results of the meta-algorithm are similar, and the number of iterations does not affect the results [12].
4.3 Markov Chains approach
Visits to all consumers are presented as chains in the Markov graph. Formally, this model can be formulated as follows:
Let us consider a Markov graphM = (S, W), which is composed from the statesS={s1, . . . , sn}along with the associated transition matrixW with edge weights wij =P(Xt=si|Xt−1=sj), such that 0≤wij ≤1 andP
N
i=1wij = 1
for alli.
Consumer chains contain one or more interactions with advertising channels. In this model, each state corresponds to one advertising channel. Three special states are also introduced: START is a state that represents the beginning of the consumer chain, CONVERSION is a state indicating the successful completion of the conversion action, and for chains that were not completed by the conversion action, the NULL state is introduced.
The element of the transition matrixwij corresponds to the probability that after interacting with advertising channeli, interaction with advertising channel
j will follow. For the first channel in the chain, an incoming connection with the START state is added. If the consumers sequence of actions ends with a conver-sion, then after the last interaction with the advertising channel, a connection with the CONVERSION state is added. Otherwise, it falls into the NULL state, and each CONVERSION state goes into the NULL state as well.
Since the number of parameters in such a model grows exponentially with the chain length, the authors limit themselves to a maximum chain order of four. To assess the impact of each advertising channel on the conversion action, the authors propose using the effect of removing the advertising channelsi from the model and tracking the change of the probability of reaching CONVERSION from START state. Since this removal effect reflects well the degree of change in conversion, it can serve as an estimate of the contribution of each channel.
4.4 Shapley value approach
This attribution methodology is equivalent to the Shapely Value solution to value distribution in Cooperative Game Theory [13]. We refer interested readers to [6] for a thorough treatment on the first application of the Shapely Value distribution methodology to value allocation in advertising attribution. Instead, we would like to provide a reader with a tailored machine learning interpretation of Shapley values named SHAP (SHapley Additive exPlanation) values [10].
To compute SHAP values the authors define fx(S) = E[f(x) | xS] where
E[f(x)|xS] is the expected value of the function conditioned on a subset S of the input features.
SHAP values combine these conditional expectations with the classic Shapley values from game theory to attributeφi values to each feature:
φi= X
S⊆N\{i}
|S|!(M − |S| −1)!
M! (fx(S∪ {i})−fx(S)), (1)
Table 1.Statistics for advertising campaigns Adv. campaign AC 1 AC 2 AC 3 #Days 38 27 60 #Consumers 9432773 39101 35849 #Shows 36526572 876192 104518 #Clicks 79626 2607 5137 #Conversions 21041 2653 4740
5
Machine Experiments
All experiments performed in this work were carried out on real data from ad-vertising campaigns of advertisers from the food industry and the production of consumer goods. The experiments were carried out on three data sets.
Each data set contains data on the interaction of consumers with an advertis-ing message with a time stamp. For each consumer and advertisadvertis-ing message, it is known on which site the interaction took place, the category of the advertising message (online video, promo post on the social network, banner advertising, etc.), creative ID, consumer action category (ad display, click, conversion), time stamp, the identifier of the location of advertising on the site.
It is worth noting that two of the three data sets have a great advantage over the third. In fact, most data on advertising campaigns is collected only in special advertising servers, where each consumer is identified by cookie. This approach has several disadvantages:
– A consumer may have multiple cookies, for example, when a consumer uses multiple devices;
– One cookie may belong to multiple consumers, for example, when more than one person uses the same device
– Advertising servers may “nullify” some cookies when trying to use third-party targeting services;
– In such data, many cookies may be assigned to crawlers, not real persons; – Browsers update cookies every month.
To cope with the above problems, each cookie is matched with the account of a real person on the advertiser’s website and only after that the consumer ID is used.
Below are the statistics for each advertising campaign.
For advertising campaign 2 additional data about consumers are known: city of residence, region of residence, platform used (web, iOS, Android, etc.), browser used, categories of purchased items, data on the advertiser’s offline activities (TV advertising, outdoor advertising, etc.). These additional data were used in conjunction with meta-attributes to train the meta-algorithm.
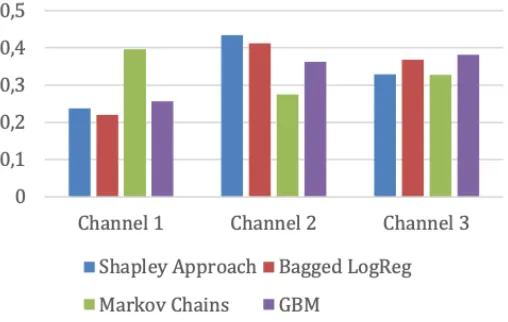
Fig. 1.Channel attribution for advertising campaign 1
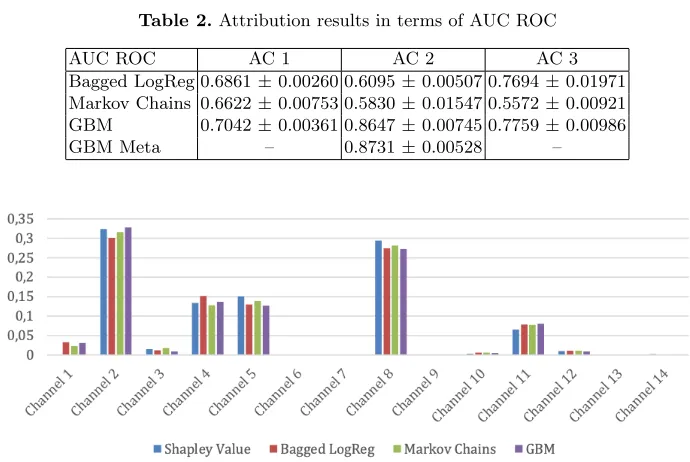
[image:8.612.177.438.434.592.2]Table 2.Attribution results in terms of AUC ROC AUC ROC AC 1 AC 2 AC 3 Bagged LogReg 0.6861±0.00260 0.6095±0.00507 0.7694±0.01971
Markov Chains 0.6622±0.00753 0.5830±0.01547 0.5572±0.00921
GBM 0.7042±0.00361 0.8647±0.00745 0.7759±0.00986
GBM Meta – 0.8731±0.00528 –
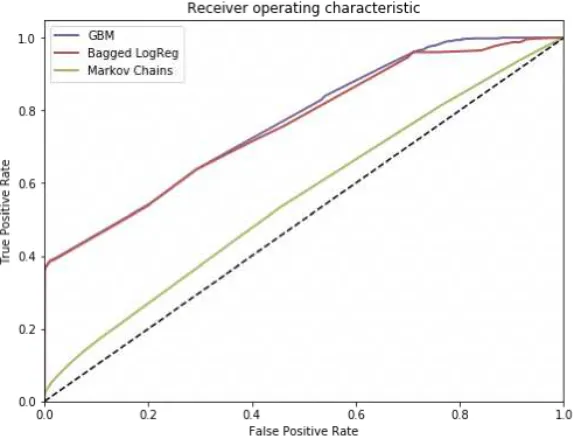
Fig. 3.Channel attribution for advertising campaign 3
Fig. 1, 2 and 3 that the impact of advertising channels on conversion is roughly the same for all methods, except for the model based on Markov chains in ad-vertising campaign 1.
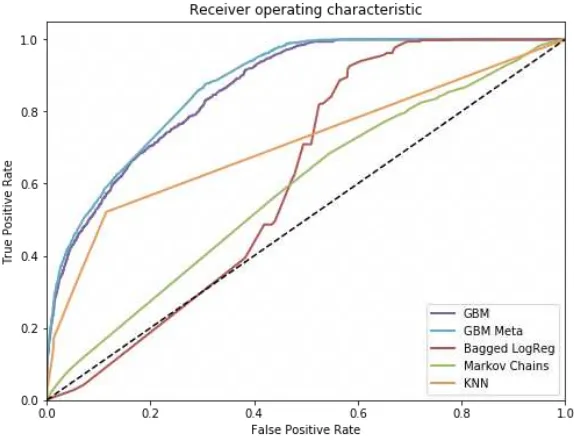
Figures 4 and 7 shows the ROC curves for advertising campaigns 1 and 3, where our meta algorithm have not been applied due to missing auxiliary users’ features. By identifying dominating curves, we can prove that Gradient Boosting is superior technique. For campaign 3 figures 7 (ROC curve) and 7 (Precision-Recall diagram) provide the evidence of superiority of our meta solution, which features Gradient Boosting over stacked (in sense of [15]) Markov chains, bagging of logistic regressions, andk-nearest neighbours approach.
6
Conclusion
Fig. 4.ROC curve for advertising campaign 1
[image:10.612.163.450.402.623.2]Fig. 6.2-class Precision-Recall curve for advertising campaign 2
[image:11.612.164.451.402.624.2]We considered different approaches to multi-channel attribution: the ap-proach based on game theory, the apap-proach based on Markov chains, and Bagging of logistic regressions among the others.
To solve the multichannel attribution problem, we used Gradient Boosting method and an ensemble of classical algorithms to increase the accuracy of pre-dicting the probability of a conversion action by a consumer.
The quality of the proposed algorithms was compared with conventional so-lutions of the multichannel attribution problem for three real data sets. The proposed solution gave the best result among all in terms of ROC AUC. Thus, the used ensemble classification has improved the ability to estimate the likeli-hood of a consumer to perform a conversion action.
One of the direction for future work might be analyses of market segments (represented by groups of users) with respect to channels where the positive response was recorded by means of abject-attribute biclustering [8].
Acknowledgements. The study was implemented in the framework of the Basic Research Program at the National Research University Higher School of Economics (Sections 2 and 5), and funded by the Russian Academic Excel-lence Project ’5-100’. The second author was also supported by Russian Science Foundation (Section 1, 3, and 4) under grant 17-11-01276 at St. Petersburg De-partment of Steklov Mathematical Institute of Russian Academy of Sciences, Russia.
References
1. The volume of advertising in its distribution media in 2017. https://www. akarussia.ru/knowledge/market_size/id8180 – Official website of the Associ-ation of CommunicAssoci-ation Agencies of Russia (2017), [Online; last accessed 30-Sep-2019]
2. The Official Blog of Kaggle.com.http://blog.kaggle.com/tag/xgboost (2019), [Online; last accessed 30-Sep-2019]
3. The volume of advertising in the means of its distribution in the first half of 2019.
http://www.akarussia.ru/knowledge/market_size/id8955 – Official website of the Association of Communication Agencies of Russia (2019), [Online; last accessed 30-Sep-2019]
4. Amini, M., Truong, T., Goutte, C.: A boosting algorithm for learning bi-partite ranking functions with partially labeled data. In: Proceedings of the 31st Annual International ACM SIGIR Conference on Research and Develop-ment in Information Retrieval, SIGIR 2008, Singapore, July 20-24, 2008. pp. 99–106 (2008). https://doi.org/10.1145/1390334.1390354, https://doi.org/10. 1145/1390334.1390354
5. Anderl, E., Becker, I., von Wangenheim, F., Schumann, J.H.: Mapping the cus-tomer journey: A graph-based framework for online attribution modeling (2014) 6. Dalessandro, B., Perlich, C., Stitelman, O., Provost, F.: Causally
(2012). https://doi.org/10.1145/2351356.2351363,http://doi.acm.org/10.1145/ 2351356.2351363
7. van Eeden, E., Chow, W.: Perspectives from the Global Entertainment & Me-dia Outlook 2019–2023. https://www.pwc.com/gx/en/industries/tmt/media/ outlook.html(2019), [Online; last accessed 30-Sep-2019]
8. Ignatov, D.I., Kuznetsov, S.O., Poelmans, J.: Concept-based biclustering for in-ternet advertisement. In: 12th IEEE International Conference on Data Min-ing Workshops, ICDM Workshops, Brussels, Belgium, December 10, 2012. pp. 123–130 (2012). https://doi.org/10.1109/ICDMW.2012.100, https://doi.org/ 10.1109/ICDMW.2012.100
9. Lovett, J.: Attribution Methods and Models: A Marketers Framework. Web Ana-lytics Demystified, Inc. http://media.dmnews.com/documents/52/attribution_ methods_and_models_12971.pdf(2014), [Online; last accessed 30-Sep-2019] 10. Lundberg, S.M., Lee, S.I.: A unified approach to interpreting model predictions.
In: Guyon, I., Luxburg, U.V., Bengio, S., Wallach, H., Fergus, R., Vishwanathan, S., Garnett, R. (eds.) Advances in Neural Information Processing Systems 30, pp. 4765–4774. Curran Associates, Inc. (2017), http://papers.nips.cc/paper/ 7062-a-unified-approach-to-interpreting-model-predictions.pdf
11. Schapire, R.E.: The strength of weak learnability. Machine Learning 5, 197– 227 (1990). https://doi.org/10.1007/BF00116037, https://doi.org/10.1007/ BF00116037
12. Shao, X., Li, L.: Data-driven multi-touch attribution models. In: Proceed-ings of the 17th ACM SIGKDD International Conference on Knowledge Dis-covery and Data Mining, San Diego, CA, USA, August 21-24, 2011. pp. 258–264 (2011). https://doi.org/10.1145/2020408.2020453, https://doi.org/10. 1145/2020408.2020453
13. Shapley, L.S.: A value for n-person games. Contributions to the Theory of Games
2(28), 307–317 (1953)
14. Valizadegan, H., Jin, R., Zhang, R., Mao, J.: Learning to rank by opti-mizing NDCG measure. In: Advances in Neural Information Processing tems 22: 23rd Annual Conference on Neural Information Processing Sys-tems 2009. Proceedings of a meeting held 7-10 December 2009, Vancouver, British Columbia, Canada. pp. 1883–1891 (2009),http://papers.nips.cc/paper/ 3758-learning-to-rank-by-optimizing-ndcg-measure
15. Wolpert, D.H.: Stacked generalization. Neural Networks 5(2), 241–259 (1992). https://doi.org/10.1016/S0893-6080(05)80023-1, https://doi.org/10. 1016/S0893-6080(05)80023-1