Munich Personal RePEc Archive
Temporary Trade Shocks, Spatial
Reallocation, and Persistence in
Developing Countries: Evidence from a
Natural Experiment in West Africa
Emran, M. Shahe and Shilpi, Forhad and Coulombe, Harold
and Blankespoor, Brian
15 June 2019
Online at
https://mpra.ub.uni-muenchen.de/94598/
Temporary Trade Shocks, Spatial Reallocation, and Persistence in Developing Countries: Evidence from a Natural Experiment in West Africa
M. Shahe Emran, IPD, Columbia University
Forhad Shilpi, DECRG, World Bank
Harold Coulombe, World Bank
Brian Blankespoor, World Bank June 15, 2019
ABSTRACT
In response to rising inequality following decades of trade liberalization, many coun-tries are adopting trade restrictions. Can temporary trade restrictions have long-lasting effects on spatial distribution of employment and resource allocation? To analyze this, we exploit the civil war in Cote d’Ivoire (2002-2007) that disrupted access to world mar-ket for two neighboring land-locked countries: Mali and Burkina Faso. The Ivorian war forced rerouting of trade from the Abidjan route to the non-Abidjan routes. We build a general equilibrium model where a subsistence-based autarkic hinterland coexists with an integrated segment, and there are two alternative routes to international market. A trade shock to one route affects resource allocation in both routes by shifting spatial margins of market integration and sectoral specialization. The effects are heterogeneous depending on the pre-war market access of a location. The empirical analysis takes advantage of panel data and estimates the effects on structural change in employment in non-Abidjan route using a triple difference design with location fixed effect. The areas that remain in autarkic equilibrium both before and after the trade shock provide plausible estimates of the changes arising from long-term factors unrelated to the trade shock. The estimates show that the temporary trade shock created divergence between the Abidjan and non-Abidjan routes with accelerated structural change in favor of manufacturing and services employment in the non-Abidjan route. We find evidence of persistence in the effects through higher sunk investment in built-up density, agglomeration through concentration of skilled labor, and more public investment in complementary inputs such as electricity infrastructure (mea-sured by night-lights density).
Key Words: Temporary Trade Restrictions, Regional Development, Structural Change in Employment, Persistence, Path-Dependence, Built-up Density, Skill Agglomeration, Pro-vision of Electricity, Night-Lights
(1) Introduction
There is a broad consensus among economists that trade liberalization increases
pro-ductivity and national income, but there has also been a deeper appreciation of the adverse
distributional effects in recent years. The inequality associated with globalization and
market liberalization exhibits strong spatial pattern in many countries. For example, the
coastal areas in China benefited much more than the interior provinces following the
open-ing up and reform initiated in 1978, and the effects of “China trade shock” on USA has
been geographically concentrated in certain local labor markets (see, Autor et al. (2016),
Kanbur and Venables (2005)).1 After decades of trade liberalization, many countries are
increasingly engaging in trade restrictions partly in response to rising inequality. Can
tem-porary trade restrictions reshape the regional development in a country by changing the
spatial distribution of employment and resource allocation? To analyze this, we exploit a
natural experiment in West Africa where the civil war in Cote d’Ivoire (CIV) disrupted
access to world market for two neighboring land-locked countries: Mali and Burkina Faso.2
Abidjan in Cote d’Ivoire was the main seaport handling the bulk of the maritime trade
of Mali and Burkina Faso before the civil war broke out in Cote d’Ivoire. The war led
to a re-routing of trade from Abidjan to other West African ports such as Dakar, Accra,
Lome, and Cotonou. The crisis lasted for 5 years till a political settlement was reached
in 2007.3 We examine whether this temporary negative shock to the Abidjan route led to
reallocation of economic activities to the other routes not directly affected by the CIV crisis,
and created the preconditions for longer term effects and path-dependent evolution of the
regional economy through irreversible investments in built-up density and agglomeration
of skilled labor.
In the pre-war period, the road networks in both countries were sparse resulting in
high transport costs. As a result, a significant part of the economy was effectively an
‘autarkic village economy’ with little or no long-distance (international) trade exchanges.
1In a series of influential papers, David Autor and his collaborators analyze the effects of China trade shock by focusing on the local labor markets more exposed to Chinese imports in USA.
2It is difficult to use the tariff and non-tariff policy restrictions in a country for such an analysis, as the policy choices are endogeneous.
We develop a spatial equilibrium model that allows for the co-existence of an integrated
segment characterized by sectoral (agriculture vs. manufacturing) specialization and a
subsistence-based autarkic hinterland within the same country. The model includes two
trade routes in a country: a route affected by the shock directly, called the “Abidjan route”,
and a second route for trade through alternative ports, called the “non-Abidjan route”.
The focus of our analysis is on spatial heterogeneity and persistence in the effects of
the temporary trade cost shock on different routes. We consider spatial heterogeneity
at two margins of adjustment along a route: the spatial margin of market integration
(henceforth SMI) and the spatial margin of specialization (henceforth SMS). The SMI
separates the subsistence-based autarkic region from the integrated segment of the economy
characterized by specialization according to comparative advantage driven by inter-regional
and international trade. The SMS, on the other hand, separates the zone of manufacturing
specialization from that of agricultural specialization within the integrated segment of the
economy. To understand whether the reallocation triggered by a temporary trade shock can
lead to persistent effects, we analyze irreversible investments in built-up density (housing
and manufacturing structures) by taking advantage of the recently available satellite data on
global human settlement. In addition, we provide evidence on the role played by reallocation
of skilled labor (agglomeration externalities) and public provision of complementary inputs
such as electricity (using night-lights density as an indicator).
The theory shows that a trade shock to one route affects resource allocation across
routes and also along a given route at different locations differentiated by the initial
(pre-war) market access. An important insight is that a temporary trade shock shifts both
spatial margins (SMS and SMI) along a given route leading to ambiguous overall effects on
employment structure; but it also leads to well-defined heterogenous effects with respect
to the initial (pre-war) extent of market access of a location. In particular, the areas with
the poorest market access in each route are not affected by the trade shock which plays an
important role in our research design.
For the empirical analysis, we combine the satellite data on global human settlement
with data from two rounds of population census to create panel data sets at the commune
and non-Abidjan routes, we adopt a triple-difference strategy with location fixed effects. A
difficult challenge in analyzing the effects of a large-scale trade cost shock is that, because of
general equilibrium effects, it may be difficult, if not impossible, to find a comparison area
that remains unaffected (Donaldson (2015)). This is especially challenging in developed
countries where the economy is spatially well-integrated by extensive transport
infrastruc-ture. The fact that, in many developing countries, a significant part of the economy is
effectively in an isolated autarkic equilibrium offers us a plausible strategy; we can use
as comparison the part of the economy that remains autarkic both before and after the
trade shock. The changes in employment structure and built-up density observed in these
comparison areas cannot be due to the trade shock, and thus provide an estimate of the
structural changes due to the underlying long-term technological and institutional factors.
The core of our empirical strategy is to compare the DID estimate of the effect of the
CIV crisis on the integrated segment of the non-Abidjan route with the corresponding
DID estimate for the integrated segment of the Abidjan route, with the respective autarkic
areas as the comparison. It is important to appreciate that the triple-difference set-up
is used for understanding the spatial reallocation, not for estimating the causal effects of
the negative trade shock on a route. An important advantage of our focus on spatial and
sectoral reallocation is that the intractable problem of double-counting one faces while
estimating the causal effects is not relevant in our context.4 Using data on a vector of
relevant characteristics, we find that the Abidjan and non-Abidjan routes in both Mali
and Burkina Faso do not differ significantly in the pre-war period, thus allaying the worry
that the shifts in the spatial margins of integration and specialization would have been
substantially different across different routes even in the absence of the trade shock caused
by the civil war in Cote d’Ivoire. The panel data allow us to difference out the
time-invariant characteristics using fixed effects, thus addressing the concern that differences in
natural agricultural endowments may be partly responsible for the differences in sectoral
employment shares observed across routes.
The empirical analysis produces three key findings. First, we find that a substantial
part of the economy in both the Abidjan and non-Abidjan routes remained essentially
in isolated autarkic equilibrium both before and after the CIV trade shock. The trade
shock shifted the spatial margin of integration (SMI) outward in the non-Abidjan route,
thus expanding the zone of market integration, and had the opposite effects in Abidjan
route. Second, the CIV trade cost shock substantially increased the employment share
in manufacturing, and trade and services in the integrated areas of non-Abidjan route,
suggesting accelerated structural change in the non-Abidjan route when compared to the
Abidjan route that bore the direct impact of the civil war in CIV. Third, the effects of
the CIV war on regional development (Abidjan vs. non-Abidjan) may be long-lasting; the
evidence suggests positive impacts on sunk investment in built-up density, higher growth
in night-lights density (capturing greater expansion of electricity grids), and geographic
concentration of skilled labor (capturing agglomeration) in the integrated areas in the
non-Abidjan route. The persistence in the impacts of CIV-crisis is supported by the trade flow
data which confirms that the share of maritime trade flow through Abidjan route never
recovered to its pre-crisis level even 10 years after the end of the crisis.
Rest of the paper is organized as follows. We discuss the related literature in section
(2) and put the contributions of the paper in context. The next section provides details
on the country contexts and the civil war in Cote d’Ivoire. Section (4) develops as a
simple general equilibrium model and derives testable predictions about reallocation and
employment structure across Abidjan and non-Abidjan routes. Data sources and variables
are described in section (5). Section (6) develops the empirical strategy, and section (7)
contains the main empirical results. The paper concludes with a summary of the main
findings.
(2) Related Literature
There is a substantial and rapidly growing literature on the effects of trade costs on
eco-nomic activity (for an excellent recent survey see Donaldson (2015)). The recent literature
on transport costs emphasizes possible heterogeneity in the impacts of transport
interven-tions. While transport investment is found to have significant positive impacts on many
dimensions of economic development (see Donaldson (2018), Donaldson (2015),Emran and
there is also evidence where these investments led to negative effects or no changes in
out-comes (Faber (2014), Banerjee et al. (2012), Baum-Snow et al. (2017), Asher and Novosad
(ming)).5 We provide a framework that explains the spatially heterogeneous impacts in
the context where a significant part of the economy may be subsistence based and not
integrated with the world market.
Our analysis is closely related to the influential study of Redding and Sturm (2008)
who investigate the effects of Berlin Wall on population growth rate of West German cities
located near the border. Interpreting Berlin Wall as a negative shock to market access and
hence to trade, they find that cities, particularly the smaller cities, located near the Berlin
Wall experienced a substantial decline in population growth relative to the other West
German cities. Our study differs from Redding and Strum (2008) in two aspects. The
trade/transport shock we consider is a shorter term shock lasting no more than 5 years as
opposed to Berlin Wall which lasted over decades. Perhaps more importantly, we not only
analyze the effects on structural change in sectoral employment shares, but also provide
evidence on three factors that might create path-dependence and longer-term persistence:
sunk investment in built-up density, public provision of electricity infrastructure as captured
by night-lights density, and skill concentration (agglomeration) as measured by proportion
of working population with secondary and higher schooling.
The persistence of the impacts of temporary shock on spatial development has attracted
considerable attentions in recent empirical literature on transport infrastructure. In an
im-portant paper, Bleakley and Lin (2012) study the cities created by the portage needs at
the falls along major rivers in USA and found that population density in former portage
sites maintained their historical levels even after portage became obsolete due to technical
progress. Jedwab and Moradi (2016) and Jedwab et al. (2017) examine the long term
impacts of colonial rail-roads in Ghana and Kenya respectively. They find large positive
impacts of rail road on urbanization and distribution of economic activities and the effects
had persisted long after the sharp decline of rail-roads during the post independence
riod. The path dependence in these studies arises from increasing returns to scale in local
activities.6 Our study focuses on the hard footprint of a relatively short-lived transport
shock in the context of a predominantly rural/agricultural economy. We find that areas
with better initial market access tend to respond in a way that is consistent with creation of
preconditions for localized increasing returns in the long run. An advantage of our setting
is that it minimizes the possibility of other interventions that may affect the outcomes in
the longer term. A small and emerging literature examines the impacts of transport shocks
in the context of African countries. In an interesting paper, Storeygard (2016) uses change
in fuel price to identify the effects of transport cost on urban growth in the context of
African countries.
(3) The Background and the Natural Experiment
(3.1) Trade Routes in West Africa
Burkina Faso and Mali are two landlocked West African countries. Both countries rely on a
network of major roads to access ports along the West African coast. The map in Figure 1
describes the main West African trading routes. There are six main routes connecting both
countries to seaports on the coast. Burkina Faso can access ports of Abidjan (CIV), Tema
and Tekoradi (Ghana), Lome (Togo) and Cotonou (Benin). In addition to these ports,
ports in Dakar (Senegal) and Conarky (Guineau) are also accessible to Mali. The highways
connecting these countries to sea ports are also the main highways in both countries for
internal trade. This means that any disruption to these routes would affect not only the
trading costs for exports and imports, but also for inter-regional trade within a country.
Though both Mali and Burkina can access several ports along the west African coast line,
Abidjan in Cote d’Ivoire (CIV) had been the main port handling their maritime trade. The
importance of Abidjan for maritime trades of Mali and Burkina is evident from Figures
2a and 2b which show the volume of trade of these two countries handled by different
ports between 1998 and 2006 for Mali and 1998-2016 for Burkina Faso. In 1998, nearly 65
percent of Mali’s and 60 percent of Burkina’s import and export passed through the port
of Abidjan. Cross border trade along this route has also been important as people in areas
near borders share similar ethnic and linguistic backgrounds.
Cote d’Ivoire Civil War (2002-2007)
Access to Bamako-Abidjan in Mali and Ouaga-Abidjan in Burkina Faso routes was severely
disrupted during Ivorian civil war. The civil war started when the citizen and voting rights
issues spurred tension among different ethnic and religious groups during the democratic
transition following the death of its first president. The armed conflict flared up in 2002
and continued till 2006 when Ivorian national soccer team qualified for 2006 FIFA World
Cup and brought warring parties together to agree on truce for further peace negotiations.
A peace treaty was concluded in 2007 ending the armed conflict. As a result of these
long running political crises and civil war, the most important trading routes for Mali and
Burkina Faso – from Bamako and Ouagadougou to Abidjan – were severely affected. At the
height of civil war in 2002-2003, the port of Abidjan was closed for months. In 2002-2003,
none of Burkina’s import and export passed through Abidjan. Maritime trade for Mali
through the port of Abidjan accounted for less than 15 percent of total trade (Figure 2b).
Nearly all of the trade through Abidjan in 2003 was diverted to the other West African
ports: Tema and Takoradi in Ghana, Lome (Togo) and Dakar (Senegal) (Figures 2a and
2b). From 2007 onward, transit through Abidjan started to recover but even by 2016, it
was well below its pre-CIV crisis level for Burkina.7 While the effect of political instability
on maritime trade is evident from Figures 2a and 2b, volumes of trade that took place
among neighboring countries are not recorded officially by routes. But the disruption of
trade along Abidjan route is expected to have similar adverse effects on the inland trade as
well. It is clear from Figures 2a and 2b that shock to trade routes coincided with the CIV
political crisis and the impact of shock lasted about 6 years before it started to recover.
The shock was thus temporary but not too short-lived as to make no difference. We exploit
this negative shock to transit through Bamako-Abidjan and Ouagadougou-Abidjan routes
as a source of exogenous variation in market access concentrated in a particular region in
Mali and Burkina Faso.8
(4) Conceptual Framework
We develop a model that incorporates two distinguishing features of a poor developing
economy. First, the production structures of poorer developing countries are dominated
by agriculture. The share of non-agricultural employment in Mali and Burkina was less
than 10 percent in the pre-CIV crisis period.9 Second, roads are sparse and paved roads
are rare. The high costs of transportation means that not all areas trade with each other
and pockets of autarkic subsistence economies are more of a rule than exception.
(4.1) The Basic Set-up
Geography and Endowment
We take the location of cities and the transport network as given, and then examine how
spatial distribution of population and sectoral employment shares respond to a shock to
transport costs. We consider a country which consists of two cities: K and J. CityK uses port of Abidjan for its international trade and city J uses an alternative (non-Abidjan) port. There are a continuum of locations around city K(J) along a line with the city center at the one end denoted by K0(J0), and the location farthest from the city center
denoted as K1(J1). Each location along [K0, K1] is indexed by i, and its distance from city center K0 is denoted as di. Shipping of a good from K0 to any location i along the
line involves a product specific iceberg costeτqdi whereτ
q >0 represents the unit transport
cost of product q. Each location i is endowed with Ti = T > 0 units of land. There is a
mass of N workers in this economy, each supplying 1 unit of labor inelastically. Labor is mobile across all locations. Two cities K and J are identical to each other in terms of all relevant characteristics including access to international markets (though through different
8There was a very brief political violence in 2011 in CIV that started in March 2011 and ended on April 11, 2011 with the arrest of Laurent Gbagbo by French forces.
ports) during the pre-crisis period. Taking advantage of the symmetry, we focus on cityK
to describe the initial equilibrium.
Technology and Comparative Advantage
We consider a four-goods economy; each location can produce three traded goods and
a nontraded service. There are two types of manufacturing goods: m denotes modern and
z traditional manufacturing goods.10 The manufacturing goods (m and z) and agriculture
(x) are tradable, and housing (h) is non-traded service. Manufacturing and agriculture are produced by combining labor (L) with land (T) whereas housing is produced using land (T) only. The production technologies are constant returns to scale:
Qxi =AxiTxiβL
1−β
xi ;Qmi=AmiTmiβ L
1−β
mi ;Qzi =AziTziβL
1−β
zi ;Qhi =AhiTsi
where Axi is the total factor productivity in agriculture, and similarly for the other
com-modities.
Each sector is characterized by perfect competition at each location. Constant returns
to scale, free entry and profit maximization by the firms imply that, in equilibrium, the
following marginal conditions hold (let q index manufacturing and agricultural goods, i.e.,
q∈[x, m, z]:
Aqi(1−β)TqiβL− β
qi =
Wi
Pqi
= (1−β)Qqi
Lqi
; q ∈x, m, z (1)
βAqiT β−1
qi L
1−β
qi =
ri
Pqi
; Ahi=
ri
Phi
; q∈x, m, z (2)
Where Pqi is price of q ∈ [x, m, z], Phi is the price of housing, Wi and ri are wage and
land rental respectively.
For simplicity, we assume that factor productivity in h does not vary across location (Ahi = Ah). Factor productivity of traded goods (x, m, z) are subject to agglomeration
externality. Agglomeration economy in manufacturing arises from learning externality,
closer input-output relationship and thick labor market. Similarly, technology adoption in
agriculture is observed to spread through social networks. To allow for these agglomeration
externalities, we assume that productivity of a traded goodq in locationican be expressed as Aqi = ¯Aqn
αq
i where ¯Aq is the intrinsic local productivity which is assumed to vary
across products but not across locations, ni is the population density (= NTi) and αq is
the agglomeration parameter which is assumed to be smaller than β to ensure an interior solution. We assume that the country has comparative advantage in production of x and
z relative to the rest of the world.
Preferences and Consumer Optimization
There is a representative consumer in each location with identical preferences over
consumption of four goods and services: agriculture, manufacturing, and housing.
U =CmγCxδCzηC1−γ−δ−η
h
The utility maximization implies the following demand functions:
Cmi=
γyi
Pmi
; Cxi =
δyi
Pxi
;Cxi =
ηyi
Pzi
; Csi =
(1−γ−δ−η)yi
Phi
whereyi is the income of the representative consumer in location i. Given the prices of the
four products, the indirect utility function for the representative consumer in a location i
can be derived as:
Vi =
γγδδηη(1−γ−δ−η)1−γ−δ−ηy
i
Pmiγ Pδ xiP
η ziP
1−γ−δ−η
hi
(3)
(4.2) Equilibrium Before the CIV Crisis
Given the pattern of comparative advantage, city K exports x and z, and imports m. The small country assumption implies that prices of x, m and z at the port of entry (e.g. Abidjan) are given parametrically from the international market. Prices of these goods at
Pqk0 = P˜q(1−θk), q ∈x, z
Pmk0 = P˜m(1 +θk)
where ˜Pq is the international price at port of entry/exit, and θk is the transport cost from
port of entry/exit to the city center K0. Note the asymmetry in the way transport from port to city center affects exportables and importables. It increases price of importables to
consumers but reduces the price received by producers of exportables.
Given endowment, preference, and technology, a competitive equilibrium in this
econ-omy is characterized by a set of prices (goods and factors) such that (i) the labor market
clears locally, regionally and at the country level; (ii) the land market clears at the local
level, land being the immobile factor of production; and (iii) utility is equalized across
lo-cations as workers are mobile. We assume that transport costs (τq) fall in an intermediate
range such that each city has areas that do not engage in international trade, which we
call the “isolated hinterland”. Rest of the areas engage in trade and form an integrated
region. Let K∗ be the border of the integrated and isolated sub-regions, we call it the spatial margin of market integration (SMI). Around a city K, areas along [K0,K∗) are in the integrated region and [K∗, K1] are in the autarky.
Equilibrium in the Isolated sub-region
We start with the characterization of the equilibrium where there is no international
trade. Given the absence of heterogeneity in productivity and CRS technology but positive
transport costs, the competitive equilibrium is characterized by autarky where each location
produces all three tradable goods. The shares of land devoted to agriculture, manufacturing
and housing are direct function of their respective income and output shares.11 The shares
of labor employed in modern and traditional manufacturing are equal to γ
(γ+δ+η) and
η
(γ+δ+η) respectively and in agriculture to
δ
(γ+δ+η). The relative prices of tradable goods in autarky equilibrium are Pm∗
P∗
x
= Axk∗
Amk∗
; Pm∗
P∗
z
= Azk∗
Amk∗
. We show in the online
11Housing share of land: T
appendix that population density does not vary across locations in this case as the relative
prices are the same for all locations.
Equilibrium in the Integrated Sub-region
As noted above, price of q at city center (K0) is equal to ˜Pq(1− θk), q ∈ x, z and
˜
Pm(1 + θk) for m. To define the trading and specialization patterns, we assume that
˜
Pz(1−θk)
˜
Pm(1 +θk)
> P
∗
zk0
P∗
mk0
= Amk0
Azk0
and P˜x(1−θk) ˜
Pm(1 +θk)
> P
∗
xk0
P∗
mk0
= Amk0
Axk
. These assumptions ensure that x and z are exported andm is imported.
To pin down the specialization pattern with respect to distance fromK0, we assume that Pzk0Azk0 > Pxk0Axk0 and τz is higher than a threshold defined later in this section. Under
these assumptions, three specialization zones can be identified within the integrated
sub-region. In the first specialization zone right around the city [K0, Kz], onlyzis produced and exported where Kz >0 is determined by using the condition PzKz
PxKz
= Pzk0e−
τzKz
Pxk0e−τxK z =
AxKz
AzKz
as
Kz = 1
τz−τx
[¯az−¯ax+ (αz−αx) ln(nkz) +pzk0 −pxk0] (4)
where pqk0 = ln(Pqk0) and ¯aq = ln ¯Aq, q ∈ [x, z] and nkZ is the population density at
location Kz. In the second specialization zone [Kz, Ks], only x is produced where Ks is
determined by using the condition
(
Pzk0e−(τm+τz)K s
Pmk0
= Amks
Azks )
as
Ks= 1 (τm+τz)
[¯az−¯am+ (αz−αm) ln(nks) +pzk0 −pmk0]. (5)
In the third specialization zone [Ks, K∗], x is produced for export but z is produced only for local consumption. By equating relative price ofxandmunder trade with autarky price ratios, we determineK∗ as
K∗ = 1 (τm+τx)
[¯ax−¯am+ (αx−αm) ln(nKA) +pxK0 −pmK0]. (6)
Equation (5) implies that an increase in τz shortens Ks,and define ˆτz such that at ˆτz,
spatial margin of integration as SM I = max{Ks, K∗}. Spatial margin of specialization (SMS) on the other hand is at Kz.
As shown in the online appendix, land and labor allocation across activities vary across
specialization zones. Since housing is non-traded and a constant fraction of land is used
for housing regardless of specialization zones. The rest is used in the production of z at any locationi∈[K0, Kz], x ati∈[Kz, Ks] and allocated betweenx andz ati∈[Ks, K∗]. Employment shares follow a similar pattern.12
Economy-wide Equilibrium and Worker’s Indirect Utility
Labor mobility across locations links the integrated and isolated subregions near each
city and across two cities. Labor mobility across areas implies equalization of indirect utility,
i.e., Vi = ¯v. Utilizing the first order conditions along with Vi = ¯v, we show in the online
appendix that population density in the integrated sub-region decreases with an increase
in distance fromK0, with its slope determined by transport costs and demand parameters.
Since the two cities are identical in the pre-war period, the Cobb Douglas utility and
production functions imply that a half of total labor endowment is concentrated in each
city and its surrounding areas. The aggregate labor market clearing condition determines
v.Note that the symmetry in the initial equilibrium breaks down once there is a trade cost shock to one of the international trade routes.
Built-up Density
The empirical analysis utilizes data on built-up area to explore the impacts of CIV crisis
on sunk investments that can lead to persistent effects. We define built-up density in terms
of density of residential housing and manufacturing structures.13 The proportion of
built-up area is defined as equal to the density of housing and manufacturing in the [K0, Kz] zone of integrated subregion. In rest of the areas, it equals to the density of housing defined
in turn by population density (ni). This definition implies that built-up area should be
12At i ∈ [KS, K∗], proportion of labor used in agriculture is (γ+δ)
(γ+δ+η) while rest used in traditional manufacturing (z).
more concentrated around city center due to higher population density and concentration
of manufacturing.
(4.3) The Effects of the Transport Shock to One Port (Abidjan)
We model the CIV-political crisis as an increase inθkand no change inθj along alternative
routes. Though international prices at the port of entry is not influenced by CIV crisis,
transport cost from port (Abidjan) to cityK ( θk) increases as a result of the conflict. An
increase in θk increases price of import (m) to the consumers
(∂P
mK0 ∂θk >0
)
but reduces
prices of exportables(∂PqK0 ∂θK <0
)
to the producers. The CIV crisis did not affect transport
cost from port of entry (non-Abidjan) to city J, but it is indirectly affected due to labor mobility between cities. Propositions 1-3 summarize the impacts of a higherθk.
The Effects of Trade Cost Shock to the Abidjan Route: Testable Predictions
A trade shock due to conflict in CIV (Abidjan) leads to
(1) shrinking of the spatial margins (i.e., SMI and SMS) around city K dependent on Abidjan port, and expansion of the margins around cityJ that uses ports other than Abidjan. This leads to a contraction of the integrated region around city K and an expansion around city J, but the overall effects on sectoral employment shares in areas around both cities are ambiguous without additional restrictions.
(2) The effects on employment shares are heterogenous with respect to the pre-crisis
extent of market access of a location (inversely related to the distance from city K and J ). (2.a) Around both cities, there is no change in employment pattern in areas with
very poor market access such that they remain in the isolated autarkic equilibrium both
before and after the trade cost shock;
(2.b) An increase in the employment share of agriculture in areas with better
pre-shock market access around K but an increase in the manufacturing share in similar areas around J;
Proof: Please see the online appendix.
Intuitions and Discussion
An increase in the transport cost for areas using port of Abidjan has the immediate
im-pact of increasing the relative price of the importable good in a location that was integrated
before the war. This reduces the maximized utility of the consumer in that location. This
triggers out-migration and changes in nominal wage and housing prices. The new
equilib-rium prices are determined in a range that fall between pre-shock and immediate post-shock
prices, resulting in a reduction in population in the areas around K and an increase in the areas aroundJ.
The result in proposition 1 that a higher transport cost shrinks the extent of integrated
region along the route of directly affected cityK by shifting the SMI inward towards the city center (K0) and extends it in areas around J by shifting the SMI outward (away from city center) can be seen from equations (5) and (6). The shift in SMI around J arises from an increase in population density and associated increase in productivity due to in-migration.
The inward shift of SMI aroundK is caused directly by the increase in relative import price and also a decrease in productivity due to out-migration. In areas around directly affected
market/city K, the autarkic region expands leading to an increase in manufacturing in areas which are farther away from K0 and were specialized in agriculture before the trade cost shock; the home based-manufacturing displacing specialized agriculture in this case.
It is clear from equation (5), that an increase in transport cost shifts the SMS inward as
well leading to a decrease in manufacturing employment in areas closer toK0. The overall impact on the employment shares for the entire area surround city K is thus ambiguous.
The movement of population and changes in manufacturing share of employment affect
the proportion of built-up areas in both the routes; the built-up density increases around
J and decreases around K (proposition 3).
The propositions 1-3 are based on the assumption of no population growth. With
population growth, proposition 3 would need to be modified. With positive population
of market access proposed by Redding and Turner (2015) that takes account of access to
all possible markets.
(5) Data
To estimate the impacts of the trade shock caused by the civil war in Cote d’Voire on
Mali and Burkina Faso, we utilize population census and satellite data sources. To detect
sunk investment, we rely on built-up density from global human settlement data, and the
employment data come from population censuses. Agglomeration is measured by
concen-tration of skilled (higher educated) labor, and the changes in provision of electricity is
captured by average night-light luminosity.
Population censuses are available for 1996 and 2006 for Burkina Faso and for 1998 and
2008 for Mali. The first period in the population censuses corresponds to the pre-CIV
crisis period and the last year right at the end of the war. The census data come with
dig-ital maps of communes in Mali, and of ‘departments’ in Burkina which are administrative
units similar to counties in the USA. We use digital maps from censuses to create
com-mune/department level panel data. The panel data set based on the population censuses
includes 371 department in Burkina and 629 communes in Mali, giving us a relatively rich
sample of 1,000 sub-districts for our empirical analysis.14
The source of built-up and population density data is the Global Human Settlement
Layer (GHSL) data set made available by European Joint Research Centre (Pesaresi et
al. 2015) and Columbia University, Center for International Earth Science Information
Network - CIESIN (2015). With spatially consistent information from four Landsat image
collections, these data are available for 1975, 1990, 2000 and 2014. The built-up data are
250 meter by 250 meters, whereas we use 1 km squares for the population grids. We
super-impose the digital maps from the censuses on the pixel-level data to estimate the percentage
of built-up area and population density at the commune/department levels. The GHSL
data on built-up density have at least two periods before the war which allow us to check
the pre-war trends for both population density and built-up density.
The data on the luminosity of night-lights are drawn from global satellite database.
The night-light data are available from 1992 to 2013.15 We focus on 1992-2011 and exclude
the last two years from the sample as data for some of sub-districts are missing in those
two years. We use the census borders to construct a panel at commune/department levels.
Our focus is on the average night-light luminosity per sq km. An important advantage of
the night-light data is that it is available before, during and after CIV civil war. To guard
against possible serial correlation, we follow the suggestion of Bertrand et al. (2004) and
take average over the relevant years. The pre-war years are divided into two sub-periods
(1992-1996 and 1997-2001) and the war years correspond to 2002-2007 and post war years
2008-2011.
The digital maps of the communes/departments and road network are used to compute
the distances from each commune center to all six trade routes identified in Figure 1. The
distance of a location is estimated as the ‘arc distance’ from the commune center to the
nearest point on the road along a route. Each commune/department is then assigned to
the route which is closest to it. Using this shortest distance, we compute distances from
the centroid of each commune to all West African cities with population of 35 thousand
or more in 1996 from the consolidated urban database by Blankespoor, Khan and Selod
(2017), which draws upon population data from Brinkhoff (2018).16 These arc distances
are combined with city population to define a measure of market access which is elaborated
in the empirical estimation section below.
15The night-light data are collected from a series of DMSP-OLS satellites during the period 1992-2013. In order to enable temporal analysis, we correct for the lack of in-flight calibration using the method in Wu et al. (2013) to adjust for the differences between sensors, acquisition times, and saturation. A newer satellite VIIRS started in 2013. The data from the earlier satellite (DMSP) may not be comparable to that from the new satellite.
(6) Empirical Issues and Strategy
(6.1) The Empirical Models
Employment Pattern: A Triple-Difference Strategy with Location
Fixed Effect
To investigate how the trade disruption caused by the civil war in Cote d’Ivoire may have
affected the resource allocation across the Abidjan and non-Abidjan areas in Mali and
Burkina Faso, we adopt an empirical model that takes advantage of the panel data by
combining sub-district level fixed effect with a triple-difference set-up. With a two-period
panel of employment shares, the regression specification is as follows:
Yija−Yijb=β0+β1DT +β2DN A+β3(DT ×DN A) +γZijt+εijt (7)
where Yija is the outcome variable j in commune i after the shock, and Yijb for the period
before the shock. DT is a dummy variable that takes on the value of 1 if a location is
in the integrated segment of the economy and thus is affected by the trade cost shock
and zero otherwise, and DN A is a dummy variable that takes on the value of 1 when a
location is in the non-Abidjan route and zero otherwise. This definition of DN A allows us
to focus better on the reallocation of population and economic activities away from the
adversely affected Abidjan route to the non-Abidjan routes. The coefficientβ3 is the focus of our analysis. Denoting an estimated parameter with a hat, ˆβ3 provides us the effect
of the trade shock on the non-Abidjan routes relative to the Abidjan route, taking into
account both the long-term changes unrelated to the CIV shock and the reallocation across
routes driven by mobile factors such as labor. Since the data on skilled labor also come
from the censuses, the analysis of spatial concentration of skilled labor also relies on the
Built-up and Night-Lights Density: A Quadruple-Difference
Strat-egy with Location Fixed Effect
We have richer time series data on built-up density and night-lights density which allows
us to compare the first-differences, thus adding another difference to the triple-difference
empirical model set-up for the employment analysis above. The empirical model becomes
one of a quadruple difference with location fixed effect. The estimating equation can be
written as below:
△Yijt =π0+π1DT +π2DN A+π3Dyr+π4(DT ×DN A) +π5(DT ×Dyr)
+π6(DN A×Dyr) +π7(DT ×DN A×Dyr) +γZijt+εijt
(8)
where △Yijt = Yijt −Yij(t−1), and Dyr is a time dummy defined appropriately for the post-war observation(s) given an outcome variable. For example, for built-up density as
the outcome variable, we use a yearly panel consisting of the following years: 1990, 2000,
2014. In this case, we define a dummy D2014 that takes on the value of 1 for △Yij2014 = Yij2014 −Yij2000 and zero for △Yij2000 =Yij2000−Yij1990.17 The focus of the analysis is on
the coefficient of the triple interaction term, i.e., π7. For night-lights, we can separate out
the effects of the war years from that of the post-war years; the specification includes a
dummy for war years [2002-2007] and another dummy for post-war years [2008-2011]. The
omitted category is the pre-war years in this case. The error term εijt could be spatially
correlated. To correct for possible spatial correlations, we cluster standard errors at the
route level.
The outcome variable Yijt is expressed in shares for employment, built-up density, and
skilled labor, and in logarithms for night-light luminosity. The dependent variables are
dif-ferenced to wipe out the effects of time-invariant location heterogeneity. This is especially
important in our analysis; for example, the labor-share in agriculture in a commune would
be determined in part by the land quality and agro-ecological conditions. Part of the
dif-ferences in employment shares observed between the Abidjan and non-Abidjan routes may
be driven by these differences in agricultural endowment rather than the trade cost shock
to the Abidjan route. For built-up density and skilled labor, the initial level of
agglomera-tion economies may play a role in addiagglomera-tion to the sunk investments in creating significant
differences between the Abidjan and non-Abidjan routes. To address this concern, we
include population density in 1975 as a measure of initial agglomeration economies in a
commune/department. The DID regressions condition on a vector of pre-war locational
attributes Zij0 which includes log of arc distance to the nearest route, a dummy indicating
if the communes are from Mali, in addition to log of population density in 1975. 18
(6.2) Defining Market Access
Many studies rely on the distance to the nearest city/town as a measure of market access.
It seems intuitive in the context of the simple theoretical model developed above where
distance to the nearest city (K orJ) is a sufficient statistic for market access of a location. However, for our empirical analysis this is likely to be too simplistic as each location has
access to a number of city/town markets of different size. It is also important to recognize
that all of the areas located at a given arc distance from a city do not have the same
market access. For instance, an area located close to an intersection of multiple trading
routes tends to have a much better access than an area located on a major route but far
from the intersection. This distinction is more consequential in countries such as Mali and
Burkina Faso which are predominantly agricultural and trade routes run through areas
which are rural and isolated from the urban areas.
Instead of defining a band around a route, we compute a measure of market access
suggested by Redding and Turner (2015). The market access variable is computed as:
mi = ln (
∑
h
Nh
d2ih
)
where dih is the distance of commune i to city h and Nh is the total population of city
h. The market access as defined above is the gravity measure widely used in the trade literature; it is equal to the weighted sum of the extent of the urban markets proxied by
their population. The weight is defined by the reciprocal of distance squared. By definition,
markets farther away are given lower weights.
(6.3) Heterogeneity w.r.t Pre-war Market Access and Determining
the Autarkic Comparison Areas
A substantial and mature literature shows that economic density in a location is
cor-related with the access to market19, and the theoretical analysis above suggests that
trade/transport shocks can have differential impacts depending on the extent of market
access of a commune/department during the pre-war period. Perhaps, most important
for our empirical analysis is the identification of the autarkic comparison areas through a
sequential search process noted earlier. To conduct this analysis over the distribution of
market accessmi, we divide it into 10 deciles. We then define a dummy for better market
access (dσ m) as:
dσm = 1 if σ > n, n= 2, ...9, σ= 3...10 = 0 otherwise
Incorporating the market access heterogeneity, the estimating equation for employment
shares can be written as:
Yija−Yijb=θσ0 +θ1σDN A+θσ2dσm+θ σ
3(dσm×DN A) +γσZijt+εσijt (9)
The focus is on the estimate of θσ
3 for various values of σ. An important insight from
proposition (1) is that the main effect of trade shock would be felt in the areas that are
integrated with the world market. We estimate the regressions for progressively higher
value of σ and check the statistical significance of the relevant coefficient to identify the areas that remain isolated both before and after the trade shock due to the CIV crisis.
(7) Empirical Results
(7.1) Characterizing the Pre-Crisis Equilibrium
We use data from the pre-crisis period to portray the pattern of population and built-up
densities and the employment structure in our study countries. We check for differences
in the employment structure between the Abidjan and non-Abidjan areas during the
pre-war period using census data. Panel A of Table 1 provides the estimates for sectoral
employment shares for the pre-war year available in the data set (1996 for Burkina Faso
and 1998 for Mali). The estimated coefficients are not different from zero numerically
or statistically. The pre-war period is thus characterized by a spatial equilibrium where
the non-Abidjan and Abidjan areas display no significant differences in either employment
structure. Evidence is similar for population (in levels); please see Panel B of Table 1. With
richer time series data in the pre-war period, the evidence on built-up density and
night-lights density in panel B of Table 1 suggest that these two routes did not differ significantly
in terms of the trends of these variables in the pre-war equilibrium.
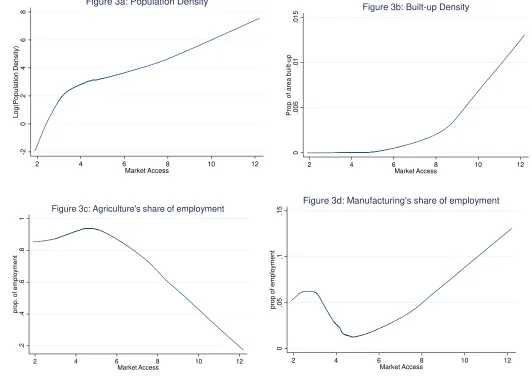
Figures 3a–3d depict the non-parametric plots of population, the proportion of built-up
area, and shares of agriculture and manufacturing in total employment against the gravity
measure of market access described in section 6.2 above. The relation between the share of
manufacturing employment and the measure of market access is convex, with a relatively
higher manufacturing share in areas with very low market access which declines initially
with an increase in market access and than increases sharply for areas with a market access
measure greater than 6. Employment share of agriculture displays the opposite pattern.
The relatively higher share of manufacturing in the areas with very poor market access
reflects the absence of inter-regional and international trade and their reliance on local
(home-based) manufacturing. The patterns of manufacturing and agricultural employment
with respect to market access thus confirm that in the pre-war period a sub-region remained
isolated from the urban markets due to poor market access. Both population and built-up
densities decline with a decrease in market access, consistent with the theoretical analysis.
The built-up density, however, tracks more closely the employment pattern in
predominance of manufacturing structures in these areas. For the areas with poor market
access (≤ 6), the proportion of built-up area is low and the curve is flat. This evidence
lends support to the definition of proportion of built-up area based on land used in housing
in the isolated region, and in housing plus manufacturing in the integrated region.
The pattern of employment points to a critical value of market access variable of around
4.5 which can be interpreted as an estimate of the spatial margin of market integration
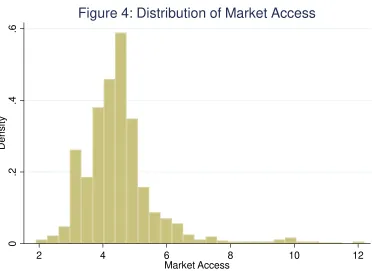
(SMI) in the pre-war period. Figure 4 shows the distribution of the communes/departments
by market access. The market access measure for about 60 percent of the communes falls
below the critical value 4.5. These are the communes/departments that did not engage in
long-distance trade and relied on local production for consumption during pre-crisis period.
(7.2) The Effects of Trade Cost Shock on the Employment Pattern
We utilize two rounds of census data to explore the impacts of trade/transport shock
on the employment structure along the Abidjan and non-Abidjan routes. In addition
to employment in manufacturing and agriculture, we also consider employment in trade
and other services. During the pre-crisis period, 91 percent of workers were engaged in
agriculture in the study countries. Among those employed in non-agriculture, most were
traders (5 percent), followed by manufacturing (2 percent) and rest in services (2 percent).
The second round of census data corresponds to 2006 for Burkina Faso and to 2008 for
Mali, both years are at around the time of the truce and conclusion of peace treaty in
Cote d’Ivoire in 2007. The estimates for employment shares should thus be considered
conservative as they relate to the immediate post-crisis years.
(7.2.1) Identifying the Comparison Autarkic Hinterland
An important insight from proposition (2.a) is that the areas with very poor market access are essentially isolated hinterland, and their employment structure is not likely to be
signif-icantly affected by the trade shock. The empirical analysis in section (7.1) above provides
suggestive evidence that, during the pre-CIV crisis period, the isolated hinterland consists
the average effects over a route is a weighted average of the zero effect in the autarkic
hinterland and the effect of the trade shock on the integrated areas. Since the theory
sug-gest that the trade shock to the Abidjan route will shift the SMI outward in the alternate
non-Abidjan routes, we expect the extent of the isolated region to shrink after the shock.
If an area remains isolated after the shock, the employment structure will not be affected
by the CIV trade shock, and any changes would reflect only the long-term factors in the
economy. This provides us with an estimate of the changes in the employment shares due
to the underlying trend in the economy and we need to take into account of this trend
when considering the effects of the CIV trade shock on employment share in the areas with
better market access.
To identify the autarkic areas unaffected by the CIV shock, we define a series of dummies
representing better market access dσ
m for σ = 0.30,0.40, ....0.80, following the procedure
discussed in section (6.3) above. For example, when σ= 0.30, the dummy dσ
m takes on the
value of 1 for the areas with a market access measure higher than 0.30. We progressively
estimate equation (9) above for higher values of σ and test the null hypothesis at each σ
that the coefficient of better market access dummy dσm is not significantly different across
Abidjan and non-Abidjan routes, i.e.,H0(σ) : ˆθ3σ = 0 in estimating equation (9) above. It is
important to appreciate that with a high enough value ofσused to define the better market access dummy, the subset with dσ
m = 1 consists only of the areas integrated with the rest
of the international market, and the null hypothesis will thus be rejected according to the
theory discussed above. We thus search for the lowest value of σ at which the interaction term (dσ
m×DT)in estimating equation (9) above is statistically significant, thus rejecting
the null hypothesis, and identify this turning point as the spatial margin of integration
(SMI) after the trade shock.
The estimates from this exercise are presented in Figure 5a-5c. Figure 5a shows the
estimates for the share of agriculture in total employment along with the 90 percent
confi-dence interval; the eviconfi-dence shows thatH0(σ) : ˆθ3σ = 0 cannot be rejected at the 5 percent
significant at the 10 percent level at σ = 0.60.20 This suggests that the spatial margin of
integration (SMI) has shifted outward along the non-Abidjan routes as a result of the CIV
trade shock, consistent with the theoretical insights in proposition (2.a). The evidence in
Figure 5a thus suggests that the areas that belong to the lower 50 percentile of the
mar-ket access distribution in the pre-war period did not experience any significant change in
the agricultural employment share as a result of the CIV trade shock. The corresponding
estimates for the share of manufacturing employment in Figure 5.b show a similar spatial
pattern; the null hypothesis of no difference between Abidjan and non-Abidjan routes (i.e,
zero effect of the trade shock) cannot be rejected at the 5 percent level for σ ≤ 0.60, but, again, there is a sharp change in the magnitude of the effect fromσ = 0.50 to σ= 0.60,and the null hypothesis can be rejected at the 10 percent level when σ = 0.60. Figure 5.c pro-vides similar evidence for trade and other services. The evidence in Figures 5a-5c thus
suggests that the spatial margin of integration (SMI) in the post-war period falls in the
interval between σ = 0.50 and σ= 0.60.
(7.2.2) The Effects of the Trade Shock on the Employment Pattern
in the Integrated Areas
Motivated by the evidence that the SMI in the post-war period belongs in the interval
σ ∈ (0.50,0.60), the central case we consider is based on a cut-off of σ = 0.55. Thus the central-case estimates focus on the average effect on the whole integrated sub-economy in
Abidjan vs. non-Abidjan routes. This implies that the “treatment dummy” in equation
(7) is defined as DT = 1 if a location falls in the upper 45 percentiles of market access
distribution, and zero otherwise. For notational clarity we write the “treatment” dummy
asD0.45
T for the central case. Later we consider possible heterogeneity in the effects of CIV
shock within the integrated segment, by defining D0.40
T = 1 when a location falls in the
upper 40 percentiles of market access (pre-war) distribution. We also analogously define
another treatment dummy D0.30
T .
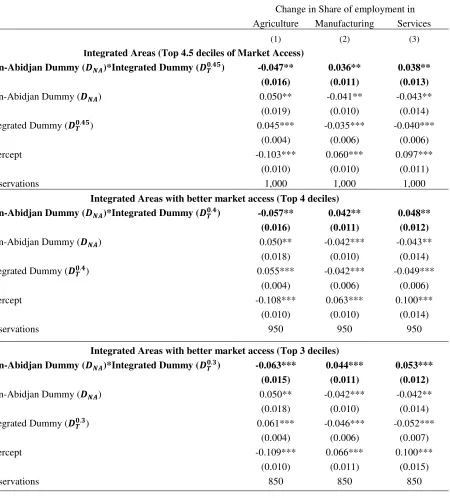
The Average Effects for the Integrated Region in a Route
We begin the discussion with the estimates for the central case, i.e., with D0.45
T as the
treatment dummy; please see panel A of Table 2. For agriculture (column 1 of Table 2),
the estimated intercept implies a reduction of its employment share by 10.3 percentage
points in the Abidjan hinterland because of the underlying long-term factors, and the
corresponding estimate for the non-Abidjan hinterland is a reduction of 5.3 percentage
points. Proposition (2.b) predicts the trade shock to increase the proportion of agricultural employment in the integrated areas along the Abidjan route (directly affected by the CIV
war); the estimate shows a 4.5 percent increase in the share of agricultural employment
compared to the autarkic hinterland. In sharp contrast, along the non-Abidjan route,
the integrated ares experienced a negative impact (-4.7 percentage points) on the share
of agricultural employment. Thus, the trade shock accelerated the decline of the share of
agricultural employment in the integrated areas in non-Abidjan route relative to that in
the Abidjan route.
The estimates effects on the share of manufacturing employment reported in column 2 of
Table 2. The estimates in panel A shows that the effects of the trade shock on
manufactur-ing employment was very different compared to the effects on agriculture discussed above.
The intercept estimate suggests that the share of manufacturing employment increased by
6.3 percentage points in the autarkic hinterland due to structural change unrelated to the
trade shock. The trade shock resulted in a slower structural change in favor of
manufactur-ing in the integrated segment of the Abidjan route; the share of manufacturmanufactur-ing employment
increased by only 2.5 percentage points. The evidence for the non-Abidjan route in
con-trast shows that the pace of structural change in favor of manufacturing accelerated in the
integrated segment due to the CIV trade shock by 3.6 percentage points relative to the
Abidjan route. The estimates for employment in trade and other services in column 3 of
Table 2 show a pattern similar to that found for the manufacturing employment. The CIV
trade shock resulted in a lower growth in the employment share of trade and services in
the integrated segment of the Abidjan route, but led to opposite effect in the integrated
segment of the non-Abidjan route. This reallocation across routes (through labor mobility)
resulting difference in the regional development is the focus of the paper.21
Heterogeneity within the Integrated Region
To check if the effects of trade shock vary across locations within the integrated segment,
we report estimates of the effects for treatment areas defined for progressively better
pre-war market access. The estimates corresponding to the D0.40
T are reported in panel B of
Table 2, and those for D0.30
T are in panel C of Table 2. A comparison of the estimates in
panel B and panel C with those in panel A shows the pattern of the effects remain same
for changes in the employment share of agriculture, manufacturing, and trade and services.
However, the numerical magnitudes vary by the pre-war market access; the effects of the
CIV trade shock on the structural change on the integrated segment of the non-Abidjan
route are stronger for a location with better pre-war market access. The decline in the
share of agricultural employment in the integrated non-Abidjan areas was on average 5.7
percentage points when the treatment locations consist of locations with pre-war market
access in the upper 40 percentile of the distribution (i.e., for the treatment dummy D0.40
T )
, and the effect increases to 6.3 percentage points for the areas in the upper 30 percentiles
of the pre-war market access distribution (i.e., forD0.30
T ). This implies a 21 percent higher
impact forD0.40
T , and a 34 percent higher impact forDT0.30 compared to the average impact
over the whole integrated segment reported in panel A of Table 2. The estimates for the
employment shares of manufacturing, and trade and services also show a monotonically
increasing effect of the CIV trade shock with better pre-war market access within the
integrated zone, but the numerical magnitudes are much smaller.
(7.3) Long-term Effects of Temporary Trade Shock
The evidence discussed above in section (7.2) suggests that the temporary trade shock
caused by the CIV civil war led to significant changes in the employment pattern in the
non-Abidjan route when compared to the directly affected Abidjan route. In this section, we
analyze whether there are reasons to expect that the changes observed in the employment
pattern may be longer-lasting, and may not revert back to the pre-war pattern of resource
allocation and sectoral specialization. If the empirical estimates are capturing only the
reallocation of mobile factors without any sunk investments, then one would expect the
share of Abidjan route in total trade to revert back close to its original level after the end
of the CIV-crisis. Empirical evidence in this regard is quite the contrary. For Burkina
Faso, we have trade flow data till 2016 which is plotted in Figure 2a. The analysis of trade
flow confirms that the share of maritime trade flow through Abidjan route never recovered
to its pre-war level even 10 years after the end of the CIV crisis. This alerts us to the
possibility of differential levels of sunk investments in Abidjan and non-Abidjan routes. If
the CIV war led to under-investment public goods in the Abidjan route, one would expect
that firms and people would find it costly to relocate back to the Abidjan areas after the
end of the war in 2007. The sunk investments can create “quasi rents” a la Milgrom and
Roberts (1992), and slow down the process of the readjustment and reversion back to the
original equilibrium. We consider two potential sources of such sunk investments: built-up
density and public non-transport infrastructure provision such as electricity. As the trading
and general economic activity suffered in the Abidjan route because of the CIV civil war,
it is likely that government reallocated public investment from the Abidjan areas to the
non-Abidjan areas. We analyze the effects of the CIV shock on night-lights density as an
indicator of public investment in electricity.
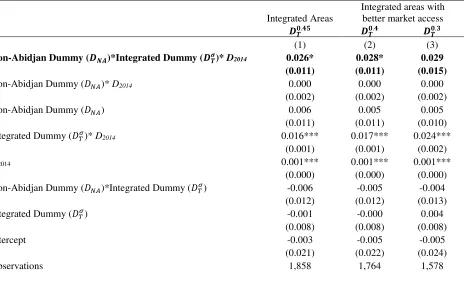
Evidence on Built-up Density
It is difficult to find data on indicators of sunk investments, but the recently available
global settlement data provide an excellent source especially in the context of developing
countries. We take advantage of the global settlement data to explore the effects of the CIV
shock on built-up density as a measure of sunk investment. The estimates of the effects of
the CIV shock on the proportion of area built-up density are reported in Table 3. The effect
of the CIV shock on the integrated areas of the non-Abidjan route in this case is estimated
as a quadruple difference, please see the coefficient of the (D0.45
T ×DN A×D2014) in row
over the whole integrated segment along the non-Abidjan route; the estimate suggests that
the proportion of area built-up experienced a 2.6 percentage points increase as a result of
the CIV shock compared to that in the integrated segment of the Abidjan route. This
supports the idea that the CIV shock created preconditions for longer-term effects on the
employment structure and the effects are likely to be persistent.
The estimates for possible heterogeneity within the integrated segment shows that the
point estimates increase monotonically, but the numerical magnitudes are not substantial
(see column 2, row 1 for the estimate for D0.40
T , and column 3, row 1 for D0T.30).
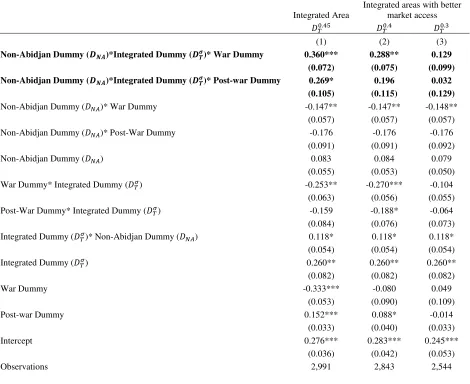
Evidence on Night-lights Density
As noted earlier, an important channel through which the CIV civil war might have led to
persistent regional effects in Mali and Burkina Faso is reallocation of non-transport
infras-tructure investments by the government. A salient example of such public investment in a
developing country is the electricity generation and distribution network. Since electricity
is a general input used by most of the economic activity, it provides us a good measure of
complementary public inputs valued by the private entrepreneurs. In addition, electricity
is also important as amenity by providing lighting in residential housing. We thus use
night-light density as a measure of changes in electricity provision by the government in
response to the CIV crisis. The results for the effects of trade shock on the night-light
density are reported in Table 4.
With richer time series of data, the analysis of night-lights can differentiate the effects
during the war period (2002-2007) from the post-war impact. The estimates for the war
period are reported in row 1 of Table 4; the column 1 shows that the average effect is positive
in the integrated areas of the non-Abidjan route as a whole. The estimate suggests that, in
comparison to the integrated areas in the Abidjan route, the non-Abidjan integrated areas
had a 36 percent higher growth in night-lights density during the war period. The estimate
in the second row for the top 40 percentiles of market access indicates a 27 percent higher
growth in the night-lights density in the integrated areas of non-Abidjan route on average.
The night-light density results thus point to possible path dependence in economic density
did not revert back to the pre-shock equilibrium.
The estimates for possible heterogeneity within the integrated segment (for D0.40
T and
D0.30
T ) show that the effect of CIV shock declines substantially for the areas with the highest
pre-war market access. This is consistent with the observation that changes in night-lights
density may be very low in areas with almost universal electricity access and high income
to begin with in the pre-war period.
Evidence on Skilled Labor
The role played by agglomeration externalities generated by concentration of high-skilled
population is a central mechanism that creates long-term persistence and path-dependence.
In section 7.3.2 above, we discuss evidence suggesting that the CIV crisis led to reallocation
in favor of manufacturing employment in the integrated areas of non-Abidjan route. Since
manufacturing activities are more likely to generate agglomeration externalities, we would
expect reallocation of skilled labor to play a role. Table 5 reports the estimated effects
of the CIV trade shock on the proportion of working population with secondary or more
schooling. The evidence in all three columns suggests that the trade shock increased the
concentration of skilled labor in the integrated areas of non-Abidjan route. The estimate
in column 1, row 1 of Table 5 implies a 1.6 percentage points higher share of skilled labor
on average in the integrated areas of non-Abidjan route as a whole.
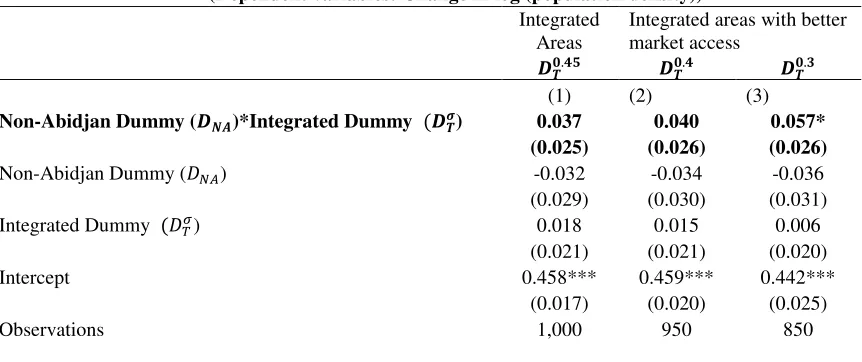
(7.4) Effects on Population Density
A central mechanism through which the reallocation of economic activity occurs across
routes is movement of people from the adversely affected areas. To provide some evidence on
the role played by mobility of people, we look at the effects of the CIV crisis on population
growth. The estimates are reported in Table 6. The point estimates for the effects are
positive in all three columns corresponding to DT0.45,DT0.40, andDT0.30 , but the estimates in
the first two columns are not precise. The estimate in the third column shows that the areas
with pre-war market access in the upper 30 percentiles of the distribution experienced a