Munich Personal RePEc Archive
Trade compatibility between Afghanistan
and India: An empirical evaluation
Wani, Dr. Nassir Ul Haq
Kardan University
31 January 2018
Online at
https://mpra.ub.uni-muenchen.de/86432/
Journal of Economics and Management Sciences
VOLUME
1
,
ISSUE
1
JANUAR
Y
2
0
1
8
Trade Compatibility Between Afghanistan and India:
An Empirical Evaluation
Dr. Nassir Ul Haq Wani1
Abstract
In order to expedite the flow of trade the number of regional trade agreements has grown among
the countries since the globalization has started. The dramatic changes are quiet visible as these RTA are lucrative and attractive for the countries to manage their trade. Afghanistan started its regional
trade with neighboring countries after joining SAARC in 2008. The study period is covering 8 years data from 2008-2015 by employing SITC Revision III classification. The prime focus of this article is
to evaluate the trade compatibility between Afghanistan and India by employing Revealed
Compara-tive Advantage (RCA) and Trade Intensity Index (TII). From the results it is quite clear that the trade between two countries is proceeding in India’s favor. Afghanistan enjoys comparative advantage in just
one product category and for the rest of the products the values of RCA are less than 1. India enjoys RCA in four product categories. The paper concludes with this recommendation that it will be better for both countries to keep promoting the export of the products which has the RCA ˃ 1. India is leading the existing export market because of its strong export base. Both countries should strive to improve their export potential products, in order to gain the market and to be compatible and competitive partners with one another.
JEL Classification: F1, F12, O24
Keywords: Afghanistan, India, Trade Policy
1. Introduction
To throw light on the possibilities and limits of meaningful coalitions among emerging coun-tries, this study focuses on Afghanistan and India trade relations. The study evaluates the structure of comparative advantage for Afghanistan and India trade and the change in the economic scenario over a period of 8-year period from 2008 to 2015. The study attempted to evaluate Afghanistan–India trade
using Revealed Comparative Advantage (RCA) and Trade Intensity Index (TII). Although Afghanistan
has made momentous progress over the past decade despite continuing security challenges: GDP per capita increased more than threefold between 2003 and 2013, rising from $198 to $678 (World Bank Development Indicators, 2014).
Journal of Economics and Management Sciences
VOLUME
1
,
ISSUE
1
JANUAR
Y
2
0
1
8
[image:3.595.49.549.198.256.2]The main idea of internationalization of economies is based on the escalation of international trade. It is because of increasing trade and regional integration, there is a possibility in managing a successful transition in any economy especially in case of Afghanistan. In common parlance, the reim-bursements from following regional integration are abundant and thus include economies of scale, in-crease local supply capacity and improve access to markets and regional infrastructure and much more.
Table 1: Afghanistan’s Export Growth Rate
Year 2008 2009 2010 2011 2012 2013 2014 2015 Growth
Per-centage
0.0068 0.0065 0.0051 0.0042 0.0047 0.0055 0.0061 0.0073
Source: Calculation based on data from UN COMTRADE database SITC Revision III.
For a landlocked country such as Afghanistan, regional integration is exclusively imperious as
it leads not only in trade promotional activities but encourages increased trade and connectivity within the regions followed by the global economy. The regional integration between Afghanistan and India is thus not a supernumerary for amalgamation with the rest of the world. Rather, it must be bolstered with
wider economic assimilation that makes the most of the region’s comparative advantages.
Table 2: India’s export Growth Rate
Year 2008 2009 2010 2011 2012 2013 2014 2015
Growth
Percent-age
1.16 1.44 1.47 1.69 1.62 1.82 1.72 1.70
Source: Calculation based on data from UN COMTRADE database SITC Revision III
From Table 1 and 2, there is a lot of divergence in the export growth of both the countries. Looking at the digits of growth of exports in Afghanistan perspective, the values are minuscule and thus present that Afghan economy is still lingering in its export sector, whereas in case of India a growth of
1.16 per cent in 2008 is quiet good sign of economic health. The process of growth continued and has
grown in the next years.
1.1: Objectives of the Study
• To evaluate the trade Compatibility between Afghanistan and India.
• To analyze the degree of intensity of trade between the two economies.
1.2: Data type and nature of sources
The type of research data is secondary, collected from UNCOMTRADE. The data is time series
in nature as it is about the exports and imports for Afghanistan and India. The trading classification is
[image:3.595.55.545.406.490.2]Journal of Economics and Management Sciences
VOLUME
1
,
ISSUE
1
JANUAR
Y
2
0
1
8
1.3: Research Methods employed
In this study Trade Intensity Index (TII) and Revealed Comparative Advantage (RCA) Index has been used to see trade compatibility between Afghanistan and India. The trade intensity index (TII) is
used to determine whether the value of trade between two countries is greater or smaller than would be
expected on the basis of their importance in world trade and is defined as:
Trade intensity index (TII) = (XIA/ XIT) / (XWA/ XWT)
Where XIA and XWA are the values of country I’s exports and world exports to country A’s and XIT and XWT are Country I’s total export and total world export respectively. An index values greater than 1 indicate an “intense” trade relationship ( as used by Batra et al (2005) and Raghuramapatruni
(2009).
Revealed Comparative Advantage Index shows how competitive is a product in countries export
compared to the products share in world trade and was introduced by Balassa in 1965 (Balassa 1965,
1977). A product with high RCA is competitive and can be exported to countries with low RCA. The measures of Revealed Comparative Advantage (RCA) have been used to help assess a country’s export potential. The RCA index of country I for product J is often measured by the product’s share in the country’s exports in relation to its share in world trade
Revealed Comparative Advantage (RCAij) = (XIJ/ XIT) / (XWJ/ XWT)
Where Xij and Xwj are the values of country I’s exports of product J and world exports of prod
-uct J and where XIT and XWT refer to the country’s total exports and world total exports. A value of
less than unity implies that the country has a revealed comparative. A value of less than unity implies that the country has a revealed comparative disadvantage in the product.
2. Findings and Data Analysis
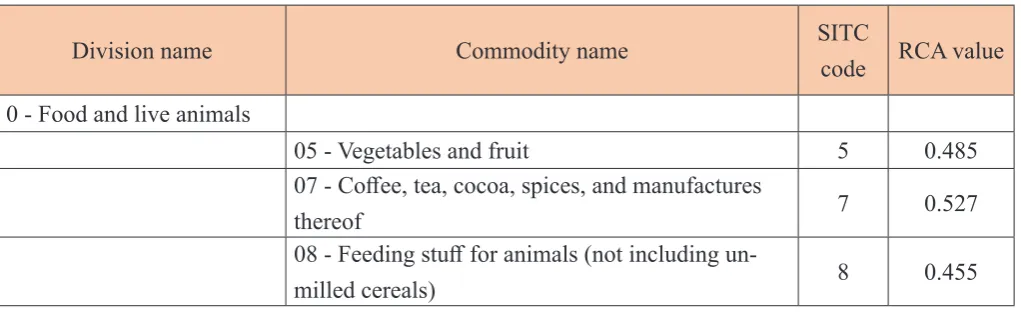
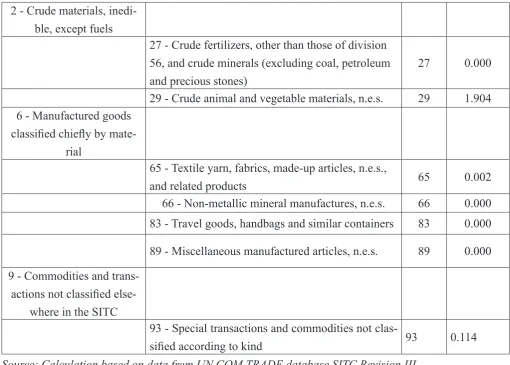
[image:4.595.58.569.619.775.2]The mean Revealed Comparative Advantage (RCA) of India and Afghanistan for the period 2008 to 2015 for 10 product categories according to SITC Rev III codes of products is presented in the following table 3 and 4.
Table 3: Mean RCA for Afghanistan and India from 2008-2015.
Division name Commodity name SITC
code RCA value
0 - Food and live animals
05 - Vegetables and fruit 5 0.485
07 - Coffee, tea, cocoa, spices, and manufactures
thereof 7 0.527
08 - Feeding stuff for animals (not including un
Journal of Economics and Management Sciences
VOLUME
1
,
ISSUE
1
JANUAR
Y
2
0
1
8
2 - Crude materials,
inedi-ble, except fuels
27 - Crude fertilizers, other than those of division
56, and crude minerals (excluding coal, petroleum
and precious stones)
27 0.000
29 - Crude animal and vegetable materials, n.e.s. 29 1.904 6 - Manufactured goods
classified chiefly by mate -rial
65 - Textile yarn, fabrics, made-up articles, n.e.s.,
and related products 65 0.002
66 - Non-metallic mineral manufactures, n.e.s. 66 0.000
83 - Travel goods, handbags and similar containers 83 0.000
89 - Miscellaneous manufactured articles, n.e.s. 89 0.000
9 - Commodities and
trans-actions not classified else -where in the SITC
93 - Special transactions and commodities not
clas-sified according to kind 93 0.114
Source: Calculation based on data from UN COM TRADE database SITC Revision III.
From the above table 3, the mean RCA for Crude animal and vegetable materials, n.e.s. (29)
is greater than one, thus implying that Afghanistan has a revealed comparative advantage in exporting this product to India. The products under (6-69) stands for Manufactured goods classified chiefly by material, which (65) is the code for Textile yarn, fabrics, made-up articles, n.e.s., And related products.
And (66) for Non-metallic mineral manufactures, n.e.s. The mean RCA for these products is less than
One, Afghanistan has better advantage for exporting these products. The products codes (83), for Travel
goods, handbags and similar containers and (89), for Miscellaneous manufactured articles, n.e.s. Are
the products which have a Mean RCA less than One, Afghanistan gains no advantage in exporting these
products to India. The products under (9-99) codes stands for Commodities and transactions not
[image:5.595.50.561.73.438.2]classi-fied elsewhere in the SITC, in which Afghanistan exports only the products under code of (93), Special transactions and commodities not classified according to kind. The Mean RCA for these products is less than one; it is no advantage in exporting these products to India.
Table 4: Mean RCA for India and Afghanistan from 2008-2015
Division name Commodity name SITC
code RCA value
0 - Food and live animals
00 - Live animals other than animals of
Journal of Economics and Management Sciences
VOLUME
1
,
ISSUE
1
JANUAR
Y
2
0
1
8
01 - Meat and meat preparations 1 0.1346
02 - Dairy products and birds’ eggs 2 0.5106 03 - Fish (not marine mammals),
crus-taceans, molluscs and aquatic inverte-brates, and preparations thereof
3
0.0538 04 - Cereals and cereal preparations 4 0.0586 05 - Vegetables and fruit 5 0.0175 06 - Sugars, sugar preparations and
honey 6 0.0816
07 - Coffee, tea, cocoa, spices, and man
-ufactures thereof 7 0.2935
08 - Feeding stuff for animals (not in
-cluding unmilled cereals) 8 0.0116 09 - Miscellaneous edible products and
preparations 9 0.0304 1 - Beverages and tobacco
11 – Beverages 11 0.0034 12 - Tobacco and tobacco manufactures 12 0.8343 2 - Crude materials, inedible,
except fuels
21 - Hides, skins and furskins, raw 21 0.0007 22 - Oil-seeds and oleaginous fruits 22 0.0123 23 - Crude rubber (including synthetic
and reclaimed) 23 0.0154 24 - Cork and wood 24 0.0001 25 - Pulp and waste paper 26 0.0472
27 - Crude fertilizers, other than those of
division 56, and crude minerals (exclud -ing coal, petroleum and precious stones)
27 0.0652
29 - Crude animal and vegetable
materi-als, n.e.s. 29 0.3253 3 - Mineral fuels, lubricants and
related materials
33 - Petroleum, petroleum products and
related materials 33 0.0051 4 - Animal and vegetable oils,
fats and waxes
42 - Fixed vegetable fats and oils, crude,
Journal of Economics and Management Sciences
VOLUME
1
,
ISSUE
1
JANUAR
Y
2
0
1
8
43 - Animal or vegetable fats and oils,
processed; waxes of animal or vegetable origin; inedible mixtures or preparations
of animal or vegetable fats or oils, n.e.s.
43 0.0000
5 - Chemicals and related prod-ucts, n.e.s.
51 - Organic chemicals 51 0.4385
52 - Inorganic chemicals 52 0.2456 53 - Dyeing, tanning and coloring
mate-rials 53 0.0118
54 - Medicinal and pharmaceutical
prod-ucts 54 1.2054
55 - Essential oils and retinoid and perfume materials; toilet, polishing and cleansing preparations
55 0.2451
57 - Plastics in primary forms 57 0.0567 58 - Plastics in non-primary forms 58 0.0564 59 - Chemical materials and products,
n.e.s. 59 0.0823
6 - Manufactured goods classified chiefly by material
61 - Leather, leather manufactures, n.e.s.,
And dressed furskins 61 0.6659 62 - Rubber manufactures, n.e.s. 62 0.5877
63 - Cork and wood manufactures (ex
-cluding furniture) 63 0.0095 64 - Paper, paperboard and articles of
paper pulp, of paper or of paperboard 64 0.0370
65 - Textile yarn, fabrics, made-up arti
-cles, n.e.s., And related products 65 2.4161 66 - Non-metallic mineral manufactures,
n.e.s. 66 0.0182
67 - Iron and steel 67 0.0274 68 - Non-ferrous metals 68 1.1816 69 - Manufactures of metals, n.e.s. 69 0.3994 7 - Machinery and transport
equipment
71 - Power-generating machinery and
equipment 71 0.0331 72 - Machinery specialized for particular
Journal of Economics and Management Sciences
VOLUME
1
,
ISSUE
1
JANUAR
Y
2
0
1
8
73 - Metalworking machinery 73 0.1028 74 - General industrial machinery and
equipment, n.e.s., And machine parts, n.e.s.
74 0.0767
75 - Office machines and automatic da
-ta-processing machines 75 0.0071 76 - Telecommunications and
sound-re-cording and reproducing apparatus and equipment
76 0.0091
77 - Electrical machinery, apparatus and appliances, n.e.s., and electrical parts thereof (including non-electrical counter-parts, n.e.s., of electrical household-type equipment)
77 0.2944
78 - Road vehicles (including air-cushion
vehicles) 78 0.0276 79 - Other transport equipment 79 0.0296 8 - Miscellaneous manufactured
articles
1 - Beverages and tobacco 81 - Tools, implements, cutlery, etc of
base metal 81 0.0228
82 -Miscellaneous articles of base metal 82 0.1396 83 - Nuclear reactors, boilers, machinery,
etc 83 0.2785
84 - Electrical, electronic equipment 84 2.5535 85 - Vehicles other than railway,
tram-way 85 0.2735
87 - Aircraft, spacecraft, and parts
there-of 87 0.0436
88 - Ships, boats and other floating struc
-tures 88 0.0338
89 - Arms and ammunition, parts and
accessories thereof 89 0.3544 93 - Miscellaneous manufactured articles 93 0.0311 Source: Calculation based on data from Uncomtrade database SITC Revision III.
The commodities with product category SITC codes 54, 65 and 68 are beneficial ones, as for these India is getting benefit in exporting these products to Afghanistan as the values are greater than
1 and rest commodities do have the value below 1, thus no trade latency. Now looking at the paradigm of trade intensity, the two nations are getting too close in trade relations with every passing year. The
Journal of Economics and Management Sciences
VOLUME
1
,
ISSUE
1
JANUAR
Y
2
0
1
8
[image:9.595.44.551.142.315.2]from the Indian perspective, the pace of linkage is fast, but Afghanistan is also not leaving any stone unturned to show its presence in the Indian trade structure.
Table 5: Trade Intensity Index between Afghanistan and India
Year Trade Intensity Index between Afghanistan and India
Trade Intensity Index between .
India and Afghanistan
2008 5.57 8.37
2009 4.34 5.65
2010 2.34 4.54
2011 2.14 4.97
2012 2.67 4.11
2013 2.79 5.62
2014 3.02 7.79
2015 6.74 9.56
Source: Calculation based on data from UN COMTRADE database SITC Revision III.
3. Conclusion and Recommendations
The study aimed at assessing the structure of comparative advantage in Afghanistan and India and the change in the scene over a period from 2008 to 2015. Afghanistan and India has a good trade relationship since past centuries, this relation has become stronger when Afghanistan join SAARC in
2008. It is obvious that Afghanistan accelerates its exports and trade relations and meets better oppor -tunities after joining SAARC.
Afghanistan exports in total 9 products to India, from which Afghanistan has comparative advan
-tage only in one commodity with product code (29) namely tanning, dyeing extracts, tannins, derives, pigments. Moreover, India exports 57 products to Afghanistan from which India has good competitive
advantage in three product categories namely Medicinal and pharmaceutical products (68), Non-ferrous metals and two other products with high level of competitive advantage are products with codes of (65),
Textile yarn, fabrics, made-up articles, n.e.s., And related products and Nuclear reactors, boilers, ma
-chinery (84). it is quite clear that India gain more advantage in exporting these products to Afghanistan. The paper has also evaluated the trade intensity index for both countries to examine their intensity in
trade. Both the economies are having intense level of trade latency with each other. The trade intensity
of India is better than Afghanistan, as India rules the export market. The export health of the Afghan
-istan is not that good, even it is worse. Afghan-istan exports only 9 products to India. It gives a policy implication that Afghanistan needs to take the advantage of the geographical location to expand and diversify its export base and India should effort to capture Afghan market and replace the countries with
Journal of Economics and Management Sciences
VOLUME
1
,
ISSUE
1
JANUAR
Y
2
0
1
8
References
1. Balassa, B. (1965). Trade Liberalization and “Revealed” Comparative Advantage, The Manchester School. 99-123.
2. Balassa, B. (1977) “‘Revealed’ Comparative Advantage revisited: An analysis of relative
export shares of the Industrial Countries, 1953-1971”. The Manchester School of Econom
-ic & Social Studies, 45(4): 327-44
3. Batra, A., Amita, N., & Khan, Z. (2005). Revealed Comparative Advantage: An analysis for India and China. Indian Council for Research on International Economic Relations (ICRIER), Working Paper No. 168, New Delhi.