Causal relationships between physical, mental and
social health-related factors among the Japanese
elderly: A chronological study
Motoyuki Yuasa1*, Tanji Hoshi2, Takashi Hasegawa2, Naoko Nakayama3, Toshihiko Takahashi2, Sugako Kurimori4, Naoko Sakurai5
1Graduate School of Medicine, Juntendo University, Tokyo, Japan; *Corresponding Author: moyuasa@juntendo.ac.jp
2Graduate School of Urban System Science, Tokyo Metropolitan University, Tokyo, Japan
3Graduate School of Nursing, Keio University, Kanagawa, Japan
4Graduate School of Nursing, Ibaraki Christian University, Ibaraki, Japan
5School of Nursing, Tokyo Jikeikai Medical College, Tokyo, Japan
Received 23 December 2011; revised 16 January 2012; accepted 3 February 2012
ABSTRACT
The World Health Organization defines health as a state of physical, mental and social well being. This study was conducted to explore chrono-logical relationships between physical, mental and social factors. Among urban-dwelling elderly aged 65 years and over, data were collected via a self-report questionnaire in 2001 and 2004. The three health-related latent factors were identified with nine measurement variables by an explo- ratory factor analysis. A structural equation mo- deling method was used to analyze underlying relationships among the three factors with a cross-lagged model and a synchronous model. A total of 7683 individuals aged between 65 and 84 years were analyzed. The three-year prior and current physical health significantly affected so-cial health as well as mental health, and this ef-fect appeared to be stronger in males compared to females. Maintenance of physical health may be crucial to support mental and social health among elderly individuals.
Keywords:
Physical Health; Mental Health;
Social Health; Elderly; Japan
1. INTRODUCTION
The word “health” is derived from the Old English word “hoelth”, which meant a state of being sound and was generally used to infer a soundness of the body [1]. The most commonly cited definition of health is one ac-cepted by the World Health Organization (WHO): health is a state of complete physical, mental and social well
being and not merely the absence of disease or infirmity (International Health Conference, 1946). To date, how-ever, this definition has been criticized for being utopian, inflexible and unrealistic [2]. Saracci [3] also criticized it, concluding that the state of health the WHO formalized corresponds much more closely to happiness than to health. Bircher [4] asserted that the unlimited, idealistic aspect of the WHO definition does not provide an opera-tional definition relevant to the health care system. In-stead, he redefined health as being a dynamic state of well being characterized by a physical, mental and social potential, which satisfies the demands of a life commen-surate with age, culture, and personal responsibility. If the potential is insufficient to satisfy these demands, the state is disease. Nevertheless, these authors highly ap-preciated that the WHO definition represented a major advance by widening health to the mental and social di-mensions [3,4]. These three components of health are now commonly embraced worldwide.
2. METHODS
2.1. Study Setting and Subjects
This prospective cohort study was initiated in Sep-tember 2001 and implemented a questionnaire survey for elderly individuals aged 65 years and over who were home-dwellers in urban areas in the suburb of metro-politan Tokyo, Japan. The study setting had a population of approximately 140,000 as of 2001 with 9.6% of the individuals aged 65 years and older among the total population. This percentage of elderly individuals was smaller compared to the national average of 17.3% in 2000. Of 16,462 eligible people, we obtained responses from 13,195 elderly individuals. They returned by mail the self-administered questionnaire attached with a writ-ten informed consent form that expressed their inwrit-tention to participate in the study. In September 2004, the second set of questionnaires with the same contents as the 2001 survey were mailed to the subjects who responded to the 2001 survey. A total of 8558 subjects answered, whereas 505 had moved, 914 had died and 3218 did not respond. We followed up all of the participants until August 31, 2007, and ultimately collected individual data, deceased or living, for a total of 8162 subjects through the mu-nicipal residents registry.
2.2. Measurement Variables
To estimate a chronological relationship among the three latent factors of physical, mental and social health, we defined the factors using observed variables obtained in the 2001 survey via an exploratory factor analysis. This was performed to fit the observed variables to the corresponding latent factors with maximum likelihood in a Promax oblique rotation using IBM SPSS Statistics 20 for Windows (IBM Inc., New York, USA). As Table 1 shows, all of the observed variables were categorized into three factors.
[image:2.595.307.540.110.293.2]Factor 1 was labeled a “mental health-related factor” and consisted of three variables including self-rated health, self-rated health compared to the previous year and life satisfaction. Self-rated health was assessed on a four-point Likert scale to determine perceived overall health with the question: “In general, how would you say your health is?” The answer was selected from the fol-lowing options: very poor, poor, fair and excellent [12, 13]. The score ranged from 1 to 4 in the same respective order, such that higher scores indicated a greater per-ceived health. If not known, subjects reper-ceived a score of zero. Self-rated health compared to the previous year was determined on a three-point Likert-scale using the fol-lowing question: “How is your current health compared to your health last year?” The respondents chose one answer among the following: poorer, may or may not be better and better. The score ranged from 1 to 3 in the
Table 1. Exploratory factor analysis of observed variables from the 2001 survey.
Factor loading
Factor 1 Factor 2 Factor 3
Self-rated health 0.805 0.030 –0.033
Self-rated health compared to
the previous year 0.674 –0.043 0.027 Life satisfaction 0.373 –0.053 0.206
IADL score 0.062 0.813 –0.014 BADL score –0.030 0.536 –0.092
Number of comorbidities –0.353 –0.047 0.076 Communication with neighborhood –0.068 –0.016 0.689
Hobby-related activities 0.067 –0.042 0.611
Frequency of going out –0.041 0.401 0.286
Accumulated attribution rate (%) 25.4 33.4 39.1
same respective order and if no answer was given, re-spondents received a score of zero. We measured life satisfaction by inquiring: “Are you satisfied in your cur-rent daily life?” The respondents answered from: not satisfied, may or may not be satisfied and satisfied, and respondents scored from 1 to 3 in this order with a score of zero being assigned in the case of no answer.
which the subjects were diagnosed among the four dis-eases. We categorized the number of comorbidities into the physical factor in accordance with our previous study [18] despite the poor fit according to the results of our factor analysis (Table 1).
Factor 3 was termed a “social health-related factor” and included the observed variables of communication with neighborhood, hobby-related activities and frequ- ency of going out. Communication with the neighborhood was assessed by the following question: “How often do you communicate with your friends or neighborhood?” The choices were: seldom, once per month, 3 to 4 times a week and almost everyday. The scores ranged from 1 to 4 in the same respective order and zero if the answer was not known. Hobby-related activities were determined by inquiring “Do you participate in hobby-related activi-ties?” with a binary answer format: yes or no. One point was given to individuals with no hobbies, two points for individuals with hobbies, and zero points for subjects providing no answer. The frequency of going out was measured by the question “How often do you go outside, including around your neighborhood?” The following answers were given: less than once per month; more than once per month; more than 3 to 4 times a week. Scores obtained ranged from 1 to 3 in the same respective order. When the answer was not known, subjects received a score of zero.
We obtained the subjects’ socio-demographic informa-tion including age, gender, educainforma-tional attainment and annual income. Educational levels were categorized into four groups: graduation from junior high school, gradua-tion from high school, those achieving a higher educa-tional level than college and those who did not want to respond. Annual income in 2001 was assessed according to four categories: less than one million Japanese yen (equivalent to less than US $13,000), less than three mil-lion yen, less than seven milmil-lion yen and more than seven million yen. We also examined the subjects’ degree of required long-term care in 2001. The degree was meas-ured using a public assessment tool devised by the Japa-nese Ministry of Health, Labor and Welfare [19]. The tool categorizes elderly health conditions into six levels ranging from the mildest degree (requiring slight support) to the most severe degree (requiring comprehensive care).
2.3. Statistical Analyses
The subjects aged 85 years and older and requiring more than the middle degree of long-term care in the 2001 survey were excluded from the analysis due to a large deviation in their individual measurement variables. In the analyses, we divided all data into two groups across both genders: an early-elderly age group aged between 65 and 74 years (termed an early-elderly group), and a late-elderly age group aged between 75 and 84
years (termed a late-elderly group).
A structural equation modeling (SEM) method was used to analyze the underlying chronological relation-ships between the three health-related latent factors by Amos ver.19 for Windows (IBM Inc.). In order to analyze causal relationships, we introduced a cross-lagged effect model as well as a synchronous model [20]. If an earlier level of a predictor variable is associated with a later vari- able, we have evidence to infer that the predictor variable exerts a causal influence on the criterion. Therefore, we hypothesized that each of the health-related factors mea- sured in the 2001 survey may have an effect on the iden-tical corresponding health-related factor measured in the 2004 survey. In the cross-lagged effects model, each factor in the 2001 survey may have an effect on a factor in the 2004 survey other than a corresponding factor (for ex-ample, a physical factor in 2001 may have an effect on a social and/or mental factor in 2004 as well as a physical factor in 2004) (Figure 1). In the synchronous effect model, each factor in 2004 may have an effect on the other two factors in 2004 (e.g., a physical factor in 2001 may not affect a social or mental factor in 2004 but a phy- sical factor in 2004 may affect a social and/or mental factor in 2004) (Figure2).
Estimation of the best-fitting model was performed by a maximum likelihood method using the SEM. The op-timization algorithm was implemented with missing data. Standardized effects among different latent factors were calculated by gender and age group. Goodness-of-fit of the models was assessed by Chi-square, Normed Fit In-dex (NFI), Comparative Fit InIn-dex (CFI) and Root Mean Square Error of Approximation (RMSEA). Values of RMSEA less than 0.05 imply a goodness-of-fit, while in the other indices values greater than 0.80 represent a good fit. Results were regarded as statistically significant if the p value was less than 0.05.
2.4. Ethical Approval
All subjects provided written informed consent by mail via the returned questionnaire. We agreed with the mu-nicipal administration bureau of the study site on the confidentiality of the subjects’ personal data. The present study protocol was also approved by the ethical commit-tee of Tokyo Metropolitan University.
3. RESULTS
CMIN =5726.123 NFI = .822 CFI = .834 RMSEA = .038
Figure 1. Cross-lagged effects model of the early-elderly male group.
CMIN=5547.610 NFI= .827 CFI= .840 RMSEA= .037
[image:4.595.113.485.422.716.2]Table 2. Socio-demographics of the subjects by gender and age group.
Male Female early-elderly
group
late-elderly group
early-elderly group
late-elderly group n = 2841 n = 830 n = 2867 n = 1145 Variable
n % n % n % n % Years of age*
68.7 ± 2.8 78.2 ± 2.7 68.8 ± 2.8 78.2 ± 2.6 No care 2835 99.8 826 99.5 2861 99.8 1124 98.2 Degree of long-term
care in 2001 The mildest care level 6 0.2 4 0.5 6 0.2 21 1.8 Graduated from junior high school 504 17.7 359 43.3 1067 37.2 809 70.7 Graduated from high school 971 34.2 178 21.4 1396 48.7 176 15.4 Graduated from collage 1217 42.8 225 27.1 199 6.9 29 2.5 Educational
attainment
Not known 149 5.2 68 8.2 205 7.2 131 11.4 <1 million 49 1.7 25 3.0 215 7.5 162 14.1 1 million - 3 million 856 30.1 266 32.0 1044 36.4 487 42.5 3 million - 7 million 1382 48.6 413 49.8 1053 36.7 224 19.6 >7 million 336 11.8 52 6.3 179 6.2 34 3.0 Annual income
(Japanese yen)
Not known 218 7.7 74 8.9 376 13.1 238 20.8
*Mean ± Standard Deviation.
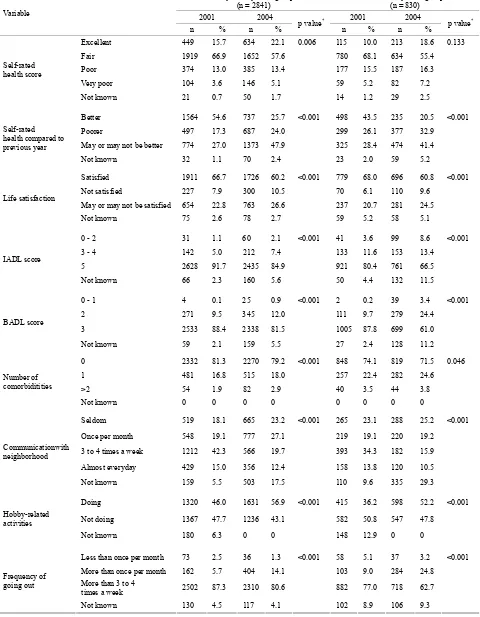
Tables3 and 4 show the distributions of subject variables in 2001 and 2004 for males and females, respectively. To compare each of variables between 2001 and 2004, the paried-Wilcoxon signed rank test was conducted among an early-elderly and a late-elderly age group in both gender, respectively. Perceived health self-ratings of “fair” decreased from 2001 to 2004, with all other ratings in-creasing for both genders. It is especially of note that both genders increased their health rating of “excellent” from 2001 to 2004 in both age groups. However, there was no statistically significant difference between 2001 and 2004 in the late-elderly age groups of both genders. Compared to the previous year, perceived health self- ratings of being “better” decreased and of being “poorer” increased from 2001 to 2004 in both genders. In particu- lar, the proportion of being “better” among both male age groups decreased from 2001 to 2004 more so than in females. Life satisfaction dropped during the survey pe-riod among all groups. IADL and BADL (representing physical factors) likely shifted from higher active levels to lower levels between 2001 and 2004 in both gender groups. The number of comorbidities was higher in the late-elderly age group versus the early-elderly group in both genders. Compared to females, males were more likely to have less communication with their neighborhood. More than half of the male subjects reported limited commu-nication with their neighbors. Both genders displayed an increase in participating in hobby-related activities dur-ing the survey period, but these cannot be directly com-pared due to the fact that the 2004 survey did not include a choice of responding “I do not know”. The incidence of going out more than 3 to 4 times a week dropped from 2001 to 2004 among all age and gender groups.
From the results of SEM analyses, Figures 1 and 2
represent the final example models of the cross-lagged effect for the early-elderly male group and the synchro-nous effect for the late-elderly female group, respectively. The cross-lagged effect models for all gender and age groups indicated significant correlations between corres- ponding factors at the 2001 and 2004 survey (data not shown). The synchronous effect model also demonstrated that the three health-related factors in the 2001 survey significantly predicted the identical corresponding latent factors in the 2004 survey with high standard effect co- efficients between these time points (data not shown).
Table 3. Variables for male subjects in 2001 and 2004 by age group.
Early-elderly male group (n = 2841)
Late-elderly male group (n = 830)
2001 2004 2001 2004
Variable
n % n % p value
*
n % n % p value
*
Excellent 534 18.8 757 26.6 0.008 130 15.7 196 23.6 0.874 Fair 1921 67.6 1604 56.5 557 67.1 421 50.7
Poor 286 10.1 296 10.4 103 12.4 131 15.8 Very poor 84 3.0 140 4.9 32 3.9 53 6.4
Self-rated health score
Not known 16 0.6 44 1.5 8 1.0 29 3.5
Better 1859 65.4 737 25.9 <0.001 454 54.7 189 22.8 <0.001 Poorer 328 11.5 488 17.2 135 16.3 223 26.9 May or may not be better 633 22.3 1538 54.1 226 27.2 378 45.5
Self-rated health compared to previous year
Not known 21 0.7 78 2.7 15 1.8 40 4.8
Satisfied 1925 67.8 1683 59.2 <0.001 583 70.2 481 58.0 <0.001 Not satisfied 252 8.9 315 11.1 69 8.3 93 11.2
May or may not be satisfied 590 20.8 759 26.7 152 18.3 214 25.8 Life satisfaction
Not known 74 2.6 84 3.0 26 3.1 42 5.1
0 - 2 50 1.8 76 2.7 <0.001 26 3.1 61 7.3 <0.001 3 - 4 311 10.9 355 12.5 136 16.4 144 17.3
5 2437 85.8 2264 79.7 628 75.7 540 65.1 IADL score
Not known 43 1.5 146 5.1 40 4.8 85 10.2
0 - 1 2 0.1 27 1.0 0.006 3 0.4 28 3.4 <0.001 2 191 6.7 184 6.5 41 4.9 131 15.8
3 2584 91.0 2525 88.9 761 91.7 614 74.0 BADL score
Not known 64 2.3 105 3.7 25 3.0 62 7.5
0 2072 72.9 1918 67.5 <0.001 566 68.2 528 63.6 <0.001 1 659 23.2 758 26.7 232 28.0 256 30.8 >2 2523 3.9 164 5.8 32 3.9 46 5.5 Number of
comorbiditities
Not known 0 0 1 0.0 0 0 0 0
Seldom 855 30.1 1016 35.8 <0.001 263 31.7 279 33.6 <0.001
Once per month 709 25.0 655 23.1 176 21.2 149 18.0
3 to 4 times a week 803 28.3 366 12.9 259 31.2 90 10.8
Almost everyday 375 13.2 345 12.1 92 11.1 91 11.0 Communicationwith
neighborhood
Not known 99 3.5 459 16.2 40 4.8 221 26.6
Doing 1361 47.9 1690 59.5 <0.001 357 43.0 479 57.7 <0.001
Not doing 1380 48.6 1151 40.5 425 51.2 351 42.3 Hobby-related
activities
Not known 100 3.5 0 0 48 5.8 0 0
Less than once per month 82 2.9 23 0.8 0.012 23 2.8 21 2.5 <0.001 More than once per month 159 5.6 330 11.6 61 7.3 156 18.8
More than 3 to 4
times a week 2523 88.8 2377 83.7 715 86.1 592 71.3 Frequency of
going out
Not known 77 2.7 111 3.9 31 3.7 61 7.3
Table 4. Variables for female subjects in 2001 and 2004 by age group.
Early-elderly male group (n = 2841)
Late-elderly male group (n = 830)
2001 2004 2001 2004
Variable
n % n % p value
*
n % n % p value
*
Excellent 449 15.7 634 22.1 0.006 115 10.0 213 18.6 0.133 Fair 1919 66.9 1652 57.6 780 68.1 634 55.4
Poor 374 13.0 385 13.4 177 15.5 187 16.3 Very poor 104 3.6 146 5.1 59 5.2 82 7.2
Self-rated health score
Not known 21 0.7 50 1.7 14 1.2 29 2.5
Better 1564 54.6 737 25.7 <0.001 498 43.5 235 20.5 <0.001 Poorer 497 17.3 687 24.0 299 26.1 377 32.9 May or may not be better 774 27.0 1373 47.9 325 28.4 474 41.4
Self-rated health compared to previous year
Not known 32 1.1 70 2.4 23 2.0 59 5.2
Satisfied 1911 66.7 1726 60.2 <0.001 779 68.0 696 60.8 <0.001 Not satisfied 227 7.9 300 10.5 70 6.1 110 9.6
May or may not be satisfied 654 22.8 763 26.6 237 20.7 281 24.5 Life satisfaction
Not known 75 2.6 78 2.7 59 5.2 58 5.1
0 - 2 31 1.1 60 2.1 <0.001 41 3.6 99 8.6 <0.001 3 - 4 142 5.0 212 7.4 133 11.6 153 13.4
5 2628 91.7 2435 84.9 921 80.4 761 66.5 IADL score
Not known 66 2.3 160 5.6 50 4.4 132 11.5
0 - 1 4 0.1 25 0.9 <0.001 2 0.2 39 3.4 <0.001 2 271 9.5 345 12.0 111 9.7 279 24.4
3 2533 88.4 2338 81.5 1005 87.8 699 61.0 BADL score
Not known 59 2.1 159 5.5 27 2.4 128 11.2
0 2332 81.3 2270 79.2 <0.001 848 74.1 819 71.5 0.046 1 481 16.8 515 18.0 257 22.4 282 24.6 >2 54 1.9 82 2.9 40 3.5 44 3.8 Number of
comorbiditities
Not known 0 0 0 0 0 0 0 0
Seldom 519 18.1 665 23.2 <0.001 265 23.1 288 25.2 <0.001
Once per month 548 19.1 777 27.1 219 19.1 220 19.2
3 to 4 times a week 1212 42.3 566 19.7 393 34.3 182 15.9
Almost everyday 429 15.0 356 12.4 158 13.8 120 10.5 Communicationwith
neighborhood
Not known 159 5.5 503 17.5 110 9.6 335 29.3
Doing 1320 46.0 1631 56.9 <0.001 415 36.2 598 52.2 <0.001
Not doing 1367 47.7 1236 43.1 582 50.8 547 47.8 Hobby-related
activities
Not known 180 6.3 0 0 148 12.9 0 0
Less than once per month 73 2.5 36 1.3 <0.001 58 5.1 37 3.2 <0.001 More than once per month 162 5.7 404 14.1 103 9.0 284 24.8
More than 3 to 4
times a week 2502 87.3 2310 80.6 882 77.0 718 62.7 Frequency of
going out
Not known 130 4.5 117 4.1 102 8.9 106 9.3
Table 5. Causal relationships between significant factors in the cross-lagged effects model.
gender age group 2001 2004 β* p value
Physical → Mental 0.338 0.015 early-elderly
Physical → Social 0.592 0.015 Physical → Mental 0.346 <0.001 Male
late-elderly
Physical → Social 0.696 <0.001 early-elderly ― → ― ― ―
Physical → Mental 0.372 0.026 Female
late-elderly
Physical → Social 0.450 0.025
*Standard effect coefficients over 0.3 are shown.
Table 6. Causal relationships between significant factors in the synchronous effects model.
gender age group 2004 2004 β* p value
early-elderly Physical → Social 0.350 <0.001 Physical → Social 0.748 <0.001 Male
late-elderly
Social → Physical 0.312 <0.001 early-elderly Physical → Social 0.409 <0.001 Physical → Social 0.402 <0.001 Female
late-elderly
Mental → Physical 0.313 <0.001
*Standard effect coefficients over 0.3 are shown.
4. DISCUSSION
The present study revealed that three-year-prior health related factors such as physical, mental and social health significantly predicted current corresponding health-related factors. In particular, as shown in the cross-lagged model as well as the synchronous model, the three-year prior and current physical health considerably affected subjects’ social health across both genders. Such findings were likely stronger in elderly male individuals compared to females. The three-year prior and current physical health also possibly influenced the mental health factor. However, mutually causal relationships between social and mental factors may be minor, and these factors had little effect on the physical factor among the elderly participants in this study. In other words, the findings may indicate that the elderly are able to remain in an overall healthy state primarily based on their physical condition alone, which confers a high activity competence in daily life with a paucity of disease, or it may indicate that they maintain a heightened psychological well being and active connec-tions with society on the basis of being in good physical condition. In this regard, our results were not surprising. It is granted that those whose physical condition is poor may be limited in any social interactions and may be prone to suffer from mental disorders. However, it is meaningful that our study verified the chronological re-lationship between the three health-related factors using a large sample size and longitudinal data. It is also inter-esting that there were only minor relationships between
mental and social factors.
Previous studies revealed significant associations of physical health with mental and social health-related conditions among the elderly [21-25]. For example, Rat-ner et al. [26] indicated that physical health alone ac-counted for 55.1% of the variance in self-rated health status and that psychological and social determinants did not have a significant impact on self-rated health. How-ever, it is difficult to compare our study with these re-ports since different definitions and diverse indices of the three health-related factors were used. Moreover, the results between studies could be inconsistent due to the use of different categories related to subject ages [27], gender disparities [28] and racial differences [29]. Our study included only Japanese subjects and analyzed data divided by both gender and by commonly used age groupings, including an early- and a late-elderly group in order to account for such factors.
The strength of our study was the inclusion of a large sample size from the cohort survey tracked over six years, and the collection of data with a high response rate (80.2% in the 2001 survey, 64.9% in the 2004 survey), implying highly desirable coverage in such a population-based research study.
[image:8.595.57.286.112.218.2] [image:8.595.57.287.270.359.2]factors may not represent an exhaustive list of factors impacting health as defined by the WHO. In particular, it is necessary to further speculate on which social and mental determinants of health are important. The study also has a fundamental limitation in terms of a restriction to self-assessed measurements to examine the three health- related factors [32].
In conclusion, our study suggests that the maintenance of physical health may be particularly crucial in impact-ing the mental and social health of elderly populations, both male and female. Further research is needed in-cluding the study of other, more wide-ranging measure-ment variables representing the three related aspects of health.
5. ACKNOWLEDGEMENTS
We express a special gratitude to all the participants of Tama city. The study was funded by the grant of Japanese Ministry of Health, Labor and Welfare (H10-Health-042), and the Grant-in-Aid for Scien-tific Research (B) from Japanese Ministry of Education, Culture, Sports, Science and Technology (No. 1531012 & 14350327). We also thank for the financial support from the Mitsubishi Foundation (2009-21).
REFERENCES
[1] Dolfman, M.L. (1973) The concept of health: An historic
and analytic examination. Journal of School Health, 43,
491-497. doi:10.1111/j.1746-1561.1973.tb03740.x
[2] Breslow, L. (1972) A quantitative approach to the World
Health Organization definition of health: Physical, mental
and social well-being. International Journal of
Epidemi-ology, 1, 347-355. doi:10.1093/ije/1.4.347
[3] Saracci, R. (1997) The World Health Organisation needs
to reconsider its definition of health. British Medical
Journal (BMJ), 314, 1409-1410. doi:10.1136/bmj.314.7091.1409
[4] Bircher, J. (2005) Towards a dynamic definition of health
and disease. Medicine, Healthcare & Philosophy, 8, 335- 341. doi:10.1007/s11019-005-0538-y
[5] Liu, X., Liang, J., Muramatsu, N. and Sugisawa, H. (1995)
Transitions in functional status and active life expectancy
among older people in Japan. The Journals of
Gerontol-ogy: Series B, 50, S383-394. doi:10.1093/geronb/50B.6.S383
[6] Stessman, J., Hammerman-Rozenberg, R., Cohen, A., Ein-
Mor, E. and Jacobs, J.M. (2009) Physical activity,
func-tion, and longevity among the very old. Archives of
In-ternal Medicine, 169, 1476-1483. doi:10.1001/archinternmed.2009.248
[7] Yates, L.B., Djousse, L., Kurth, T., Buring, J.E. and
Ga-ziano, J.M. (2008) Exceptional longevity in men: Modi-fiable factors associated with survival and function to age 90 years. Archives of Internal Medicine, 168, 284-290. doi:10.1001/archinternmed.2007.77
[8] Kaplan, G.A., Goldberg, D.E., Everson, S.A., Cohen,
R.D., Salonen, R., Tuomilehto, J. and Salonen, J. (1996) Perceived health status and morbidity and mortality: Evi-dence from the Kuopio ischaemic heart disease risk factor
study. International Journal of Epidemiology, 25, 259-
265. doi:10.1093/ije/25.2.259
[9] Spiers, N., Jagger, C., Clarke, M. and Arthur, A. (2003)
Are gender differences in the relationship between self- rated health and mortality enduring? Results from three birth cohorts in Melton Mowbray, United Kingdom. Gerontologist, 43, 406-411. doi:10.1093/geront/43.3.406
[10] Ichida, Y., Kondo, K., Hirai, H., Hanibuchi, T.,
Yoshi-kawa, G. and Murata, C. (2009) Social capital, income inequality and self-rated health in Chita peninsula, Japan: A multilevel analysis of older people in 25 communities. Social Science & Medicine, 69, 489-499.
doi:10.1016/j.socscimed.2009.05.006
[11] Sugisawa, H., Liang, J. and Liu, X. (1994) Social
net-works, social support, and mortality among older people in Japan. Journals of Gerontology, 49, S3-13.
[12] Blazer, D.G. and Houpt, J.L. (1979) Perception of poor
health in the healthy older adult. Journal of the American
Geriatrics Society, 27, 330-334.
[13] Perruccio, A.V., Badley, E.M., Hogg-Johnson, S. and
Davis, A.M. (2010) Characterizing self-rated health dur-ing a period of changdur-ing health status. Social Science & Medicine, 71, 1636-1643.
doi:10.1016/j.socscimed.2010.07.042
[14] Koyano, W., Shibata, H., Nakazato, K., Haga, H. and
Suyama, Y. (1991) Measurement of competence: Reli-ability and validity of the TMIG Index of Competence. Archives of Gerontology and Geriatrics, 13, 103-116. doi:10.1016/0167-4943(91)90053-S
[15] Branch, L.G., Katz, S., Kniepmann, K. and Papsidero, J.A.
(1984) A prospective study of functional status among
community elders. American Journal of Public Health,
74, 266-268. doi:10.2105/AJPH.74.3.266
[16] Katz, S., Ford, A.B., Moskowitz, R.W., Jackson, B.A. and
Jaffe, M.W. (1963) Studies of illness in the aged. The in-dex of ADL: A standardized measure of biological and
psychological function. Journal of the American Medical
Association (JAMA), 185, 914-919. doi:10.1001/jama.1963.03060120024016
[17] Hoshi, T., Ryu, S. and Fujiwara, Y. (2007) Urban health
and determinant factors for longer life for the elderly
ur-ban dwellers in Tokyo. Proceedings of the International
Symposium on Sustainable Urban Environment, 1, 61-66.
[18] Hoshi, T., Takagi, C., Bosako, Y., Nakayama, N., Yan, S.,
Kurimori, S., Hasegawa, T., Inoue, N., Yamamoto, C. and Takahashi, T. (2011) Chronological evaluation of physical, psychological and social health of urban elderly dwellers over 6 years and assessment of causal inter-relationships. Nihon Koshu Eisei Zasshi, 58, 491-500.
[19] Tsutsui, T. and Muramatsu, N. (2007) Japan’s universal
long-term care system reform of 2005: Containing costs
and realizing a vision. Journal of the American Geriatrics
Society, 55, 1458-1463.
doi:10.1111/j.1532-5415.2007.01281.x
SAGE Publications, Inc., Thousand Oaks.
[21] Asakawa, T., Koyano, W., Ando, T. and Shibata, H. (2000)
Effects of functional decline on quality of life among the
Japanese elderly. International Journal of Aging and
Human Development, 50, 319-328. doi:10.2190/3TR1-4V6R-MA5M-U1BV
[22] Dorgo, S., Robinson, K.M. and Bader, J. (2009) The
ef-fectiveness of a peer-mentored older adult fitness pro-gram on perceived physical, mental, and social function. Journal of the American Academy of Nurse Practitioners, 21, 116-122. doi:10.1111/j.1745-7599.2008.00393.x
[23] Dungan, J.M., Brown, A.V. and Ramsey, M.A. (1996)
Health maintenance for the independent frail older adult:
Can it improve physical and mental well-being? Journal
of Advanced Nursing, 23, 1185-1193. doi:10.1046/j.1365-2648.1996.12016.x
[24] Fox, K.R., Stathi, A., McKenna, J. and Davis, M.G. (2007)
Physical activity and mental well-being in older people
participating in the Better Ageing Project. European Jour-
nal of Applied Physiology, 100, 591-602. doi:10.1007/s00421-007-0392-0
[25] Jang, Y., Bergman, E., Schonfeld, L. and Molinari, V.
(2007) The mediating role of health perceptions in the re-lation between physical and mental health: A study of older residents in assisted living facilities. Journal of Ag-ing Health, 19, 439-452.
doi:10.1177/0898264307300969
[26] Ratner, P.A., Johnson, J.L. and Jeffery, B. (1998)
Exam-ining emotional, physical, social, and spiritual health as
determinants of self-rated health status. American Journal
of Health Promotion, 12, 275-282. doi:10.4278/0890-1171-12.4.275
[27] Stafford, M., McMunn, A., Zaninotto, P. and Nazroo, J.
(2011) Positive and negative exchanges in social rela-tionships as predictors of depression: Evidence from the
English longitudinal study of aging. Journal of Aging
Health, 23, 607-628.
doi:10.1177/0898264310392992
[28] De Souto Barreto, P., Ferrandez, A.M. and Guihard-Costa,
A.M. (2011) Predictors of body satisfaction: Differences between older men and women’s perceptions of their
body functioning and appearance. Journal of Aging
Health, 23, 505-528. doi:10.1177/0898264310386370
[29] Boyington, J.E., Howard, D.L. and Holmes, D.N. (2008)
Self-rated health, activities of daily living, and mobility limitations among black and white stroke survivors. Journal of Aging Health, 20, 920-939.
doi:10.1177/0898264308324643
[30] Neri, A.L., Yassuda, M.S., Fortes-Burgos, A.C.,
Man-tovani, E.P., Arbex, F.S., de Souza Torres, S.V., Perracini, M.R. and Guariento, M.E. (2012) Relationships between gender, age, family conditions, physical and mental health,
and social isolation of elderly caregivers. International
Psychogeriatric, 24, 472-483.
[31] Van Heuvelen, M.J., Hochstenbach, J.B., Brouwer, W.H.,
de Greef, M.H., Zijlstra, G.A., van Jaarsveld, E., Kempen, G.I., van Sonderen, E., Ormel, J. and Mulder, T. (2005) Differences between participants and non-participants in an RCT on physical activity and psychological
interven-tions for older persons. Aging Clinical and Experimental
Research, 17, 236-245.
[32] Smith, K.V. and Goldman, N. (2011) Measuring health
status: Self-, interviewer, and physician reports of overall health. Journal of Aging Health, 23, 242-266.