STUDY OF THE ISOTOPIC COMPOSITION OF MERCURY: EXPERIMENTAL APPROACH
*1, 3
Sambou, A.,
2Gomis, L.,
1Talla, KH.,
1
Universite Cheikh Anta Diop de Dakar, Laboratoire de Photonique et de Nano
et Techniques, B.P. 5005 Dakar
2
Universite Cheikh Anta Diop de Dakar, Laboratoire de Physique des Plasmas et de Recherches
Interdisciplinaires, Département de Physique, BP 5005 Dakar
3
Universite de Pau et des Pays de l'Adour, Laboratoire de Chimie Analytique Bio
(LCABIE-UMR 5034) IPREM, 64053, Pau Cedex 9, France
ARTICLE INFO ABSTRACT
The main objective of this work was to study experimentally the isotopic in derivatization processes i.e. Ethylation and Propylation. The multi plasma mass spectrometry (MC
of mercury stable elements effi
systems. This device made it possible to study the evolution of mass independent fractionation (MIF) and mass dependent fractionation (MDF) under different conditions. According to our results, MIF or the so
study conducted from the samples, reveals the presence of a maximum anomaly for hydrochloric acid (HCl) 3% in concentration equal to +1.2 ‰ for Δ
equal to
aqueous phase methylations and propylation were tested on the sample. The different methods of derivatization are co
Copyright©2019, Sambou et al. This is an open access distribution, and reproduction in any medium, provided
INTRODUCTION
For several years, mercury has been the subject of numerous studies by scientific researchers. Mercury is the only liquid metallic element under normal conditions of temperature and pressure. Mercury is a chemical element with symbol Hg and atomic number 80 and electronic configuration is [Xe] 4f145d106s2. Mercury element is composed of seven stable isotopes 196Hg (0.16%), 198Hg (10.00%), 199Hg (16.9%), (23.1%), 201Hg (13.2%), 202Hg (29.7%) and
element mercury has many stable isotopes ranging from mass 196 to 204; however, only the two with odd mass number are known to have a nonzero nuclear magnetic moment associated with a nuclear spin: mass 199 and 201. 200Hg and
neither nuclear spin nor magnetic moment. The isotopes, and 201Hg, have nuclear spins respectively 1/2 and 3/2 and strong magnetic moments of the order of +0.5029μβ and 0.5602μβ respectively (Buchachenko et al., 2004).
of the chemical behavior of mercury is important because it is extremely polluting and toxic, leading to serious effects on the health of populations.
*Corresponding author:1,3Sambou, A.,
ISSN: 0975-833X
Article History:
Received 26th January, 2019 Received in revised form 23rd February, 2019 Accepted 17th March, 2019 Published online 29th April, 2019
Citation: Sambou, A., Gomis, L., Talla, KH., Ngom, B. D., Diallo, S., Beye, A. C. and
experimental approach”, International Journal of Current Research
Key Words: Socio-demographic variable, BMI, Overweight, Obesity, Childhood.
RESEARCH ARTICLE
STUDY OF THE ISOTOPIC COMPOSITION OF MERCURY: EXPERIMENTAL APPROACH
Talla, KH.,
1Ngom, B. D.,
2Diallo, S.,
1Beye, A. C. and
Universite Cheikh Anta Diop de Dakar, Laboratoire de Photonique et de Nano-Fabrication,
et Techniques, B.P. 5005 Dakar-Fann Dakar, Sénégal
Universite Cheikh Anta Diop de Dakar, Laboratoire de Physique des Plasmas et de Recherches
Interdisciplinaires, Département de Physique, BP 5005 Dakar-Fann, Dakar, Sénégal
de Pau et des Pays de l'Adour, Laboratoire de Chimie Analytique Bio-Inorganique et Environnement
UMR 5034) IPREM, 64053, Pau Cedex 9, France
ABSTRACT
The main objective of this work was to study experimentally the isotopic in derivatization processes i.e. Ethylation and Propylation. The multi
plasma mass spectrometry (MC-ICPMS) technique makes it possible to measure isotopic signatures of mercury stable elements efficiently in extremely compact i.e. 1ppb and 10ppb concentration systems. This device made it possible to study the evolution of mass independent fractionation (MIF) and mass dependent fractionation (MDF) under different conditions. According to our results, MIF or the so-called anomalies are observed only for the odd isotopic mercury (
study conducted from the samples, reveals the presence of a maximum anomaly for hydrochloric acid
(HCl) 3% in concentration equal to +1.2 ‰ for Δ201Hg, but also the presence of a negative anomaly,
equal to -0.43 ‰ for Δ201Hg at 10% concentration of HCl. As derivatization procedure, direct
aqueous phase methylations and propylation were tested on the sample. The different methods of derivatization are compared.
access article distributed under the Creative Commons Attribution License, the original work is properly cited.
For several years, mercury has been the subject of numerous studies by scientific researchers. Mercury is the only liquid metallic element under normal conditions of temperature and a chemical element with symbol Hg and atomic number 80 and electronic configuration is [Xe] . Mercury element is composed of seven stable Hg (16.9%), 200Hg Hg (29.7%) and 204Hg (6.8%).The element mercury has many stable isotopes ranging from mass 196 to 204; however, only the two with odd mass number are known to have a nonzero nuclear magnetic moment associated Hg and 202Hg, have her nuclear spin nor magnetic moment. The isotopes, 199Hg Hg, have nuclear spins respectively 1/2 and 3/2 and strong magnetic moments of the order of +0.5029μβ and
-., 2004). Knowledge of mercury is important because it is extremely polluting and toxic, leading to serious effects on the
It has long been used industrially in the extraction of precious metals and its use persists in artisanal operations, particularly in the Amazon (Carmouze et al
many organic syntheses. Mercury is also used in many fields, such as medicine, or it is used as an ointment against skin diseases such as gall. It is also found in cosmetics and some instruments such as the thermometer and batteries. However, these applications undergo controls due to the toxicity of various mercury species. Mercury exists in three oxidation states (0), (I+) and (II+). The forms Hg
present in several environmental compartments, complexed with anions such as chlorides, sulphides, hydroxides, bromides, iodides, etc. Under certain conditions, the CH (monomethylmercury) cation, dimethylmercury, may form and complex with these bases to form monomethylmercury salts such as CH3HgCl, CH3HgS, CH
elementary molecular species is now proven. The molecular
form that currently raises the most questions is
monomethylmercury (MeHg), which could be the main species involved in the biogeochemical and neurotoxic cycle and is present in biotic compartments and in aquatic systems where it is bioaccumulated: in this case, we speak of a pr
biomagnification, a phenomenon which is not without consequences on the food chain in which man is involved International Journal of Current Research
Vol. 11, Issue, 04, pp.2733-2740, April, 2019 DOI: https://doi.org/10.24941/ijcr.34878.04.2019
Sambou, A., Gomis, L., Talla, KH., Ngom, B. D., Diallo, S., Beye, A. C. and Epov, V. 2019. “Study of the isotopic composition of mercury: International Journal of Current Research, 11, (04), 2733-2740.
STUDY OF THE ISOTOPIC COMPOSITION OF MERCURY: EXPERIMENTAL APPROACH
, A. C. and
3Epov, V.
Fabrication, Faculté des sciences
Universite Cheikh Anta Diop de Dakar, Laboratoire de Physique des Plasmas et de Recherches
Fann, Dakar, Sénégal
Inorganique et Environnement
UMR 5034) IPREM, 64053, Pau Cedex 9, France
The main objective of this work was to study experimentally the isotopic fractionation of mercury Hg, in derivatization processes i.e. Ethylation and Propylation. The multi-collector inductively coupled ICPMS) technique makes it possible to measure isotopic signatures ciently in extremely compact i.e. 1ppb and 10ppb concentration systems. This device made it possible to study the evolution of mass independent fractionation (MIF) and mass dependent fractionation (MDF) under different conditions. According to our results, the
called anomalies are observed only for the odd isotopic mercury (199Hg and 201Hg). The
study conducted from the samples, reveals the presence of a maximum anomaly for hydrochloric acid , but also the presence of a negative anomaly, Hg at 10% concentration of HCl. As derivatization procedure, direct aqueous phase methylations and propylation were tested on the sample. The different methods of
License, which permits unrestricted use,
It has long been used industrially in the extraction of precious ersists in artisanal operations, particularly
et al., 2000). It is also a catalyst for many organic syntheses. Mercury is also used in many fields, such as medicine, or it is used as an ointment against skin t is also found in cosmetics and some instruments such as the thermometer and batteries. However, these applications undergo controls due to the toxicity of various mercury species. Mercury exists in three oxidation states (0), (I+) and (II+). The forms Hg (I) and Hg (II) are present in several environmental compartments, complexed with anions such as chlorides, sulphides, hydroxides, bromides, iodides, etc. Under certain conditions, the CH3Hg+
(monomethylmercury) cation, dimethylmercury, may form and complex with these bases to form monomethylmercury salts HgS, CH3HgI, etc. The toxicity of these
elementary molecular species is now proven. The molecular
ises the most questions is
monomethylmercury (MeHg), which could be the main species involved in the biogeochemical and neurotoxic cycle and is present in biotic compartments and in aquatic systems where it is bioaccumulated: in this case, we speak of a process of biomagnification, a phenomenon which is not without consequences on the food chain in which man is involved INTERNATIONAL JOURNAL
OF CURRENT RESEARCH
(Bergquist, 2007). The main source of mercury is undoubtedly linked to human activities such as industrial activities, mining, the combustion of fossil fuels such as coal combustion, releasing a large quantity of inorganic Hg into the atmosphere, or as a gag- Hg(0), either in the form of highly reactive species of (Hg2+, X-) type, naturally transforming into methylmercury (MeHg). For confirmation, pathology was clearly diagnosed in 1956 in the Japanese village of Minamata, later called "Minamata Disease". It results from a massive methylmercury poisoning, caused by the consumption of fish and seafood. These products caught in the bay were found to be contaminated by mercury releases from a nearby plant using this compound for the production of acetaldehyde (Fain and Ferrari, 2003). Bergquist et al, have also shown that populations with high per capita fish consumption are the most at risk, but this risk also applies to areas where environmental pollution has increased significantly in recent decades. However, the risks of ingestion of the MeHg form also exist even though per capita fish consumption and average levels of mercury in fish are relatively low. A follow-up of mercury speciation is therefore necessary, particularly with the help of experimental studies on the electronic and nuclear properties of the various mercury isotopes. In our study, the choice of isotopic fractionation was made.
By definition, isotopic fractionation is the phenomenon that characterizes the isotopic composition of a chemical element as it moves from one physical state, or one chemical composition, to another. In our work, we will mainly study the evolution of isotopic fractionation of mercury in a biogeochemical cycle in the aquatic environment. As isotopic fractionation can also be defined as the phenomenon quantifying the variations of the abundances of each isotope within a specific sample, to a given physicochemical or biological process, this will allow us to better understand and understand the natural process of mercury evolution in nature: for example, studies in lakes Michigan, Mame aiguillat and Dolt and studies at IPREM laboratories reveal the presence of high levels of mercury (Hg) in fish and its risk of exposure to the human population (Bergquist, 2007). Two types of isotopic fractionations are: (i) mass independent fractionation (MIF) and (ii) mass dependent fractionation (MDF).The study of MIF today touches fields of application such as cosmo-chemistry, paleoclimatology, physical chemistry, atmospheric chemistry and bio-geochemistry concerning all types of atoms (Bergquist, 2007).
In particular, the MIF is now well known for the element 'heavy' mercury and in particular on the two odd isotopes 199Hg and 201Hg involved in radical or photochemical reactions on the surface of the water, where we observe photo-reduction of Hg (II) and photodemethylation of monomethylmercury. Although these isotopic abnormalities, Δ199Hg and Δ201Hg, are now commonly accepted, it was not until 2007 that the MIF hypothesis (Bergquist and Blum, 2007), (Biswas et al., 2000), and (Bridget et al., 2009). Concerning the mass dependent fractionation (MDF), the experimental measurements and the theoretical predictions are not yet able to exploit this property, in particular because of notions still not understood concerning the behavior of the nuclear spin of the isotope considered. To determine the composition of a sample, researchers have different spectroscopic methods to access the composition and structure of the material. In the case of the study of mercury isotopes, several mass spectrometry techniques have been used: Inductively Coupled Plasma Source Mass Spectrometry
(ICPMS), Thermo-Ionization Mass Spectrometry (TIMS) and Spectrometry of Secondary Ionization Mass (SIMS). These three techniques constitute a set of analysis techniques that can detect, but also finely identify, either the elements or the molecules (Sabine et al., 2000). Concerning the study of elements that are difficult to ionize, Walder and Furuta (Halliday and Lee, 1995) demonstrated that the ICP-MS technique is the only one that is sufficiently fast and accurate for isotopic analyzes of environmental samples. The most commonly used technique for the study of mercury fractionation is multi-collector inductively coupled plasma-source mass spectrometry, the MC-ICP-MS (Multi Collector) technique. Lee and Hall-Ideal have argued that the MC-ICP-MS has the best accuracy in measuring isotopes. For example they have determined with this device an accuracy of 0.006% of 182W/183W (Sabine et al., 2000). According to (Albaréde
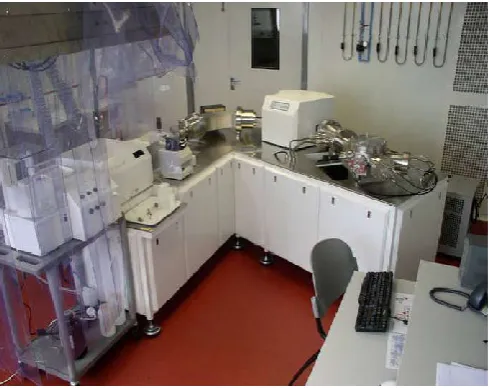
[image:2.595.312.557.490.684.2]et al., 2004), the MC-ICPMS was born about ten years ago. The capabilities of this technique have been demonstrated in studies of many metals, such as iron, zinc, copper or cadmium. This technique is today the most efficient and it allows the analysis of very low levels of concentration: the limit of detection is currently 0.18pg/g (Fain and Ferrari, 2003). MC-ICPMS has the advantage of much simpler sample preparation and shorter measurement time (Sergei et al., 2006). Nevertheless, it is a heavy and very expensive method of use. The accuracy that we are now entitled to achieve using this technique is of the order of 0.002% (Foucher and Hintelmann, 2006). Lauretta et al, were the first researchers to use the MC-ICPMS technique to study mercury isotopes in environmental matrice (Run-Sheng et al., 2010). These technical advances made it possible to analyze the seven stable isotopes of mercury Hg in low concentration samples. As part of our study, the experimental technique used for the analysis of mercury samples is "Nu instruments", "Nu Plasma HR" model, coupled to multi-collector Plasma Inductive Plasma Mass Spectrometry (MC-ICPMS). Cold Steam Generator (CVG) and Desolvation Nebulizer System (DSN-100).
Figure 1. Nu Plasma HR MC-ICPMS (LCABIE)
MATERIAL AND METHODS
Synthesis of materials: Preparation of raw materials is an important step in the experimental stud. Obtaining a good quality samples four steps are necessary.
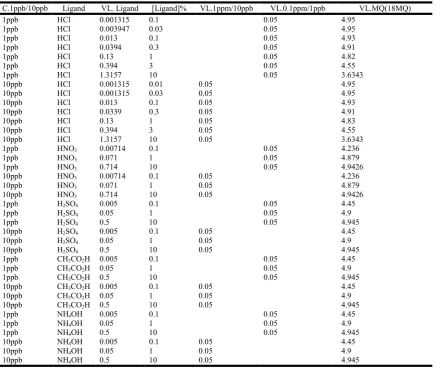
Details of the experimental work are available in table 1. However, the results of this study with the MC-ICPMS method are presented in Table 2 below.
The study of isotopic fractionation during the alkylation reactions for the different solutions described above requires a derivatization protocol. For this, a derivatization of the chemical forms is carried out beforehand, in order to obtain only alkylated forms of mercury, more stable at high temperature and more volatile. This derivatization is generally carried out by ethylation and / or propylation of the compounds, that is to say that the anionic radicals which have substituents (Cl-, OH-...) are replaced by ethyl or propyl groups derived from tetraethylborate sodium NaBEt4 or sodium
tetrapropylborate NaBPr4.
STEP THREE: Derivatization: Derivatization must result in volatile and thermally stable compounds,which must be unique and unambiguously related to the species in the environmental matrix. In this work different derivatization techniques have been compared.
Ethylation: The sodium tetraethylborate NaBEt4, first used by
Rapsomaniki et al in 1986 by the derivatization of organo-lead
species was proposed in 1989 by Bloom as a derivative of MeHg. It has since been preferred to tetraalkylborate and has been widely applied successfully on aqueous samples (Carlier-Pinasseau and al., 1997).
Propylation: The sodium tetrapropylborate NaBPr4, recently
synthesized for the purpose of the derivatization of mercury, proves more effective than sodium tetraethylborate NaBEt4
from the point of view of the derivatization yield. It is estimated that the detection limits are generally less than 1 pg / l, for both mercury and methylmercury (MeHg), when using NaBPr4 (Bravo-Sanchez and al., 2004). A summary of the two
derivatization procedures described is given below.
STEP FOUR: Preparation of samples before analysis: The samples are placed in polystyrene tubes, avoiding losses as much as possible, in which 100 μl and 50 μl of BrCl3solution
are added to each tube of the organic phase and the aqueous phase, respectively for to oxidize all the mercury, the solution is then stirred manually.
STEP ONE: Calibration solution
1ppm Hg: Take a volume of 2 ml of the standard solution of mercury (Hg2+) of 5ppm concentration that is introduced into a bottle. Add 8 ml of Milli-Q water (18 ΩM) to the vial to obtain the desired 10 ml volume and homogenize the solution. 0.1ppm Hg: Take a volume of 0.2 ml of the standard solution of mercury (Hg2+) of concentration 5 ppm that is introduced into a bottle. Add 9.8 ml of Milli-Q water (18 ΩM) to the vial to obtain the 10 ml volume and homogenize the solution. STEP TWO:
Sample preparation
1ppb 0.01%HCl: Take 0.05ml (50μl) of the solution at 0.1ppm mercury Hg and place in a bottle. Add a volume of 0.001315 (1.315μl) of the HCl solution. Add 4.95ml of Milli-Q water (18ΩM) (necessary to reach a final volume of 5ml). Close the bottle and shake the solution well.
[image:3.595.82.524.188.556.2]10ppb 0.01%HCl: Take 0.05 ml (50μl) of the solution of 1 ppm mercury Hg and place in a bottle. Add a volume of 0.001315ml (1.315μl) of the HCl solution. Add 4.95ml of Milli-Q water (18ΩM) (necessary to reach a final volume of 5ml). Close the bottle and shake the solution well.
Table 1. Summary of the preparations of the different experimental solutions
C.1ppb/10ppb Ligand VL. Ligand [Ligand]% VL.1ppm/10ppb VL.0.1ppm/1ppb VL.MQ(18MQ)
1ppb HCl 0.001315 0.1 0.05 4.95
1ppb HCl 0.003947 0.03 0.05 4.95
1ppb HCl 0.013 0.1 0.05 4.93
1ppb HCl 0.0394 0.3 0.05 4.91
1ppb HCl 0.13 1 0.05 4.82
1ppb HCl 0.394 3 0.05 4.55
1ppb HCl 1.3157 10 0.05 3.6343
10ppb HCl 0.001315 0.01 0.05 4.95
10ppb HCl 0.001315 0.03 0.05 4.95
10ppb HCl 0.013 0.1 0.05 4.93
10ppb HCl 0.0339 0.3 0.05 4.91
10ppb HCl 0.13 1 0.05 4.83
10ppb HCl 0.394 3 0.05 4.55
10ppb HCl 1.3157 10 0.05 3.6343
1ppb HNO3 0.00714 0.1 0.05 4.236
1ppb HNO3 0.071 1 0.05 4.879
1ppb HNO3 0.714 10 0.05 4.9426
10ppb HNO3 0.00714 0.1 0.05 4.236
10ppb HNO3 0.071 1 0.05 4.879
10ppb HNO3 0.714 10 0.05 4.9426
1ppb H2SO4 0.005 0.1 0.05 4.45
1ppb H2SO4 0.05 1 0.05 4.9
1ppb H2SO4 0.5 10 0.05 4.945
10ppb H2SO4 0.005 0.1 0.05 4.45
10ppb H2SO4 0.05 1 0.05 4.9
10ppb H2SO4 0.5 10 0.05 4.945
1ppb CH3CO2H 0.005 0.1 0.05 4.45
1ppb CH3CO2H 0.05 1 0.05 4.9
1ppb CH3CO2H 0.5 10 0.05 4.945
10ppb CH3CO2H 0.005 0.1 0.05 4.45
10ppb CH3CO2H 0.05 1 0.05 4.9
10ppb CH3CO2H 0.5 10 0.05 4.945
1ppb NH4OH 0.005 0.1 0.05 4.45
1ppb NH4OH 0.05 1 0.05 4.9
1ppb NH4OH 0.5 10 0.05 4.945
10ppb NH4OH 0.005 0.1 0.05 4.45
10ppb NH4OH 0.05 1 0.05 4.9
After one hour, 50 μl and 25 μl of the hydroxylamine solution (30%) are added respectively into the organic and aqueous phase. This solution plays the role of a pre-reducer to neutralize the excess of BrCl, visible by the disappearance of the yellow color.
RESULTS AND DISCUSSIONS
Calculation of the value of δxxxHg (‰): The delta notation "δ" is used to denote the mass dependent fractionation (MDF). The so-called "standard technical bracketing" method is now commonly used to calculate the δ (‰) fractionation for each isotopic ratio, using the mass of the 198Hg isotope as the reference mass (Blum and Bergquist, 2007). We thus find the evaluation equation of MDF.
(1)
Where xxx represents the mass of mercury isotopes other than element 198. To apply this method, the standard NIST SRM 3133 sample (Mercury standard solution) or UM-Almadèn and the sample should be of the same mercury concentration and placed in the same acid matrix. This will bring the mercury behavior in the standard closer to that of the mercury in the sample, in order to appreciate the accuracy of the analysis.
Calculation of the value of ΔxxxHg (‰): The mass independent fractionation (MIF) represented by the notation "Δ", also called anomaly, is calculated by the difference between the isotopic ratios δxxx/198 measured and calculated theoretically, assuming that it is due solely to a dependent fractionation mass of Hg isotopes (Blum and Bergquist, 2007).Thus equation (2) gives the analytical expression for evaluating the anomaly due to a mass-independent fractionation.
202
xxx xxx xxx
Hg
Hg
Hg
(2)
Where xxx is the mass of Hg isotopes between 199 and 204 amu and β is the fractionation factor depending on the mass of Hg isotopes and is given by equation (3).
(3)
In this equation mx and mz represent the masses of the isotopes x and z respectively. The value of β depends on each isotope. The equations below are used to calculate the value of the mass-independent fractionation (MIF) for the different mercury isotopes. In this case, the ratio 202Hg/198Hg (i.e. δ202Hg) is used to determine the following theoretical values: Δ199, Δ200, Δ201 and Δ202; by applying the kinetic law of mass dependent fractionation (MDF), established by Bigeleine in 1949 and reconsidered, as follows, by Young et al, in 2002 (Sonke, 2011).
For values of δxxxHg(‰) much lower than 10‰, the values of ΔxxxHg(‰) can be approximated by the following equations (Blum and Bergquist, 2007).
In Table 2 below is listed the isotopic composition of Hg (‰) found in our study.
198 198 198
3133
1 1000
xxx xxx xxx
sample NIST SRM
Hg Hg Hg Hg Hg
1
1
197.966752
1
1
197.966752
mx
mz
Derivatization Samples(10ppb&1ppb) Operating mode
Ethylation
10ppb All bottles each contain 2.5 ml in solution. A volume of 1000 μl of iso-actane (IOA) and then 250 μl of sodium tetraethyl borate NaBEt4 at 2% are rapidly added to each vial. The bottles are immediately capped and rigorously shaken by hand for 5 minutes. The organic and aqueous phases are then separated and the organic phase is then recovered in small 2 ml borosilicate glass flasks. The organic extract obtained is left to stand, corks open for about 48 hours. After evaporation, 5 ml of the matrix (10% HNO3, 2% HCl) are added.
1ppb All bottles each contain 5ml in solution. A volume of 1000 μl of isooctane (IOA) and then 400 μl of sodium tetraethyl borate NaBEt4 at 2% are rapidly added to each vial. The bottles are immediately capped and rigorously shaken by hand for 5 minutes. The organic and aqueous phases are then separated and the organic phase is then recovered in small 2 ml borosilicate glass flasks. The organic extract obtained is left to stand, corks open for about 48 hours. After evaporation, 5 ml of the matrix (10% HNO3, 2% HCl) are added.
Hg2+ +2NaBEt
4Et2Hg+2Na+2BEt3
Propylation 10ppb
All bottles each contain 2.5 ml in solution. A volume of 100 μl of isooctane (IOA) and then 250 μl of 2% NaBPr4 sodium tetrapropylborate are rapidly added to each bottle. The bottles are immediately closed and rigorously shaken by hand for 5 minutes. The organic and aqueous phases are then separated and the organic phase is then recovered in small 2 ml borosilicate glass flasks. The organic extract obtained is left to stand, corks open for about 48 hours. After evaporation, 5 ml of the matrix (10% HNO3, 2% HCl) are added.
Hg2+ + 2NaBPr
4Pr2Hg+2Na+ + 2BPr3
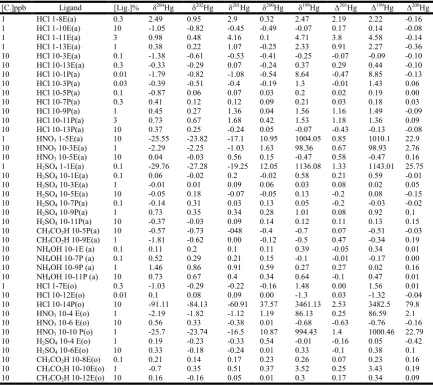
Table 2. Isotopic composition of Hg (‰)
[C.]ppb Ligand [Lig.]% δ204Hg δ202Hg δ201Hg δ200Hg δ199Hg Δ201Hg Δ199Hg Δ200Hg
1 HCl 1-8E(a) 0.3 2.49 0.95 2.9 0.32 2.47 2.19 2.22 -0.16
1 HCl 1-10E(a) 10 -1.05 -0.82 -0.45 -0.49 -0.07 0.17 0.14 -0.08
1 HCl 1-11E(a) 3 0.98 0.48 4.16 0.1 4.71 3.8 4.58 -0.14
1 HCl 1-13E(a) 1 0.38 0.22 1.07 -0.25 2.33 0.91 2.27 -0.36 10 HCl 10-3E(a) 0.1 -1.38 -0.61 -0.53 -0.41 -0.25 -0.07 -0.09 -0.10 10 HCl 10-13E(a) 0.3 -0.33 -0.29 0.07 -0.24 0.37 0.29 0.44 -0.10 10 HCl 10-1P(a) 0.01 -1.79 -0.82 -1.08 -0.54 8.64 -0.47 8.85 -0.13 10 HCl 10-3P(a) 0.03 -0.39 -0.51 -0.4 -0.19 1.3 -0.01 1.43 0.06 10 HCl 10-5P(a) 0.1 -0.87 0.06 0.07 0.03 0.2 0.02 0.19 0.00 10 HCl 10-7P(a) 0.3 0.41 0.12 0.12 0.09 0.21 0.03 0.18 0.03 10 HCl 10-9P(a) 1 0.45 0.27 1.36 0.04 1.56 1.16 1.49 -0.09 10 HCl 10-11P(a) 3 0.73 0.67 1.68 0.42 1.53 1.18 1.36 0.09 10 HCl 10-13P(a) 10 0.37 0.25 -0.24 0.05 -0.07 -0.43 -0.13 -0.08 1 HNO3 1-5E(a) 10 -25.55 -23.82 -17.1 10.95 1004.05 0.85 1010.1 22.9 10 HNO3 10-3E(a) 1 -2.29 -2.25 -1.03 1.63 98.36 0.67 98.93 2.76 10 HNO3 10-5E(a) 10 0.04 -0.03 0.56 0.15 -0.47 0.58 -0.47 0.16 1 H2SO4 1-1E(a) 0.1 -29.76 -27.28 -19.25 12.05 1136.08 1.33 1143.01 25.75 10 H2SO4 10-1E(a) 0.1 0.06 -0.02 0.2 -0.02 0.58 0.21 0.59 -0.01 10 H2SO4 10-3E(a) 1 -0.01 0.01 0.09 0.06 0.03 0.08 0.02 0.05 10 H2SO4 10-5E(a) 10 -0.05 0.18 -0.07 -0.05 0.13 -0.2 0.08 -0.15 10 H2SO4 10-7P(a) 0.1 -0.14 0.31 0.03 0.13 0.05 -0.2 -0.03 -0.02 10 H2SO4 10-9P(a) 1 0.73 0.35 0.34 0.28 1.01 0.08 0.92 0.1 10 H2SO4 10-11P(a) 10 -0.37 -0.03 0.09 0.14 0.12 0.11 0.13 0.15 10 CH3CO2H 10-5P(a) 10 -0.57 -0.73 -048 -0.4 -0.7 0.07 -0.51 -0.03 10 CH3CO2H 10-9E(a) 1 -1.81 -0.62 0.00 -0.12 -0.5 0.47 -0.34 0.19 10 NH4OH 10-1E (a) 0.1 0.11 0.2 0.1 0.11 0.39 -0.05 0.34 0.01 10 NH4OH 10-7P (a) 0.1 0.52 0.29 0.21 0.15 -0.1 -0.01 -0.17 0.00 10 NH4OH 10-9P (a) 1 1.46 0.86 0.91 0.59 0.27 0.27 0.02 0.16 10 NH4OH 10-11P (a) 10 0.73 0.67 0.4 0.34 0.64 -0.1 0.47 0.01 1 HCl 1-7E(o) 0.3 -1.03 -0.29 -0.22 -0.16 1.48 0.00 1.56 0.01 10 HCl 10-12E(o) 0.01 0.1 0.08 0.09 0.00 -1.3 0.03 -1.32 -0.04 10 HCl 10-14P(o) 10 -91.11 -84.13 -60.91 37.57 3461.13 2.53 3482.5 79.8 10 HNO3 10-4 E(o) 1 -2.19 -1.82 -1.12 1.19 86.13 0.25 86.59 2.1 10 HNO3 10-6 E(o) 10 0.56 0.33 -0.38 0.01 -0.68 -0.63 -0.76 -0.16 10 HNO3 10-10 P(o) 1 -25.7 -23.74 -16.5 10.87 994.43 1.4 1000.46 22.79 10 H2SO4 10-4 E(o) 1 0.19 -0.23 -0.33 0.54 -0.01 -0.16 0.05 -0.42 10 H2SO4 10-6E(o) 10 0.33 -0.18 -0.24 0.01 0.33 -0.1 0.38 0.1 10 CH3CO2H 10-8E(o) 0.1 0.21 0.14 0.17 0.23 0.26 0.07 0.23 0.16 10 CH3CO2H 10-10E(o) 1 -0.7 0.35 0.51 0.37 3.52 0.25 3.43 0.19 10 CH3CO2H 10-12E(o) 10 0.16 -0.16 0.05 0.01 0.3 0.17 0.34 0.09
[image:5.595.48.543.499.542.2]Nomenclature: E-Ethylation process; P-Propylation process; (a)-aqueous phase and (o)-organic phase
Table 3. UM-Almaden: Mean isotopic signatures (‰) (Mean±2*σ)
Isotope δ204Hg δ202Hg δ201Hg δ200Hg δ199Hg Δ201Hg Δ199Hg Δ200Hg UM (we) -0.95±0.25 -0.60±0.10 -0.49±0.12 -0.30±0.07 -0.17±0.10 -0.03±0.11 -0.01±0.08 -0.00±0.010 UM-Estrade --- -0.51±0.15 -0.41±0.11 -0.26±0.10 -0.14±0.09 -0.03±0.04 -0.01±0.07 -0.01±0.06 UM-Bergquist -0.83±0.11 -0.54±0.08 -0.44±0.07 -0.27±0.04 -0.14±0.06 -0.04±0.04 -0.01±0.02 -0.00±0.02
Table 4. Comparison table of MDF and MIF
Ligands/Isotopes δ202Hg(‰) ±2*σ δ201Hg(‰) ±2*σ Δ201Hg(‰) ±2*σ
HCl 0.42±0.10 1.3±0.12 0.98±0.11
HNO3 -0.03±0.10 0.56±0.12 0.58±0.11
H2SO4 0.18±0.10 -0.07±0.12 -0.2±0.11
CH3CO2H -0.73±0.10 -0.48±0.12 0.07±0.11
[image:5.595.99.496.667.756.2]NH4OH 0.67±0.10 0.4±0.12 -0.1±0.11
Table 5. Comparison of the two derivatization processes: Propylation and Ethylation
Ligand [C]. Ligand δ200Hg (‰) δ201Hg(‰) Δ201Hg(‰) Propylation Ethylation Propylation Ethylation Propylation Ethylation HCl 0.01 -0.82 --- -1.08 --- -0.47 --- HCl 0.03 -0.51 --- -0.4 --- -0.01 ---
HCl 0.1 0.06 -0.61 0.07 -0.53 0.02 -0.07
HCl 0.3 0.12 -0.29 0.12 0.07 0.03 0.29
HCl 1 0.27 0.41 1.36 1.33 1.16 1.02
HCl 3 0.67 0.20 1.68 0.20 1.18 1.37
DISCUSSIONS
The average isotopic signatures: The reference material we used was synthesized from liquid Hg(0) from the Almadén mines (Spain), UM-Almadén. This work should allow us to validate our analyses. Table 3 shows our measurements of average isotopic signatures (‰) on all reference materials. We can see that our values compare very favourably with those obtained by (Bergquist and Blum, 2007)and (Estrade and al., 2009). The differences between works are small. Isotope compositions were referenced to the bracketing Hg standard (NIST 3133 solution). Compositions were reported in per mil (‰) as either mass-dependent fractionation (denoted as “del” or δxxxHg) or mass-independent fractionation (denoted as “delta” or ΔxxxHg).
Comparison of the ligands used: As shown in Table 1, the concentration of the ligands studied is between 0.01% and 10%. The results in Table 4, taken from about 10% concentration measurements for 10ppb Hg ligands in the aqueous phase. Nearly all observed isotopic fractionation in mass dependent and independent fractionation. The two splits, dependent and independent of mass, are observed for all ligands with isotopic signatures that vary greatly depending on the ligand. As can be seen in the table below, these ligands have MDF with slight isotopic variations. There are, however, some exceptions where the value of fractionation (MDF) of HCl sample is superior of +1‰ (exactly +1.3‰ for δ201Hg). So we also notethat acetic acid has the lowest MDF, equal to -0.73‰ for δ202Hg and -0.48‰ for δ201Hg.Similarly, mass-independent fractionation (MIF) is only the majority in the case of HCl and HNO3 for the 201Hg isotope. Hydrochloric acid
and nitric acid induce positive anomalies in the aqueous phase of +0.98 (‰) and +0.58 (‰) respectively, while negative anomalies are observed for sulphuric acid and ammonium mixtures of -0.2‰ and -0.1‰ respectively for the same isotope. The anomalies observed for the last three samples (i.e. H2SO4, CH3CO2H, NH4OH) can be considered negligible.
Comparison of the two derivatization processes: Ethylation and Propylation: Table 5 allows us to compare the results obtained for the two derivatization processes performed, for the HCl ligand at 10ppb in the aqueous phase. For comparison, the results reported in Table 5 confirm the hypothesis that derivatization with NaBPr4 (Propylation) would be more
effective than with NaBEt4 (Ethylation) (Sonke, 2011). We
noted above that the MDF values (δ202Hg and δ201Hg) for Propylation are higher than those obtained by the Ethylation process, with the exception of HCl at 10% concentration. In addition to the fact that the propylation protocol is more effective for derivatization, it is worth noting a significant difference in efficiency between these processes on the MIF values for the isotope 201Hg i.e. +1.37‰ at 3%. Slight anomalies noted for HCl concentrations below 1%.In propylation we note values between -0.47‰ and 0.03‰ and in ethylation it varies from -0.07‰ to 0.29‰ for Δ201Hg. This table also shows that between 1% and 3% in HCl concentration, the MDF and MIF values are all positive. It is also noted that between 0.01% and 3% HCl concentration, all isotopic signatures obtained in propylation increase with HCl concentration, which is not observed in the ethylation process.
Influence of HCl concentration on MDF: Figure 2 shows we have plotted the spectra of MFD measured for propylation process. In this study, we show that HCl samples exhibit a
similar behaviour towards the isotopic variations observed in Figure 2.a and 2.b. However, three main trends appear to be emerging for compounds with concentrations in the:
-[0.01-0.1]: the isotopic signatures of mercury Hg are almost zero;
- [0.1-3]: the evolution of the isotopic signature observed is increasing;
[image:6.595.310.562.198.301.2]- [3-10]: a progressive decrease in the isotopic signature for δ202Hg (‰) and a sudden decrease in the variation of δ201Hg (‰), up to a negative value at 10% in HCl concentration, are observed.
Figure 2. Evolution of MDF as a function of HCl concentration: (a) δ202Hg (‰) vs[HCl]% and (b) δ201Hg (‰) vs [HCl]%
These results show that the variations of δ202Hg(‰) are not significantly different from those observed for δ201Hg(‰) depending on the HCl concentration. Indeed, the isotopic signature δ202Hg (‰) has an important MDF, from +1.8‰ to 3%[HCl]. In comparison to these two figures, it is important to note that the values of δ202Hg(‰) are much lower than those of δ201Hg(‰). We can therefore conclude with certainty that the different MDF, δ202Hg(‰) and δ201Hg(‰), observed are practically identical and that the variation in isotopic signatures does indeed depend on the species concentration.
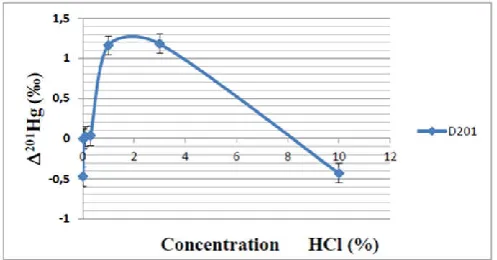
Influence of HCl concentration on MIF: From the results found and illustrated in the figure below, we notice a low MIF, observed for 0.01%<[HCl]<0.3% and ranging from[-0.4‰< Δ201Hg(‰)<+0.03‰] to a high MIF between 1% <[HCl]<3% corresponding to fractionation values equal to +1.15‰ for the 1%[HCl] and +1.2‰ for the 3%[HCl] solution. Above 3% in HCl concentration, there is a gradual decrease in the value from Δ201Hg (‰) to a negative MIF, equal to -0.43‰ to 10%[HCl].
Figure 3. Evolution of the MIF as a function of the concentration of [HCl]
According to the literature, two main mechanisms have been advanced to explain the effect of Hg's MIF, i.e. the nuclear volume effect [mechanism established by Bigeliesen (1996) and Schauble (2007) and the magnetic isotopic effect
[image:6.595.310.559.585.715.2]highlighted by Buchachenko et al (1976), Turro and Kraeutler (1978), Turro (1993), Buchachenko (1995), Buchachenko (2001)] (Yin and al., 2010). It now seems certain that the magnetic isotopic effect is the main cause of MIF observed in photochemical reactions involving mercury.
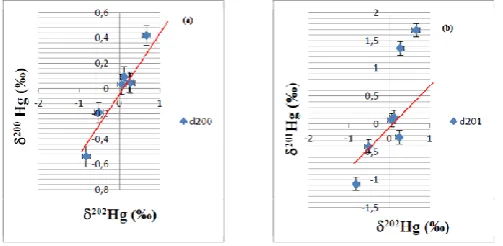
[image:7.595.39.291.182.305.2]MIF and MDF as a function of MDF-line:In this part of the interpretation, both Figure 4-a and 4-b present similar scenarios, supported by the presence of a relationship between MDF.
Figure 4. Relation between: (a) δ200Hg(‰) vs δ202Hg(‰) (b) δ201Hg(‰) vs δ202Hg(‰)
Indeed, in the representations showing the evolution of δ201Hg as a function of δ202Hg, and the evolution of δ200Hg as a function of δ202Hg, a linear function called MDF-line (red line) allows to clearly observe the behaviour of Δ201Hg as compared to δ200Hg. Values above the MDF-line function will be considered negative. From Figure 4, it can be seen that the anomaly Δ201Hg increases with δ202Hg. An identical scenario is observed for the evolution of δ200Hg according to δ202Hg. A mass dependent fractionation (MDF) is observed with very low isotopic signatures, which vary between -0.58‰ and +0.43‰ for δ200Hg; similarly, mass independent fractionations (MIF), between -1.2‰ and +1.7‰ are observed for Δ201Hg. Equally important positive anomalies are observed i.e. +1.7‰ and +1.35‰ for Δ201Hg, while an MDF equal to +0.45‰ is observed for δ200Hg. Similarly, low isotopic variations are observed i.e. -1.2‰ and -0.25‰ for Δ201Hg as well as an MDF equal to -0.58‰ for δ200Hg. These negative anomalies are significant for samples of the HCl ligand, compared to the uncertainties calculated (2σ) and reported in Table 3. The results of the analyses of the HCl samples show that there is a significant difference in the evolution of isotopic variations for δ200Hg and Δ201Hg, these variations being much smaller for δ200Hg than for Δ201Hg.
Conclusion
In this work, we test two techniques (propylation and ethylation) to determine mercury isotopic. We have studied in detail the two types of isotopic fractionation, dependent (MDF) and mass independent (MIF). The technique used was chosen with the aim of achieving the maximum possible experimental precision, estimated at 0.1-0.3% (Klaue and Blum, 2000). Compared to the literature, our study showed that the statement by several authors that the propylation process was much more effective than ethylation was not always verified for some samples, such as HCl type samples with a concentration of 10%. This therefore requires a thorough study on the influence of these two processes. The study revealed that no isotopic signature was observed in the majority of samples of the organic phase, this could be explained by the evaporation time.
REFERENCES
Albaréde, F., Telouk, P., Blichert-Toft, J., Boyet, M.,Agranier, A., Nelson, B. 2004. Precise and accurate isotopic
measurements using multiple-collector ICPMS.
Geochimicaet Cosmochimica Acta, 68:2725-2744.
Bergquist, A. B. 2007. Mass Dependent and Independent Fractionation of Hg Isotopes by Photoreduction in Aquatic Systems.Science, 318: 417.
Biswas J. C, Dazzo, F. B.,Ladha, J. K.,Yanni, Y. G. 2000.Rhizobial Inoculation Influences Seedling Vigor and Yield of Rice. Agronomy journal, 92:880-886.
Blum, J. D., Bergquist, B. A. 2007. Reporting of variations in the natural isotopic composition of mercury. Anal Bioanal Chem., 388:353-359.
Bravo-Sanchez, R. L., Encinar, J. R, Martinez,I.J. F. 2004. Mercury speciation analysis in sea water by solide phase microextraction-gas chromatography-inductively coupled plasma mass spectrometry using ethyl and propyl derivatisation. Matri effects evaluation.SpectrochimicaActa Part B, 59:59-66.
Bridget, A., Bergquist, J., Blum, D. 2009. The Odds and Evens of Mercury Isotopes: Applications of Mass-Dependent and Mass-Independent Isotope Fractionation. Elements, 5:353-357.
Buchachenko, L. A., Kouznetsov, A. D., Shishkov, V. A. 2004.Spin Biochemistry: Magnetic Isotope Effect in the Reaction of Creatine Kinase with CH3HgCl.The Journal of Physical Chemistry, 5: 108.
Carlier-Pinasseau, C., Lespes, G., Astruc, M.1997.
Determination of butyl-and phenyl in compounds in sediments by GC-FPD after NaBEt4 ethylation. Talanta,
44:1167-1171.
Carmouze, J. P., Roulet, M. et Grimaldi, C. 2000. Le mercure en Amazonie. Rôle de l’homme et de l’environnement.
Expertise collégiale IRD, 502.
Estrade, N., Carignan, J., Sonke, J. E and Donard, O. F. X. 2009. Measuring Hg Isotopes in Bio-Geo-Environmental Reference Materials. Geostandards and Geoanalytical. Fain, X., Ferrari, C. 2003.Etude de faisabilité de la mise au
point d’analyseur en continu du méthylmercure dans
l’atmosphére, Programme Primequal 2-PREDIT,
convention de recherche 16-G.
Foucher, D., Hintelmann, H. 2006. High precision mercury isotope ratios in sediments using cold-vapor generation
multi-collector inductively coupled plasma mass
spectrometry. Anal BioanalChem, 384:1470-1478.
Halliday, A. N., Lee, D. C. 1995. Recent developments in inductively coupled plasma magnetic sector multiple collector mass spectrometry. International journal of Mass spectrometry and Ion Processes, 146:21-33.
Klaue, B., Blum, J. D. 2000. Mercury Isotopic Analyses by Single and Multi-collector Magnetic Sector Inductively Coupled Plasma Mass Spectrometry. Journal of conference Abstracts, 5:591.
Run-Sheng, Y., Xin-Bin, F., Foucher, D., Wen-Fang, S., Zhi-Qi, Z., Jing, W. 2010. High Precision Determination of Mercury Isotope Ratios Using online Mercury vapor
Generation System Coupled with, Multicollector
Inductively Coupled Plasma-Mass Spectrometer.
CHINESE JOURNAL OF ANALYTICAL CHEMISTRY, 38:929-934.
Sergei, F., Boulyga, U. K.,Prohaska, T. 2006. Improved abundance Sensitivity in MC6ICP-MS for determination of 236U/238U isotope ration in the 10-7 to 10-8 rang. J. Anal. Atom. Spectr, 21:1427-1430.
Sonke, J. E. 2011. A global model of mass independent mercury stable isotopic fractionation. Geochimica and CosmochimicaActa, 1-14.
Yin, R., Feng, X., Shi, W.2010. Application of the stable isotope system to the study of sources and fate of Hg in the environment: A review.Applied Geochemistry, 25: 1467-1477.