Aerodynamics of Asymmetrical
Land Speed Record Vehicles
By
Kevin Clemens
A thesis presented for the Degree of
Doctor of Philosophy
at
The University of Canterbury
Department of Mechanical Engineering
Christchurch, New Zealand
Abstract
Although current market penetration of battery electric cars is low (0.1% worldwide), it is rapidly growing as the advantages of electric vehicles (EV) in reduced pollution, CO2 emissions and lower operating costs overcome their higher initial purchase price. As battery systems carry far less energy than traditional liquid fuels, EVs face challenges to maximize efficiency to achieve acceptable performance and range. One way to enhance EV efficiency is to reduce aerodynamic drag.
In racing, the goal is to achieve maximum performance for a given available energy, which provides a laboratory to study vehicle system optimization. This is especially true for land speed racing where the singular aim is to safely achieve the highest possible speed on a long, closed course, for example the Bonneville Salt Flats in Utah. The goal in this form of racing is to minimize aerodynamic drag while maintaining dynamic stability.
In this work, aerodynamic, rolling resistance, and tractive forces and moments were examined for an asymmetrical land speed record vehicle through computational fluid dynamics (CFD) studies and the analysis of the equations of motion. Validation of CFD technique was performed by comparison of numerical results to published drag and lift, velocity profile, and flow topology of a 25° and 35° Ahmed body using Reynolds Averaged Navier-Stokes (RANS) turbulence models (25° and 35° Ahmed body) and Large Eddy Simulation (LES) (25° Ahmed body). RANS simulations were found to predict Cd (-1.4% of published values) and Cl (+2.3% of published values), while LES was less successful for Cd (+8.4%), and Cl (-11.6%). Both methods predicted velocity profiles and wake structures well.
Studies were undertaken to characterize the dynamic and aerodynamic stability of a bluff-body four “wheel” (Ahmed Body) vehicle and a two-wheel streamlined electric land speed record motorcycle. The Ahmed body was found (from CFD) to have positive lift between 0° and 45° yaw angles, and then transition to negative lift (downforce) between 45° and 55° of yaw angle at a speed of 150 mph (67 m/s). The two-wheel streamlined motorcycle was found (from CFD) to create lift greater than the vehicle weight at yaw angles greater than 50° at 150 mph (67 m/s) and at yaw angles greater than 20° at speeds of 250 mph (112 m/s), the design speed of the vehicle. The addition of a longitudinal, dorsal “shark fin” was found to reduce this lift to below the vehicle weight even at a yaw angle of 90° at a speed of 150 mph (67 m/s).
a 24.4% reduction in Cd, a change in Cl from +0.0026 (lift) to -0.255 (downforce). Lateral force coefficient (Cy) was reduced 11% compared to the original sidecar. From visualisations of the flow topology, large streamwise vortical structures originating from the shoulder regions of the rider were found to be the most significant sources of aerodynamic drag. Other parts of the sidecar body also produced streamwise vortices that contributed to pressure drag. Negative lift (downforce) was found to result primarily from the formation of a primary vortex along the leading edge of the underside of the splitter at the front of the vehicle.
Based upon these results, a new body for the sidecar was fabricated from composite materials. The modified sidecar was successful, setting four FIM world land speed records and one U.S. national land speed record in electric sidecar motorcycle classes at the Bonneville Salt Flats in Utah, U.S.A. in August 2016. Further validation of the new sidecar bodywork was undertaken with testing in a full-scale wind tunnel facility.
Acknowledgment
Dr. Mark Jermy is a unique polymath whose knowledge, experience and enthusiasm for an unusual research project and his willingness to mentor an atypical doctoral student has provided me with the opportunity of a lifetime. Simple thanks seem inadequate for his friendship, support and encouragement during my time at the University of Canterbury.
I would also like to recognize and thank Dr. Patrick Geoghegan for the many interesting discussions we have shared and for his assistance in revieweing this manuscript. I also appreciate the help of Bruce Robertson of the UC Mechanical Engineering department and his expertise in SolidWorks and Dr. John Sullivan of Purdue University whose land speed record efforts on electric motorcycles have continued to inspire me to always go faster.
Contents
Chapter 1 Introduction ...1
1.1 Motivation for this research ... 1
1.2 Aims and objectives ... 2
1.3 Thesis structure ... 3
Chapter 2 Historical and Literature Review ...5
2.1 A Brief history of land speed racing ... 5
2.2 Aerodynamics in the design ... 6
2.3 The Bonneville Salt Flats ... 6
2.4 Two and three wheels ... 8
2.5 Electric Vehicles ... 9
2.6 Challenges faced by electric vehicles ... 12
2.7 Dynamic and aerodynamic stability of a sidecar vehicle ... 14
2.7.1 Asymmetric vehicle aerodynamics ... 14
2.8 Consideration of aerodynamic stability ... 17
2.8.1 Flow field around a vehicle ... 17
2.8.2 Validation of CFD... 18
2.8.3 Validation Using Ahmed Body... 19
2.8.4 Flow Characteristics for the Ahmed body ... 20
2.9 Questions addressed in the current work ... 21
Chapter 3 CFD methodology for vehicle design ... 24
3.1 Overview ... 24
3.2 Coefficients of drag, lift and lateral force ... 24
3.3 Navier-Stokes Equations ... 26
3.4 Principles of CFD ... 28
3.4.1 RANS turbulence models ... 30
3.5 Validation of CFD ... 32
3.5.1 Validation Using Ahmed Body ... 32
3.5.2 Comparison to wind tunnel data ... 34
3.5.4 Large Eddy Simulations (LES) ... 50
Chapter 4 Optimisation Phase ... 58
4.1 Vehicle starting point ... 58
4.2 Creation of CFD Model ... 58
4.3 Computational Fluid Dynamics (CFD) methodology for sidecar ... 60
4.3.1 Creation of an easier-to-mesh model ... 61
4.3.2 CFD model modifications ... 62
4.3.3 Re Sensitivity ... 63
4.4 Overview of aerodynamic design... 64
4.5 Optimisation Phase of the Baker sidecar ... 65
4.5.1 Design of the Rear Body Section ... 81
4.5.3 Windshield ... 122
4.5.4 Splitter ... 125
4.6 Final Bonneville Design ... 127
4.7 Some observations on the optimisation process ... 137
4.8 Chapter 4 summary ... 139
Chapter 5 Experimental Results ... 142
5.1 Bonneville Salt Flats, August 2014 ... 142
5.2 Mathematical Modelling ... 144
5.3 Land Speed Efforts in 2015 ... 148
5.3.1 Motor Cooling ... 149
5.3.2 Bodywork ... 149
5.3.3 Battery and BMS ... 149
5.4 Testing in Colorado ... 152
5.5 2016 Configuration ... 153
5.6 East Coast Timing Association event in Ohio, June 2016 ... 154
5.7 Bonneville 2016 ... 158
5.8 Dynamometer testing (September 2016) ... 162
5.9 Mathematical Modelling of Bonneville Results ... 165
5.9.1 The contribution of rolling resistance ... 167
5.10 Full-scale wind tunnel testing ... 170
5.11 Flow visualisation ... 173
5.12 Lift and lateral forces ... 180
5.12.2 Lift data from CFD results ... 181
5.12.3 Lateral forces based on A2 wind tunnel data ... 182
5.13 Chapter Summary ... 183
Chapter 6 Symmetrical Vehicle Stability ... 185
6.1 Background ... 185
6.2 Dynamic stability ... 185
6.2.1 Four-wheel stability ... 185
6.2.2 Ahmed body as a generic vehicle ... 189
6.3 Aerodynamic stability ... 192
6.3.1 Effect of ambient cross wind ... 193
6.3.2 Yaw studies ... 193
6.3.3 Ahmed frontal area ... 193
6.3.4 Ahmed aerodynamic forces ... 194
6.4 Symmetrical land speed record streamline motorcycle ... 211
6.4.1 Streamliner Equations of Motion ... 212
6.5 Streamliner aerodynamics ... 216
6.6 Pressure and Viscous Forces ... 219
6.7 Addition of a tail fin ... 223
6.8 Effects of Lift and Side Forces ... 231
6.9 Streamliner Lift Stability ... 232
6.10 Addition of a dorsal “shark” fin ... 235
6.11 Summary of Chapter 6 ... 241
Chapter 7 Asymmetrical Sidecar Stability ... 243
7.1 Overview ... 243
7.1.1 Dynamic Stability... 243
7.2 Trike stability ... 244
7.2.1 Tadpole and delta trikes ... 244
7.2.2 Sidecar Equations of Motion ... 247
7.3 Calculating the stability of a sidecar ... 250
7.3.1 Sidecar frame of reference ... 250
7.3.2 Dynamic stability ... 254
7.4 Sidecars with asymmetrical forces... 259
7.5 Asymmetrical forces and stability of the sidecar motorcycle ... 266
7.5.2 Introduction of the Symmetry Quotient ... 268
7.5.3 Asymmetrical forces and moments ... 269
7.5.4 Pressure and Viscous Forces ... 271
7.5.5 Lateral Forces ... 273
7.5.6 Stability at large yaw angles ... 276
7.6 Surface friction visualisation ... 296
7.7 Summary of Chapter 7 ... 303
Chapter 8 Conclusions ... 307
8.1 Summary of research ... 307
8.1.1 Objective 1: Validation of CFD technique to provide a tool to study the aerodynamics of an asymmetrical sidecar design ... 307
8.1.2 Objective 2: An aerodynamic design study to examine modifications to the sidecar body to develop a lower drag configuration ... 307
8.1.3 Objective 3: Fabrication of new body panels in composite materials based upon the design study 308 8.1.4 Objective 4: Set the FIM world land speed record for unlimited electric sidecar motorcycles 308 8.1.5 Objective 5: Establish a physical model to help predict electric sidecar land speed record performance ... 308
8.1.6 Objective 6: Testing of the full-scale modified vehicle on a chassis dynamometer, wind tunnel, and test track venue and compare results to predictions ... 309
8.1.7 Objective 7: Establish methods to examine dynamic and aerodynamic stability of a symmetrical bluff body four-wheel vehicle and a two-wheel single-track aerodynamic streamliner 310 8.1.8 Objective 8: Use dynamic and aerodynamic stability methods to examine three-wheel symmetrical trike and three-wheel asymmetrical sidecar motorcycle vehicles ... 310
8.2 Questions answered in the current work ... 312
8.3 Conclusions ... 314
8.4 Future work ... 314
Bibliography ... 316
Appendix AComputational Fluid Dynamics ANSYS Fluent setup ... 321
Appendix BMotor heating studies ... 324
Appendix CFabrication of the new body section ... 334
2.1 Camille Jenatzy with Le Jamais Contente 5
2.2 Sir Malcolm Campbell and Bluebird 6
2.3 Bonneville Salt Flats 7
2.4 Ernest Henne with a supercharged BMW motorcycle 8
2.5 NSU streamlined motorcycle at Bonneville 9
2.6 Ack Attack 9
2.7 Lead Wedge electric vehicle 10
2.8 GM Sunraycer 13
2.9 Blohm und Voss BV141 asymmetrical aircraft 15
2.10 Thrust SSC 18
2.11 Ahmed body with 25-degree rear slant 20
2.12 Air flow over rear section of 25° Ahmed body [Ahmed, et al., 1984] 20
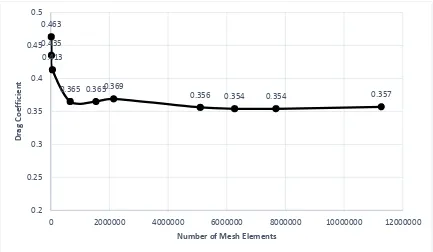
3.1 25° Ahmed drag coefficient variation with CFD mesh size at 40 m/s 33
3.2 25 ° Ahmed Re sensitivity- Comparison of current work to published data 35
3.3 25° Ahmed body drag and lift coefficients versus published wind tunnel data 35
3.4 35° Ahmed body drag and lift coefficients versus published wind tunnel data 36
3.5 Streamwise velocity profiles for a 25° Ahmed body 37
3.6 Pressure contours over the 25° Ahmed body 38
3.7 Velocity vectors over rear section of 25° Ahmed body 38
3.8 Velocity streamlines over 25° Ahmed body 39
3.9 Velocity vectors on a plane at the level of the horizontal trailing edge 40 of the backlight- 25° Ahmed body
3.10 Skin surface patterns that identify critical points [Tobak & Peake, 1982] 41
3.12 Surface lines of shear stress on the 25° Ahmed body 43
3.13 Surface skin friction patterns on rear of 25° Ahmed body 43
3.14 Turbulence Kinetic Energy plot over backlight of a 25° Ahmed body 44
3.15 Streamwise velocity profiles for a 35° Ahmed body 45
3.16 Pressure plot on 35° Ahmed body 46
3.17 Velocity streamlines over the 35° Ahmed body 46
3.18 Velocity vectors over the backlight of a 35° Ahmed body 47
3.19 Velocity vectors from above for 35° Ahmed body 47
3.20 Velocity in the vortex core for 35° Ahmed body 48
3.21 Velocity in the vortex core for 35° Ahmed body showing lower 48
streamwise vortices
3.22 Surface lines of shear stress on 35° Ahmed body backlight 49
3.23 Surface lines of shear stress on 35° Ahmed body- rear panel 49
3.24 Streamwise velocity profiles for a 25° Ahmed body from LES 52
3.25 Pressure contours on 25° Ahmed body from LES 53
3.26 Velocity streamlines over the 25° Ahmed body from LES 53
3.27 Velocity vectors over 25° Ahmed body from LES 54
3.28 Velocity vectors of 25° Ahmed body from above from LES 54
3.29 Velocity in the vortex core for 25° Ahmed body from LES 55
3.30 Shear stress surface lines of the 25° Ahmed body from LES 55
4.1 Brown and Nelson racing the Baker sidecar at the Isle of Man in 1989 58
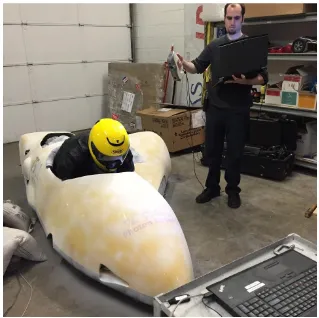
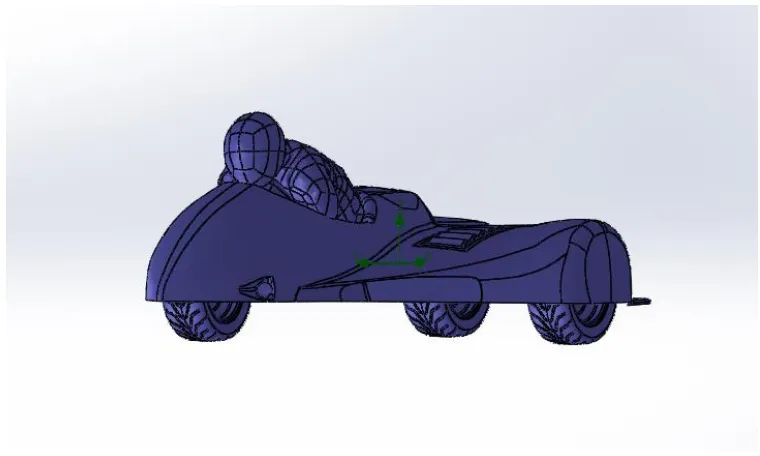
4.2 Laser scanning of the sidecar and rider 59
4.3 SolidWorks model of sidecar from laser scan 60
4.4 Mesh independence of initial sidecar version with stationary road at 67 m/s 61
4.5 Original sidecar body in blue compared to new body surface in red 62
4.6 Sidecar configuration for CFD with battery box and cooling tank 63
4.7 Re sensitivity of CFD for original sidecar 64
4.8 Baseline for the sidecar redesign study 66
4.9 Pressure distribution over initial sidecar at 67 m/s with moving road surface 67
4.10 Velocity vectors at rear of original sidecar 68
4.11 Iso-surface plot of TKE on the original sidecar 68
4.12 TKE of original sidecar- cut plane locate at x= 1.6 m from origin 69
4.13 TKE of original sidecar- cut plane locate at x= 2.0 m from origin 69
4.14 TKE of original sidecar- cut plane locate at x= 2.4 m from origin 70
4.15 TKE of original sidecar- cut plane locate at x= 2.8 m from origin 70
4.16 Rotation direction of vortices in wake region of original sidecar at x=2.8 m 71
4.17 Location of surface planes on sidecar: A: y=-0.1, B: y=0.15, C: y=0.48 72
4.18 Velocity vectors on plane A (y=-0.1) on battery box of sidecar 73
4.19 Velocity vectors on sidecar surface plane C (y=0.48) 73
4.20 Velocity profile of sidecar rear and wake region along plane A (y= -0.1 m) 74
4.21 Velocity profile of sidecar rear and wake between battery box 75
and rear wheel at plane B (y=0.15)
4.22 Velocity profile of sidecar rear and wake at rear wheel plane C (y=0.48) 76
4.23 The presence of streamwise vortices for into the sidecar wake 77
4.24 The presence of streamwise vortices from the wheels on the 77
underside of the sidecar
4.25 Shear stress lines for the original sidecar 78
4.26 Streamwise vortices and separation evident on the sidecar and rider 79
4.27 Closer view of the shear stress lines on the rider 79
4.28 Shear stress lines at the rear of the original sidecar 80
4.29 Velocity contours showing asymmetry of the vehicle wake 81
4.30 Sides extended rearward 84
4.31 Taper of the upper surface of the tail – Long tail sidecar 85
4.33 Velocity vortex core for the long-tail sidecar 86
4.34 Shear stress lines of rear of long-tail sidecar 87
4.35 Velocity vortex core showing origins of streamwise vortices 88
4.36 Velocity profile plot for long-tail sidecar at plane A (y= -0.1 m) 89
4.37 Velocity profile plot for long-tail sidecar at plane B (y= 0.15 m) 90
4.38 Velocity profile plot for long-tail sidecar at plane C (y= 0.48 m) 91
4.39 Streamwise vortices in the wake of the long-tail sidecar 92
4.40 TKE contour at the rear of the long-tail sidecar at x=2.4 m 92
4.41 TKE contour of rear wake region for long-tail sidecar at x-=2.8 m 93
4.42 Velocity vector plot on plane at x=2.8 m with TKE iso-surface 93
4.43 Plot of velocity vectors on a plane cut through the trailing edge 94
of the long-tail sidecar
4.44 Velocity vectors over tapered tail section of long-tail 94
sidecar plane A (y= -0.1 m)
4.45 Streamwise vortices into wake region of long-tail sidecar 95
4.46 Contour plot of velocity for long-tail sidecar 95
4.47 Rear section truncated 97
4.48 New rear section with radiused upper surface and flat floor 98
4.49 Radiused upper with tapered floor 99
4.50 Cutaway of rear panel 100
4.51 Tapered tail and truncated body following the work of Kamm 101
4.52 Refined version of Kamm-inspired design 102
4.53 Pressure contour plot over Kamm-inspired sidecar design 103
4.54 Velocity vector plot of flow over the Kamm-inspired rear section 104
at plane A (y= -0.1 m)
4.55 Velocity vector plot of flow over the Kamm-inspired rear section from above 104
4.56 Velocity profile plot of Kamm-inspired sidecar plane A (y= -0.1 m) 105
4.58 Velocity profile plot of Kamm-inspired sidecar plane C (y= 0.48 m) 107
4.59 TKE contour plot of Kamm-inspired sidecar at x= 1.6 m 108
4.60 TKE contour plot of Kamm-inspired sidecar at x= 2.0 m 108
4.61 TKE contour plot of Kamm-inspired sidecar at x= 2.4 m 109
4.62 TKE contour plot of Kamm-inspired sidecar at x= 2.8 m 109
4.63 Velocity vectors on the x= 2.8 m plane with TKE iso-surface for Kamm tail 110
4.64 Velocity vortex core plot of Kamm-inspired sidecar 111
4.65 Velocity contour of Kamm-inspired sidecar from above 111
4.66 Remove taper from upper section to allow room for the battery box 112
4.67 Vorticity region forms behind the rider 113
4.68 Tapered rear body with high line motor cover 114
4.69 Tapered rear body with low line motor cover 115
4.70 Surface pressure on sidecar with low-line motor cover 116
4.71 Velocity profile of sidecar with low-line motor cover at plane C (y=0.48m) 117
4.72 Velocity vectors in region behind motor cover plane C (y=0.48 m) 118
4.73 Separation region directly behind sidecar with motor cover 118
4.74 Velocity vortex core over motor cover 119
4.75 Velocity contour of wake region with motor cover 119
4.76 Revision of upper rear section to accommodate battery box but allow taper 120
4.77 Further revision of rear upper surface 121
4,78 Pressure contours on rider body surface 122
4.79 Large windshield 123
4.80 Smaller windshield to meet FIM Regulations 124
4.81 Pressure contour with small windshield 125
4.82 The addition of the splitter 126
4.83 Surface pressure contours with splitter and windshield 127
4.85 Comparison of effect of Re on original and final (Bonneville) sidecar designs 128
4.86 Shear stress lines over the top surface of the final design sidecar 129
4.87 Velocity vortex core plot of splitter area from top side 130
4.88 Shear stress lines on the underside of the sidecar 130
4.89 Velocity vortex core of the underside of the sidecar with splitter 131
4.90 Velocity vortex core plot of sidecar with windshield and splitter from front 132
4.91 Velocity streamlines over the top surface of the splitter 132
4.92 Surface pressure contours on the sidecar underside 133
4.93 Velocity plots of the wake region without a splitter at plane A (y= -0.1 m) 134
4.94 Velocity plots of the wake region with a splitter at plane B (y= 0.15 m) 135
4.95 Velocity vectors on the x= 2.8 m plane with TKE iso-surface for final design 136
4.96 Streamlines at the rear of the sidecar Bonneville version 136
4.97 Velocity iso-surface (velocity = 46 m/s) and velocity streamlines in 137
wake of the Bonneville sidecar design
4.98 Scatter plot of lift versus drag coefficients for optimisation phase 137
4.99 Scatter plot of lateral force versus drag coefficients for optimisation phase 138
4.100 Scatter plot of lift versus lateral force coefficients for optimisation phase 139
4.101 Streamwise vortices for the original sidecar 140
4.102 Streamwise vortices for the Bonneville sidecar 140
5.1 Land Speed Record at Bonneville- August 2014 142
5.2 Fitting of vehicle speed versus time data to generate Cd 144
and Crr approximations
5.3 Calculated versus actual performance of an electric motorcycle 145
during a land speed record attempt [Source: Sullivan, Purdue University]
5.4 Sidecar configuration with swinger for CFD- August 2014 at Bonneville 147
5.5 First attempt with sidecar at Bonneville- August 2014- predicted performance 148
5.7 Land speed record test in Colorado- September 2015 152
5.8 Colorado airport test- September 2015- predicted versus actual performance 153
5.9 Baker sidecar at ECTA Ohio test- June 2016 154
5.10 Predicted and actual performance from Ohio test 158
5.11 Preparing to run with the full sidecar body 159
5.12 Full bodywork including windshield and splitter 159
5.13 The Baker running in the unstreamlined (naked) class 160
5.14 A solar charging system was capable of producing 162
30-40% of the energy used for record runs
5.15 Dynamometer testing with rear wheel on one drum 163
5.16 Dynamometer results for sidecar (time) 164
5.17 Dynamometer results for sidecar (speed) 165
5.18 Three passes at Bonneville that were combined to create 166
a composite performance curve
5.19 Comparison of predicted data from CFD drag coefficients 167
to Bonneville results (without rolling resistance)
5.20 A comparison of Sullivan’s parabolic rolling resistance 168
coefficient model to Cooper’s models for Bonneville [Sullivan, 2016]
5.21 Predicted data including rolling reistance contribution 169
5.22 Power requirement versus velocity for sidecar at Bonneville 170
5.23 Cd for A2 full scale wind tunnel compared to CFD at different Re 171
5.24 Build-up of boundary layer from the step toward the vehicle 172
for the A2 wind tunnel [graph provided by A2]
5.25 Velocity contour plot of boundary layer at 38 m/s with stationary floor 173
5.26 Flow over the rider 174
5.27 Flow over the rider CFD 174
5.28 Flow over the windshield 175
5.29 CFD Flow over the windshield 175
5.31 CFD Flow onto splitter 176
5.32 Flow over rear body section (Full body) 177
5.33 CFD Flow over rear body section (Full body) 177
5.34 Flow over left rear body section (Full body) 178
5.35 CFD Flow over left rear body section (Full body) 178
5.36 Flow at rear of full body 179
5.37 CFD vectors showing flow at rear of full body 179
5.38 Cl from A2 wind tunnel versus CFD with Re 181
5.39 Lateral Force Coefficient (Cy) from CFD and A2 wind tunnel 183
6.1 Four-wheel bicycle model 186
6.2 Ahmed body with 25° rear slant 190
6.3 Tyre load versus cornering stiffness for high performance radial tyre 191
6.4 Dynamic stability of “scale 4 Ahmed” body from Equations of Motion 192
6.5 “Scale 4 Ahmed” body frontal area (A) versus yaw angle 194
6.6 “Scale 4 Ahmed” body meshing 195
6.7 “Scale 4 Ahmed” body drag coefficient versus Ø 195
6.8 Comparison of Cd versus Cd A for the “scale 4 Ahmed” body over range of Ø 196
6.9 Pressure and viscous drag forces for “scale 4 Ahmed” body 197
6.10 Change in drag force due to body shape change with change in Ø 197
6.11 “Scale 4 Ahmed” body (67 m/s) at Ø = 0°: (a) Velocity contour, 198
(b) Velocity vectors, (c) Turbulence kinetic energy
6.12 “Scale 4 Ahmed” body (67 m/s) at Ø = 5°: (a) Velocity contour, 199
(b) Velocity vectors, (c) Turbulence kinetic energy
6.13 “Scale 4 Ahmed” body (67 m/s) at Ø = 10°: (a) Velocity contour, 200
(b) Velocity vectors (c) Turbulence kinetic energy
6.15 “Scale 4 Ahmed” body (67 m/s) at Ø = 15°: (a) Velocity contour, 202 (b) Velocity vectors, (c) Turbulence kinetic energy
6.16 “Scale 4 Ahmed” body (67 m/s): pressure and viscous aerodynamic 203
lift force versus Ø
6.17 Static pressure distribution on the top surface of a “scale 4 Ahmed” body 204 (67 m/s) with Ø of (a) 0°, (b) 5°, (c) 10°, and (d) 15°
6.18 Change in lift force due to shape change with change in Ø 205
6.19 “Scale 4 Ahmed” body (67 m/s) with Ø = 0°, 15°, 30°, 45°,55°,60°, 205 and 90°yaw and roll moment coefficients versus yaw angle
6.20 “Scale 4 Ahmed” body (67 m/s) at Ø = 45°: (a) Velocity contour, 206
(b) Velocity vectors (c) Turbulence kinetic energy
6.21 Velocity vortex core for “scale 4 Ahmed” body at Ø = 45° 207
6.22 “Scale 4 Ahmed” body (67 m/s) at Ø = 60°: (a) Velocity contour, 207
(b) Velocity vectors (c) Turbulence kinetic energy
6.23 Velocity core for “scale 4 Ahmed” body at Ø = 60° 208
6.24 “Scale 4 Ahmed” body (67 m/s) at Ø = 90°: (a) Velocity contour, 209
(b) Velocity vectors (c) Turbulence kinetic energy
6.25 Turbulence kinetic energy in the flow over “scale 4 Ahmed” 210
body at Ø = 90°
6.26 Velocity vortex core for “scale 4 Ahmed” body at Ø = 90° 210
6.27 Motorcycle streamliner from Purdue University [Sullivan, 2016] 212
6.28 The four bodies of a single track, two-wheel vehicle [McMillan, 2015] 213
6.29 JBike6 plot of eigenvalues for a generic bicycle [Jbike6] 214
6.30 JBike6 root locus versus velocity plot [McMillan, 2015] 215
6.31 Weave and wobble modes for Purdue streamliner [McMillan, 2015] 215
6.32 SolidWorks CAD model of the Purdue University streamliner 216
6.33 Meshing of the Purdue streamliner 217
6.34 Streamliner frontal area versus yaw angle 217
6.35 Streamliner at 67 m/s: drag, lift, lateral force and yaw and 218
6.36 Frontal area of standard Ahmed body versus streamliner with yaw angle 218
6.37 Comparison of Cd versus CdA over range of Ø – streamliner 219
6.38 Streamliner pressure and viscous drag 220
6.39 Streamliner at Ø = 0° 220
6.40 Velocity core vortex plot for streamliner with Ø = 0° 221
6.41 Shear stress lines for streamliner at Ø = 0° 222
6.42 Streamliner at Ø = 10° 222
6.43 Streamwise vortex from the upper tail section of the streamliner at Ø = 10° 223
6.44 Profile of the NACA 66-010 used for CFD studies on the Purdue streamliner 224
6.45 Low fin version of the Purdue motorcycle streamliner 225
6.46 High fin version of the Purdue motorcycle streamliner 225
6.47 Base, low fin and high fin streamliner versus Ø 226
6.48 Base, low fin and high fin streamliner pressure and viscous drag versus Ø 227
6.49 Velocity vortex core for streamliner with no fin Ø =10° 227
6.50 Velocity vortex core for streamliner with low fin Ø =10° 228
6.51 Velocity vortex core for streamliner with high fin Ø =10° 228
6.52 Lateral force and yaw moment coefficient for base, low fin and 229
high fin streamliner
6.53 Roll Moment Coefficient versus Ø for base, low fin and high fin streamliner 230
6.54 Ø versus lift coefficient (Cl) for streamliner 231
6.55 Streamliner lift coefficient versus roll moment coefficient 232
6.56 Streamliner lift force versus large yaw angle-150 mph 232
6.57 Pressure distribution on high fin streamliner at 233
67 m/s and Ø =45°
6.58 Streamliner lift force versus large yaw angle-200 mph 234
6.59 Streamliner lift force versus large yaw angle-250 mph 234
6.60 Longitudinal dorsal “shark” fin added to the Purdue streamliner 235
6.62 Purdue streamliner with and without shark fin at 200 mph 236
6.63 Purdue streamliner with and without shark fin at 250 mph 237
6.64 Air flow over the high fin streamliner at Ø = 45° 237
6.65 Air flow over the shark fin streamliner at Ø = 45° 238
6.66 Pressure distribution on streamliner with shark fin at Ø = 45° 239
6.67 Velocity vortex core plot for streamliner with shark fin Ø = 45° 239
6.68 Surface shear stress plot for streamliner with shark fin at Ø = 45° 240
6.69 Velocity vortex core for streamliner with shark fin at Ø = 45° 240
7.1 Bicycle model of tadpole trike 245
7.2 Bicycle model of delta trike 246
7.3 Bicycle Model for Sidecar (Left: true wheel layout; 248
Right: layout in bicycle model)
7.4 Sidecar frame of reference for longitudinal bicycle model 251
7.5 Zero-order coefficient of sidecar characteristic equation versus speed 256
7.6 Zero-order coefficient of sidecar characteristic equation versus velocity 257 with reduced tyre cornering stiffness with reduced tyre cornering stiffness
7.7 Centre of mass moved to 90% rear 258
7.8 Centre of mass moved to 90% front 259
7.9 Bicycle Model for Sidecar (lateral) 261
7.10 Driving force at rear wheel versus velocity 262
7.11 Slip angle due to asymmetry versus velocity 264
7.12 The effect of steering angle δf on the slip angle α 265
7.13 Steer angle δf required to maintain zero slip angle 266
7.14 Sidecar Frontal Area with Yaw Angle 267
7.15 Frontal area versus yaw angle for sidecar, streamliner and Ahmed body 267
7.17 Bonneville sidecar drag, lift, lateral force, and roll and yaw moment 270 coefficients versus yaw angle (Ø)
7.18 Comparison of Cd versus CdA over range of yaw angles- Bonneville sidecar 271
7.19 Bonneville sidecar pressure and viscous drag forces 271
7.20 Wake of the original swinger sidecar at 67 m/s 272
7.21 Wake of the Bonneville sidecar at 67 m/s 273
7.22 Slip angle with zero cross wind 274
7.23 Slip angle (α) at 120 mph resulting from cross winds 275
7.24 Steering angle (δ) required to counter cross winds 276
7.25 Bonneville sidecar at high yaw angles 277
7.26 Sidecar surface pressure at Ø =- 45° 278
7.27 Velocity vortex core of sidecar at Ø = -45° 278
7.28 Sidecar surface pressure at Ø = + 45° yaw 279
7.29 Velocity vortex core of sidecar with Ø = +45° 279
7.30 Drag coefficient of Bonneville sidecar with and without splitter 280
7.31 Airflow over sidecar at Ø = +5° without splitter 281
7.32 Airflow over sidecar at Ø = +5° with splitter 281
7.33 Surface pressure distribution and x-vorticity on a VFE-2 282
delta wing [Cummings & Schütte, 2008]
7.34 Sidecar at 67 m/s without splitter (top view, Ø =0°) 283
7.35 Sidecar at 67 m/s with splitter (top view, Ø =0°) 283
7.36 Sidecar at 67 m/s without splitter (bottom view, Ø= 0°) 284
7.37 Sidecar at 67 m/s with splitter (bottom view, Ø =0°) 285
7.38 Lift force (N) of Bonneville sidecar with and without splitter 285
7.39 Sidecar surface pressure at positive Ø = +45° without splitter 286
7.40 Sidecar surface pressure at positive Ø = +45° with splitter 287
7.41 Pressure on the underside of the sidecar at Ø = 0° without splitter 288
7.43 Yaw moment coefficient of Bonneville sidecar with and without splitter 289
7.44 Longitudinal position of sidecar centre of aerodynamic pressure 290
relative to centre of mass
7.45 Velocity vortex core at Ø = -5° 291
7.46 Velocity vortex core at Ø = 0° 291
7.47 Velocity vortex core at Ø = 0° 292
7.48 Velocity vortex core at Ø = 0° with no splitter 293
7.49 Bonneville sidecar roll moment coefficient versus yaw angle 294
7.50 Bonneville sidecar pitch moment coefficient versus yaw 295
7.51 Rearward traveling sidecar at 67 m/s (view from above) 296
7.52 Several foci form on and around the rider, serving as an origin for vorticity 297
7.53 Flow separation on the rear motor cover 298
7.54 Convergent shear stress lines at the tail of the sidecar 299
7.55 Shear stress lines on the right side of the sidecar body 300
7.56 Shear stress lines on the underside of the sidecar body 301
7.57 Shear stress lines on the underside of the sidecar 302
7.58 Shear stress lines converging on the top surface of the splitter 303
8.1 Visualisation of streamwise vortices in the sidecar wake region 311
B.1 Motenergy ME113 motor- exploded view 325
B.2 Simplified geometry for one-dimensional heat transfer 326
B.3 Winding and rotor temperature plot 329
B.4 Temperature at which the windings and rotor temperatures converge 330
C.1 Rear body section in SolidWorks 335
C.3 ShopBot® CNC Router was used to shape the foam 336
C.4 Layers of shaped foam are stacked together and glued 337
C.5 Foam plug is painted with white latex paint and then coated 338
with polyvinyl alcohol mould release
C.6 First veil coat covering the plug 339
C.7 Carbon fibre layers added 340
C.8 Carbon fibre adds stiffness with very little weight and thickness 341
C.9 Removing foam of the plug from the composite part 342
C.10 Fitting the rough new part to the existing body 343
C.11 Rear body section has the proper profile but needs finishing bodywork 344
C.12 After bodywork and paint the new part accurately represents the 345
desired body shape
C.13 Vacuum-bagging the splitter 346
C.14 Splitter removed from bagging and ready to be trimmed 347
E.1 Layout of sidecar for longitudinal centre of mass calculation 352
List of Tables
2.1 Significant Records by Electric Vehicles 10
2.2 Specific Energy of traditional liquid fuels versus batteries 13
3.1 25 ° Ahmed body turbulence modelling (40 m/s) 34
3.2 LES Modelling of 25° Ahmed Body at 40 m/s 50
4.1 Original Sidecar versus Sidecar from new surface 62
4.2 Drag, lift, and lateral force coefficients for sidecar study 128
5.1 Parameters for Colorado test 153
5.2 Results from Ohio Testing in June 2016 155
5.3 Parameters for Ohio test 157
5.4 Results from 2016 Bonneville Land Speed Record Attempts 160
5.5 Parameters for Bonneville record 169
5.6 Lift Force of Full Body as percent of total vehicle mass 180
6.1 Side area of streamliner with low and high fin 226
6.2 Summary of results from Chapter 6 242
7.1 Terms used in Equations of Motion and their magnitudes for Baker Sidecar 254
7.2 Symmetry Quotient calculation for Ahmed, streamliner and sidecar 268
7.3 Pressure and viscous drag of swinger and Bonneville sidecar 273
7.4 Position of centre of aerodynamic pressure with and without splitter 290
C
HAPTER
1
I
NTRODUCTION
1.1 M
OTIVATION FOR THIS RESEARCHThis thesis uses an electrically-powered sidecar motorcycle as an example for developing analysis tools for the study of the aerodynamics and dynamic stability of asymmetrical vehicles. Sidecar motorcycles, with their sidecar wheel offset from the inline front and rear wheels are highly asymmetrical. Because asymmetrical vehicles are uncommon, little published research is available on their dynamic characteristics and aerodynamic high-speed stability.
Of all forms of motor racing, land speed racing gives the widest scope for creative design. Through hundreds of classes covering two, three and four-wheel vehicles with a variety of engines and propulsion systems, “Land speed racing represents the ultimate in freedom, ingenuity and creativity for engineers and constructors,” (Metz, 2004). The primary challenge in land speed racing is to maximise the propulsion forces created by the drive system and minimise the forces that resist motion, with a vehicle which is controllable and stable.
Electric land speed record vehicles also present a particularly interesting challenge as, compared to liquid-fuelled vehicles—they are able to carry only limited amounts of on-board energy in their battery systems. Increasing power requires an increase in mass greater than that for an equivalent combustion-driven vehicle. Thus, aerodynamic drag becomes an even greater factor for such electric vehicles. Optimizing aerodynamics for these vehicles also has implications for improved stability and fuel economy for street motorcycles and small urban vehicles for use in future transportation systems.
While oval-track racing cars can be designed with asymmetrical suspension and aerodynamic setups to turn only one direction on specific tracks (the Indianapolis 500, for example), ordinary land vehicles have traditionally been developed with bilaterally symmetrical configurations. Although this has largely resulted from styling considerations, a requirement for symmetry was also derived from the need to package the driver, occupants, cargo and a traditional mechanical drivetrain.
With the advent of the electrification of transportation, replacing a single combustion engine with multiple smaller electric motors, the need for the drivetrain to be symmetrically located within the vehicle chassis is no longer paramount. Further, as designers explore the potential for comfort and human factors in driverless autonomous vehicles, the requirement for traditional symmetrical placement of vehicle seating may no longer exist.
The practical result of the research reported in this thesis was the development of modelling techniques to characterize the performance and stability of extremely low drag land vehicles (particularly electric), including those that may be highly asymmetrical in their configuration. The models developed here have a wider application for the development of modern electric vehicles, which is of increasing importance to the motor industry now and into the future.
1.2 A
IMS AND OBJECTIVESIn 2014, the author competed at the Bonneville Salt Flats in Utah, U.S.A. with a Baker Formula One road-racing sidecar, modified with electric drive, to set an American Motorcyclist Association (AMA) U.S. national land speed record. The aim of this thesis in part is to examine the performance results of that 2014 sidecar design through physical vehicle testing and CFD studies and to produce an improved version to attempt to set an FIM world land speed record at Bonneville for unlimited (over 300 kg) electric sidecar motorcycles. In a broader sense, the main goal of this thesis is to establish a method for performance and vehicle stability predictions based upon modelling results and to characterize air flow over asymmetrical vehicle designs using the sidecar as a base analysis tool.
The objectives that will help achieve the aim of this thesis include:
• Predict electric sidecar land speed record performance by establishing a physical model of the land speed record sidecar tractive and resistive forces
• Examine dynamic and aerodynamic stability of a symmetrical bluff-body four-wheel vehicle and a two-wheel single-track aerodynamic streamliner
• Validation of CFD techniques to provide a tool to study the aerodynamics of an asymmetrical sidecar.
• Undertake an aerodynamic optimization study to undertake modifications to the sidecar body to develop a lower drag configuration
• Fabricate new chassis and body panels in composite materials based upon the optimization study
• Test the full-scale modified vehicle on a chassis dynamometer, in a wind tunnel, and at a test track and compare results to predictions
• Set FIM world land speed records for unlimited electric sidecar motorcycles
1.3
T
HESIS STRUCTUREThis thesis is divided into eight chapters. Following this introduction, Chapter 2 is a historical and literature review of land speed record racing, three-wheel vehicle configurations, and computational fluid dynamics (CFD) to provide a background for the current investigations. Also included in Chapter 2 are a series of questions that the current work will seek to answer.
Chapter 3 describes the theory and some of the techniques used in CFD to model external air flow around a vehicle. Published results for aerodynamic forces, wake velocity profiles, surface shear stress lines, and wake topology for two Ahmed body configurations are compared to CFD simulations developed with ANSYS Fluent to validate the CFD approach.
Chapter 4 is an optimization study, using CFD to develop modifications to the existing sidecar to improve (reduce) aerodynamic drag and lift. The fabrication of new composite bodywork components is described in an appendix.
In Chapter 5, the results from testing at an airport runway, the results from the land speed record efforts at Bonneville, the data from chassis dynamometer testing and the results from a full-scale wind tunnel session with the actual sidecar are compared with predictions from physical modelling.
Chapter 6 examines dynamic stability of symmetrical vehicles by reducing the equations of motion to characteristic polynomials to establish criteria for stability. A four-wheel generic vehicle and a two-wheel single-track streamliner vehicle are used as computational examples. Aerodynamic stability in yaw is also examined for a symmetrical low-drag vehicle.
Finally, Chapter 8 summarizes the work and draws conclusions about the effects of asymmetry on aerodynamic flow and the characterization of stability for land speed record vehicles. Suggestions for future studies and investigations in these areas are provided.
C
HAPTER
2
H
ISTORICAL AND
L
ITERATURE
R
EVIEW
2.1 A
B
RIEF HISTORY OF LAND SPEED RACINGThe first official Land Speed World Record was set in 1898 by Gaston de Chasseloup-Laubat driving a Jeantaud electric car. His top speed of 39.24 mph (63.15 kph) in a standard production machine was improved upon in 1899 when he built a streamlined body for the car—this was probably the first ever attempt at improving the aerodynamics of an automobile. Later, while competing against Camille Jenatzy’s electrically-powered Le Jamais Contente, (Figure 2.1), Chasseloup-Laubat’s streamlined Jeantaud reached a speed of 57.65 mph (92.78 kph).
Figure 2.1- Camille Jenatzy with Le Jamais Contente
It would be Jenatzy’s torpedo-shaped aerodynamic machine that was the first to break 100 kph, reaching a speed of 65.79 mph (105.88 kph) in 1899. As successful as these early electric automobiles were, the limitation with electric vehicles, then and now, was the amount of energy that could be carried in the battery. Le Jamais Contente would be the last electric vehicle to hold the “ultimate” land speed record—defined as the fastest vehicle regardless of power source.
2.2
A
ERODYNAMICS IN THE DESIGNProblems associated with aerodynamic instability were recognized by both Henry Segrave and Malcolm Campbell. In 1928, each began building cars using wind tunnel scale model testing to better understand the aerodynamics of land speed record vehicles (Dacy, 1930). Segrave’s
“Golden Arrow” took the ultimate record in 1929 at 231 mph (372 kph). Golden Arrow featured a large tail fin and a low aerodynamic nose. Campbell’s “Bluebird” set a record in 1931 at 246 mph (397 kph) and he continued to set records and refine his car with a larger tail fins (Figure 2.2) and smoother bodywork. He eventually raised the ultimate record to 301.13 mph (481 kph) in 1935 at the Bonneville Salt Flats in Utah (Campbell & Meech, 1988). Seagrave and Campbell both found that a tail fin helped move the centre of aerodynamic pressure significantly behind the centre of mass to promote stability in case of yaw.
Figure 2.2- Sir Malcolm Campbell and Bluebird
2.3 T
HEB
ONNEVILLES
ALTF
LATSFigure 2.3- Bonneville Salt Flats (author)
Several organizing bodies promote racing on the salt flats in the summer and early fall when the salt dries out and becomes hard enough to drive upon. The Bonneville Motorcycle Speed Trials (BMST) occurs at the end of August—an event exclusively for motorcycles where it is possible to set US national records ratified by the American Motorcyclist Association (AMA) and world records ratified by the Fédération Internationale de Motocyclisme (FIM).
2.4 T
WO AND THREE WHEELSThe 1930s saw a great deal of activity in motorcycle speed records, including efforts by BMW with both solo and sidecar machines. In 1929, Ernst Henne rode his supercharged 750cc BMW (Figure 2.4) to 134 mph (216 kph), establishing BMW as the world’s fastest motorcycle (Bacon, 1982). His effort was quickly overshadowed by Joe Wright, who rode a bespoke British machine to 150.4 mph (242.59 kph), becoming the first to break 150 mph on two wheels. Henne’s BMW was also fitted with a sidecar which allowed him to take the sidecar record in 1931 at a speed of 119.3 mph (190.83 kph). Aerodynamic streamlining played a significant role in BMW machines, with wheel discs, torpedo-shaped fully-faired bodies, tail fins and aerodynamically shaped helmets (Bacon R. , 1982).
Figure 2.4- Ernest Henne with a supercharged BMW motorcycle (BMW Motorad)
In 1954, New Zealand motorcyclist Bob Burns set a record for sidecar motorcycles on a Vincent-powered streamlined machine that went 155.2 mph (250.3 kph) (Swanson & Spinks, 2007). The same machine, without sidecar, was used by fellow New Zealander Russell Wright to set a solo motorcycle record of 185.18 mph (298.7 kph). Both records were set on public roads in New Zealand’s South Island.
(Fisher, 2012). The aerodynamic NSU machines moved away from traditional motorcycles by introducing long low-drag projectile-like vehicles that would come to be called streamliners.
Figure 2.5- NSU streamlined motorcycle at Bonneville
The current two-wheel motorcycle streamliner land speed record stands at 360.913 mph (582.1 kph), set in 2008 at Bonneville by Rocky Robinson on “Ack Attack” (Figure 2.6) (Fisher, 2012).
Figure 2.6- Ack Attack (Ack Attack)
2.5 E
LECTRICV
EHICLESFigure 2.7- Lead Wedge electric vehicle (Autolite)
Through the 1970s and 1980s, several efforts moved the electric vehicle records higher with Ed Rannberg setting a record in 1997 at 201.703 mph (325 kph) in “Lightning Rod”, becoming the first to exceed 200 mph on electric battery power. Table 2.1 details significant land speed records set by electric vehicles.
Table 2.1: Significant Records by Electric Vehicles
Year Vehicle Driver Speed (mph) Notes/Class
1899 Jeantaud (FR) Chasseloup-
Laubat
57.6 First Land
Speed Record
1899 Jamais
Contente (FR)
Jenatzy 68.8 Official
1901 Riker Torpedo
(USA)
Riker 57 Unofficial
1902 Baker Torpedo
(USA)
Baker 100 Unofficial
1968 Lead Wedge
(USA)
Kugel 138 Bonneville
1971 Silver Eagle
(USA)
Reed 146.437 14 national
7 world records
1974 Battery Box
(USA)
Headlund 174.918
1997 Lightning Rod Rannberg 201.703
1999 White Lightning Rammerfield 245.523
2004 Buckeye Bullet
1
314.958 AMA National
2005 Honda DeSimone 20.256 AMA Modified
300 kg
Motorcycle
2007 Electrobike Ingber 68.848 150 kg
motorcycle
2010 Kawasaki Carey 60.583 Sidecar 150 kg
2011 Kawasaki Carey 50.407 Sidecar 300 kg
2011 Honda Clemens 61.538 AMA Modified
150 kg
2011 Swigz Yates 173.574 Altered 300 kg
motorcycle
2011 Swigz Yates 187.142 Partially
streamlined 300kg motorcycle
2011 Swigz Yates 181.439 Over 300 kg
motorcycle
2011 Swigz Yates 196.42 Partial
streamlined
over 300kg
motorcycle
2011 KillaJoule Hakansson 138.586 Streamliner
sidecar over
300 kg
2012 Electric Ninja Clemens 64.094 Unstreamlined
150 kg
motorcycle
2012 Electric Ninja Clemens 78.424 Partially
streamlined 150 kg electric motorcycle
2013 Electric
Conversion
Sullivan 114.488 Altered 150 kg
motorcycle
2013 Electric
Conversion
Sullivan 113.079 Altered
partially streamlined
150 kg
motorcycle
2013 Lightning Hoogerhyde 203.361 Altered
300 kg motorcycle
2013 Honda Clemens 54.651 Sidecar 300 kg
2013 KillaJoule Hakansson 212.047 Streamliner
sidecar over
300 kg
2014 Electric Blue Burkdoll 204.9 BYU 500 kg
Streamliner automobile
2014 Baker Sidecar Clemens 64.475 AMA: Sidecar
over 300kg
2014 KillaJoule Hakansson 240.726 Streamliner
sidecar over
300 kg
2016 Baker Sidecar Clemens 108.499 FIM: Sidecar
over 300kg
2016 Baker Sidecar Clemens 89.113 FIM:
Unstreamlined
Sidecar over
300 kg
2016 KillaJoule Hakansson 248.674 FIM:
Streamliner
sidecar over
300kg
2.6 C
HALLENGES FACED BY ELECTRIC VEHICLESLand speed racing differs from most other forms of motor racing in that the primary goal is to achieve the highest possible speed while travelling in a straight line, over a course that can be more than 10 miles in length. In contrast, modern motor racing puts a premium on cornering performance and aerodynamic development has focused on dramatically increasing downforce (negative lift) to develop higher levels of cornering traction from the tyres. It is well established (Milliken & Milliken, 1995) that quicker lap times on a road course can result from high downforce, even at the expense of increased aerodynamic drag.
The dramatically lower specific energy of storage batteries when compared to traditional liquid fuels (Table 2.2) requires racing designers of electrically powered vehicles to increase efficiency and reduce energy consumption wherever possible. The Formula E series racing cars, which are designed with high downforce aerodynamics, only carry enough on-board energy to cover half the race distance—drivers physically change cars to a fully charged one during the race. Intensive research into new chemistries is underway to increase the performance of batteries for electric vehicles (Gallagher, Ahmed, Nelson, & Dees, 2015).
Table 2.2: Specific Energy of traditional liquid fuels versus batteries
Energy Source SpecificEnergy WH/kg
Gasoline 12,700
Diesel 11,600
Lead Acid battery 33-42
Ni Cad battery 40-60
Ni Metal Hydride battery 60-120
Ni Zinc battery 100
Lithium ion battery 100-265
Lithium Polymer battery 100-265
LiFePO4 battery 90-110
Lithium Sulphur 500
Lithium Air (theoretical) 11,140
Source: Greentransportation.info
It is reasonable to assume that as electric vehicle racing becomes more prevalent, the need for aerodynamic solutions with lower drag and lower downforce will result, requiring lower cornering speeds, but higher top speeds and a longer range with a given size of on-board energy storage. Solar vehicle racing provides an extreme example of ultra-high efficiency racing given the extremely low amounts of energy available from on-board solar cells. Solar racing cars have among the lowest aerodynamic drag of any road-going vehicle (Figure 2.8) (Tamai, 1999).
2.7 D
YNAMIC AND AERODYNAMIC STABILITY OF A SIDECAR VEHICLEThe stability of two wheel vehicles is complex because they are unstable when standing still and may also be unstable in certain speed ranges. The presence of, and oscillation frequencies in, the unstable speeds ranges can be calculated from the Equations of Motion (Chapters 6 and 7). There are mathematical techniques to help examine the roots and their effects on stability.
The addition of a third wheel to the single-track vehicle raises entirely different stability questions. The additional wheel can be added so that it produces three tracks (a traditional tricycle with one front and two rear wheels, or a reverse tricycle with two wheels at the front and one at the rear). Three-wheel vehicles of this sort are usually symmetrical around a plane connecting the single front or rear wheel and at the midpoint between the other two wheels. Three-wheel trikes have been variously popular from the early 1910s to the present day where they provide a way to reduce rolling resistance for solar-powered racing vehicles. Analyses of symmetrical three-wheel tricycle type vehicles often follows the same approach as would be used in analysing four-wheel vehicles (Starr, 2006).
Instead of adding the third wheel in a plane to form a symmetrical tricycle, the wheel can also be added offset from the line connecting the front and rear wheels, like an outrigger, resulting in an asymmetrical sidecar vehicle. Although sidecar outfits have been in use nearly as long as motorcycles, there is almost no literature that examines the equations of motions or stability of an asymmetrical three-wheel vehicle. Lurie (2012) examined the directional stability of a sidecar negotiating a turn by developing linearized equations of motion. His analyses examined only the lateral forces resulting from the change in slip angle caused by cornering and did not consider the asymmetry of lateral and longitudinal forces created by asymmetrical geometry or aerodynamics. These asymmetries result in forces and non-zero yaw angles that occur even when the sidecar is traveling along a straight path.
A more complete development of dynamic stability equations, taking into account forces and moments resulting from geometric and aerodynamic asymmetries for a generic sidecar is one of the goals of the current research.
2.7.1 Asymmetric vehicle aerodynamics
As with the dynamic stability of an asymmetrical sidecar vehicle, the effects of airflow over geometrically asymmetrical vehicles has received little attention. In most cases, designers of land and air vehicles work with a well-defined plane of longitudinal symmetry with the primary goal of reducing or eliminating the generation of lateral forces and potential instabilities caused by different air flow paths over each side of the vehicle body. Generally speaking, the design with the lowest possible drag will be a symmetric body. Bulky components, where possible, are placed on the axis of symmetry to minimize moment of inertia and aerodynamic yaw forces.Cases do exist however, where asymmetry either cannot be avoided or becomes a feature of the vehicle design.
adjusted the size of the wings and tail structure to balance the forces and moments to produce an aircraft that was reportedly more stable in flight than a traditional symmetrical single-engine machine (Green, 1979).
Figure 2.9- Blohm und Voss BV141 asymmetrical aircraft (Bundesarchiv)
More recently, Reisenthel and Childs (Reisenthel & Childs, 2007) used computational fluid dynamics (CFD) to design an optimized payload fairing for a rocket launch vehicle. The payload in this case was a satellite with a large mirror that was twice the diameter of the launch vehicle. The fairing needed to cover this asymmetrical payload and generate low lateral forces over a range of attack angles and at speeds approaching Mach 1.
Air vehicles must use their aerodynamic surfaces to change the path of airflow, producing forces that are used to control the vehicle. Caughey & Hafez (Caughey & Hafez, 2005) describe the importance of symmetry in flight vehicles in terms of a longitudinal equilibrium state. In this state, “changes in flight speed, angle of attack, or pitch angle cannot induce a side force, a rolling moment, or yawing moment.” Thus, except in special design cases or due to unanticipated accidental wing damage, air vehicles are generally designed to be symmetrical along their longitudinal plane.
Land vehicles use tyres (or steel flanged-wheels and rails for railroads) as their primary means of producing and countering lateral forces. The generation of lateral forces through development of a tyre slip angle creates yaw to change the vehicle path. Lateral aerodynamic forces due to cross winds are also countered by the addition of a small steering angle, generating the counter force via the cornering stiffness of the tyre.
Symmetrical land vehicles generate little or no lateral force when traveling straight ahead without a crosswind. Further, it is a characteristic of symmetrical vehicles that they produce equal but opposite aerodynamic lateral forces when yawed by equal positive or negative angles around the vertical axis of rotation. This symmetry of force generation simplifies control, particularly as vehicle speed rises to levels where significant aerodynamic forces are generated.
The main driver for analyses of asymmetrical aerodynamic forces generated by land vehicles has been in motorsports. The examination of airflow around one vehicle overtaking another using CFD programs to optimize race car design is of interest to race car designers and top racing teams (Fiumara, 2008). The flow over a combination of two or more cars disrupt symmetrical flow to create unequal lateral and lift forces that can induce vehicle instability when racing cars travel in close proximity.
Although most asymmetrical flow is accidental or unintentional, there is one class of racing motorcycle that is highly asymmetrical in its geometric design and its airflow characteristics. Three wheel sidecars were developed shortly after the introduction of the motorcycle as an inexpensive two-passenger vehicle. Racing sidecars quickly became popular and have been developed since the early 1970s with highly aerodynamic shapes that must be designed to accommodate both the machine’s pilot and also a second person or “swinger”. The swinger’s job is to shift their weight from one side of the motorcycle to the other to maintain vehicle road holding on right or left corners. Because the platform for the swinger and the sidecar wheel are both offset from the centreline of the other two wheels, the racing sidecar is by necessity an asymmetrical vehicle. As a consequence, its bodywork generates aerodynamic forces that are also asymmetrical.
asymmetrical and the generation of aerodynamic lateral forces caused by this asymmetry will be considered in this work.
2.8
C
ONSIDERATION OF AERODYNAMIC STABILITYThe primary aerodynamic concern with land speed record attempts has historically been the reduction of aerodynamic drag. In general, concern for aerodynamic stability has been met by ensuring that the centre of aerodynamic pressure is located behind the vehicle centre of mass to help promote directional stability in the event of a crosswind. This is often accomplished through the addition of a rear fin when the rules permit it, and/or by the addition of ballast in the front part of the vehicle to shift the centre of mass forward.
Aerodynamic lift is a concern for land speed record vehicles, as it can cause the vehicle to leave the ground, particularly if the vehicle is caught by a crosswind or suffers any other perturbation that causes the loss of directional stability. The balance of lift with drag becomes one of the primary concern for aerodynamicists working on sub-sonic land speed record designs. Adding aerodynamic downforce (negative lift) generally adds aerodynamic drag and reduces the vehicle’s top speed. The additional generation of lateral forces created by an asymmetrical land speed record vehicle and their effect on stability has not been previously studied.
2.8.1 Flow field around a vehicle
As bluff bodies move through the air, they develop regions of separated flow exhibiting (especially in 3D) often complex structures (Ahmed, Ramm, & Faltin, 1984). The presence of such structures in the disturbed region, downstream from the vehicle, are a major contributor to the aerodynamic drag experienced by the vehicle (Ahmed, et al., 1984).
The definition of two terms will be helpful:
• Wake- region downstream of the vehicle where the flow field is affected by the presence of the body
• Separation zone- region of closed streamlines delineated by separation stream surfaces.
Characterization of wake structures can provide a qualitative and quantitative insight into the mechanisms of aerodynamic drag experienced by the body. Vortices are usually present in the wake region, produced by shear and pressure gradients between streams traveling over different parts of the geometric shape of the vehicle body and separating from the body surface at different points.
(Dacy, 1930) and access to scale model and full-size wind tunnels has benefitted well-funded teams in their pursuit of speed.
More recently, as computational capability has dramatically increased, the development of Computational Fluid Dynamics (CFD) as a tool for the study of airflow became a standard practice in the automobile industry (Brzustowicz, Lounsberry, & Esclafer de La Rode, 2002). Computational Fluid Dynamic (CFD) simulations of flow fields, including visualizations of flow characteristics, when properly validated against the physical experimentation, can be used to provide understanding of flow characteristics and as a design tool for development of lower-drag vehicles.
Among the first land speed record vehicles to extensively use CFD to guide the development process was “Thrust SSC”, (Figure 2.10) which set the current supersonic land speed record of 763.035 mph in 1997 (Noble, 1998). The team used rocket-powered scale models to validate its CFD calculations, providing some level of confidence that the vehicle would remain stable at the transonic speeds for which it was aiming.
Figure 2.10- Thrust SSC (Bloodhound SSC photo)
2.8.2 Validation of CFD
which a model is an accurate representation of the real world from the perspective of the intended use of the model.”
The National Aeronautics and Space Administration (NASA) created the National Program for Applications-Oriented Research in CFD (NPARC) (NASA, 2012) which, in 2008, developed a web-based tutorial on Verification and Validation. Verification, according to NPARC, “…determines if the programming and computational implementation of the conceptual model is correct.” Thus, the Verification step “examines for computer programming errors.” Because, in the current study, the CFD program is the well-established ANSYS Fluent, no further Verification assessments will be undertaken for this research. Because this software has been extensively used and validated in both academic and industrial settings, it is assumed that any errors in programming or mathematics that might exist have already be been discovered or produce variations in results that are not significant for the sidecar simulations in the current research.
Both AIAA and NPARC define validation as a determination of the agreement of the CFD results with physical reality. An objective in the current work is to assess the validity of the CFD approach employed to evaluate a low drag asymmetrical land speed record vehicle. This was accomplished using the well-known Ahmed body to validate CFD flow simulations. The Ahmed body was chosen as it is a bluff body that is close to a ground plane with wake structures of the type found with ground vehicles that have not been fully streamlined.
2.8.3 Validation Using Ahmed Body
Current automotive aerodynamic research favours simplified vehicle shapes over representations of actual vehicles (Keogh, Barber, Diasinos, & Doig, 2016). The Ahmed body is often chosen to establish a baseline for a simulated symmetrical land vehicle and also to validate the CFD procedure used to evaluate airflow over the sidecar vehicle. The Ahmed body is a simplified vehicle geometry designed primarily to study aerodynamic flow, particularly in the wake regions behind the vehicle (Ahmed et al., 1984). Numerous investigations have been performed in both wind tunnels and using CFD and the values of forces and pressure and velocity flow fields are well established under a variety of test conditions and Reynolds Number (Re).
Figure 2.11- Ahmed body with 25-degree rear slant
2.8.4 Flow Characteristics for the Ahmed body
Air flow over the Ahmed body and the structure of the wake region has been investigated in detail (Ahmed, Ramm, & Faltin, 1984; Keogh, Barber, Diasinos, & Doig, 2016; Meile W. , Brenn, Reppenhagen, Lechner, & Fuchs, 2011; Wang, Zhou, Pin, & Chan, 2013; Baysal & Bayraktar, 2001; Lienhart, Stoots, & Becker, 2003). Flow over the 25 ° backlight separates at the leading edge of the downward sloped region and then reattaches before reaching the trailing edge of the backlight (Figure 2.12).
Vino et al. (2005) has reported that flow does not fully reattach to the backlight of a 25° Ahmed body but mixes with the large separated region behind the vertical base, sometimes making the reattachment difficult to detect. The low-pressure region over the backlight and the shear between air moving along the side of the body form a pair of longitudinal counter-rotating streamwise vortices originating along the edge of each side of the slanted portion of the backlight are sometimes called C-pillar vortices, as on a conventional automobile, the rearmost roof support is referred to as the C-pillar. The vortices also promote reattachment of the flow to the backlight (Lienhart, Stoots, & Becker, 2003). Between 12.5° and 30° the flow over the roof reattaches, however at a backlight angle above 30° the flow fails to reattach (Keogh, Barber, Diasinos, & Doig, 2016) and intensity of the trailing streamwise vortices reduces, resulting in lower overall drag (Serre E. , et al., 2013).
At the rear of the Ahmed body, behind the vertical section of the tail, when the flow leaves the trailing edge of the backlight a pair of counter-rotating vortices form, one above the other, in the separation region behind the base of the Ahmed body (Vino, Watkins, Mousley, Watmuff, & Prasad, 2005).
In the current work, 25° and 35° Ahmed bodies were used to validate the CFD approach that was subsequently applied to the sidecar design phase that resulted in a new rear bodywork section and other details that reduced both aerodynamic drag and promoted greater stability through a reduction in aerodynamic lift. Both the 25° and 35° Ahmed bodies were chosen because they represent a case where strong streamwise longitudinal vortices form and the flow reattaches to the backlight (25° Ahmed) and a case where the flow over the backlight remains separated and the streamwise vorticity and drag coefficient are both reduced (35° Ahmed). By validating both cases it was intended that the flow topology of the sidecar vehicle could be more reliably characterized.
The validation was primarily through a comparison of CFD lift and drag force coefficients to published data, primarily generated through wind tunnel studies. CFD was also used to analyse the flow topology in the wake region of Ahmed body for validation purposes and also the revised sidecar design to understand the effects of body shape on flow.
This work will also briefly study a highly streamlined two-wheel land speed record vehicle. The purpose of this portion of the investigation is to contrast the stability of a two-wheel single track vehicle with that of the three-wheel two-track asymmetrical sidecar. The streamlined two-wheel vehicle was also designed to operate at a higher top speed (250 mph) and at these speeds the aerodynamic forces are larger resulting in greater risk if control is lost.