Vertical structure of tropospheric winds on gas giants
R. K. Scott1,2and T. J. Dunkerton2
1School of Mathematics and Statistics, University of St Andrews, St Andrews, UK,2NorthWest Research Associates, Seattle,
Washington, USA
Abstract
Zonal mean zonal velocity profiles from cloud-tracking observations on Jupiter and Saturn are used to infer latitudinal variations of potential temperature consistent with a shear stable potential vorticity distribution. Immediately below the cloud tops, density stratification is weaker on the poleward and stronger on the equatorward flanks of midlatitude jets, while at greater depth the opposite relation holds. Thermal wind balance then yields the associated vertical shears of midlatitude jets in an altitude range bounded above by the cloud tops and bounded below by the level where the latitudinal gradient of static stability changes sign. The inferred vertical shear below the cloud tops is consistent with existing thermal profiling of the upper troposphere. The sense of the associated mean meridional circulation in the upper troposphere is discussed, and expected magnitudes are given based on existing estimates of the radiative timescale on each planet.1. Introduction
The zonal mean zonal velocities in the upper tropospheres of the gas giant planets have been well constrained observationally by several decades of observations and tracking of the visible features of cloud tops. In the case of Jupiter, a combination of Galileo, Voyager, and Cassini observations, together with ground-based and Hubble Space telescope observations, indicates zonal winds that are remarkably steady in time [Porco et al., 2003]. In the case of Saturn, with the possible exception of the equatorial jet [Sánchez-Lavega et al., 2007], zonal winds are again found to be relatively steady, although uncertainties remain concerning the reference frame relative to which these should be measured [Anderson and Schubert, 2007;Read et al., 2009]. How these cloud-measured winds vary in height in the opaque atmospheric region below the cloud deck remains unknown, with some studies arguing for an increase in wind magnitude going downward through the cloud layer [Dowling and Ingersoll, 1989;Orsolini and Leovy, 1993;Dowling, 1995], and others arguing for a decrease [Allison, 2000;Lian and Showman, 2008;Liu et al., 2013]. Near the equator, the vertical profile returned by the Galileo probe at 6.5∘N revealed winds increasing with depth [Atkinson et al., 1998].
On both planets, the relative vorticity of the observed cloud top winds has a latitudinal gradient that in places exceeds, and with opposite sign, the local planetary vorticity gradient. The resulting latitudinal profile of absolute vorticity
𝜁a=f+k⋅∇ ×u, (1)
wherefis the Coriolis parameter, is nonmonotonic, in apparent violation of stability criteria based on assump-tions of two-dimensional barotropic or equivalent barotropic flow [Kuo, 1949;Ingersoll et al., 1981]. The abso-lute vorticity profile resembles the staircase profiles ofDunkerton and Scott[2008] andDritschel and McIntyre
[2008] but with overshoot and undershoot on either side of the sharp gradients associated with each westerly jet core. Of course, nonmonotonicity of (1) does not imply shear instability of the jets, which depends addition-ally on details of the vertical flow structure: in particular, it has been shown that negative vertical shear may inhibit barotropic instability at the cloud level [Dowling and Ingersoll, 1989;Orsolini and Leovy, 1993]. Vertical structure enters more complete criteria for stability in three dimensions through the potential vorticity, defined approximately for a hydrostatic atmosphere as
q=𝜁a𝜃z, (2)
where 𝜃 is the potential temperature, with shear stability guaranteed if the latitudinal gradient ofq is monotonic in latitude.
RESEARCH LETTER
10.1002/2017GL072628
Key Points:
• The hypothesis that the Jovian and Saturnian zonal jets are deep and stable is used to constrain their vertical structure
• Midlatitide jets are inferred to increase with depth below the cloud top level • The associated mean meridional
circulation is inferred based on existing estimates of the radiative timescale
Correspondence to: R. K. Scott,
rks4@st-andrews.ac.uk
Citation:
Scott, R. K. and T. J. Dunkerton (2017), Vertical structure of tropospheric winds on gas giants,Geophys. Res. Lett.,44, doi:10.1002/2017GL072628.
Received 17 JAN 2017 Accepted 17 FEB 2017
Accepted article online 23 FEB 2017
Monotonicity ofqis not a necessary requirement for stability, and previous studies have emphasized the role of Arnold’s second stability theorem in accounting for the observed steadiness of the jets [Dowling, 1995]. Nonetheless, conservation ofqon fluid parcels, and the now well-understood tendency of wave and eddy motions in rotating, stratified atmospheres to mix background potential vorticity inhomogeneously into a piecewise constant, staircase-like profile [McIntyre, 1982;Dunkerton and Scott, 2008;Dritschel and McIntyre, 2008;Scott and Dritschel, 2012;Scott and Tissier, 2012], suggests that an assumption of monotonicqis a natural one in the absence of further assumptions about the nature of dynamical forcings. Such a monotonic profile may be obtained in spite of nonmonoticity of𝜁aif𝜃in (2) is permitted to vary appropriately in latitude. The required latitudinal variations in𝜃are the main focus of this study. A similar stabilizing role of latitudinally varying bottom topography in single layer models has been examined in the context of the Great Red Spot [Dowling and Ingersoll, 1989;Shetty et al., 2007;Marcus and Shetty, 2011] as well as in the predominantly zonally symmetric midlatitude flows [Thomson and McIntyre, 2016]; the present work may be considered partly as the extension of these ideas to a continuously stratified atmosphere.
Above the cloud level,𝜃has been measured by both Voyager and Cassini infrared spectrometers [Simon-Miller et al., 2006;Fletcher et al., 2007] and indicates a thermal structure with systematic latitudinal variations anticor-related with the cloud top jet profile, in the sense that the thermal wind decreases in magnitude throughout the upper troposphere and stratosphere. The tendency of the shear at the cloud top level is thus to stabilize the jets and already suggests that for appropriate thermal structure, nonmonotonic absolute vorticity may indeed be consistent with monotonic potential vorticity.
Below the cloud level, the atmosphere is opaque in both the visible and infrared, and the vertical structure of𝜃is not known. In this region, equation (2) can be used, together with the observed absolute vorticity at the cloud top level, to infer a𝜃perturbation required to compensate for the overshoot and undershoot in absolute vorticity and yield a monotonic potential vorticity. For definiteness, we seek theminimalsuch𝜃 per-turbation required to achieve a monotonic potential vorticity, specifically, that corresponding to a potential vorticity that is well mixed, with zero latitudinal gradient, between adjacent jet cores. The resulting mean flow is marginally stable, and we recognize that stronger𝜃perturbations, corresponding to strictly subcritical flow, may also be permissible in reality.
Figure 1 indicates the sense of the required𝜃perturbations relative to the jet cores. The schematic depicts a meridional cross section of the stably stratified atmosphere in midlatitudes above the deep dry-convecting region in the planetary interior. The base of the troposphere is considered to coincide with the top of a dry-convecting region (“convectopause”) driven by internal planetary heating, where, for simplicity, we assume that the atmosphere is isothermal [Ingersoll and Porco, 1978]. We make no further assumptions about the deep atmosphere and make no attempts to estimate the motions there, focussing entirely on the overlying atmo-spheric weather layer. The cloud top level is indicated at approximately 700 mbar. Two prograde, or westerly, jets are indicated by the letter “J” and extend vertically throughout the troposphere above and below the cloud top level. Warm (W) and cool (C)𝜃anomalies are introduced to alter the stratification,𝜃z, at the cloud level in the correct sense to compensate for the enhanced cyclonic vorticity on the poleward and anticyclonic vorticity on the equatorward flanks of the prograde jets, respectively. The resulting potential temperature dis-tribution is indicated by the sloping green lines, and illustrates the reduced𝜃zon the poleward, cyclonic flanks, where the isolines of potential temperature are pushed apart, and increased𝜃zon the equatorward flanks. These changes in static stability are consistent with the observed predominance of moist convective storm activity and lightning occurrence in the cyclonic regions on Jupiter [Ingersoll et al., 2004]. From the figure, it is also apparent that the indicated𝜃anomalies must affect𝜃zin the opposite sense in the lowermost tropo-sphere, near the convectopause. We associate the vertical level at which the effect on𝜃zchanges sign with an inflection point in the vertical profile of the associated thermal wind.
Figure 1.Schematic of the Jovian midlatitude troposphere: J, westerly jets; C/W, cold/warm potential temperature anomalies;F≷0, mechanical forcing; isolines of zonal velocity, black solid (positive) and dashed (negative); isolines of potential temperature, gray/green; and mean meridional circulation indicated by arrows. An approximate vertical profile of zonal jet magnitude is shown on the left, with an indication of the cloudy region of interest. Pressure values and relation to vertical structure are loosely based on the wind profile returned by the Galileo probe but are representative only.
The sense of the shear is consistent with the findings ofDowling and Ingersoll[1989] andOrsolini and Leovy
[1993]. It is also consistent with the vertical profile returned by the Galileo probe, although we do not attempt to apply our calculation outside the midlatitudes (the probe entry was at 6.5∘N).
Finally, the sense of the meridional circulation required to maintain this thermal structure against the restoring effect of radiative cooling above the cloud level is indicated by the orange arrows, along with the sign of the requisite mechanical forcing in steady state. Possible thermally direct Hadley circulations in the deep interior, which presumably bend from radial to axially parallel alignment at deeper levels, are beyond the present scope and are not shown in the figure.
In the following section we substantiate the above description and provide a highly approximate yet quanti-tative estimate of the vertical scale of the jets. In section 3, we compare this with existing calculations of the thermal wind in the upper troposphere, above the cloud level. In section 4, we provide a quantitative estimate of the meridional circulation based on existing estimates of radiative timescales on the two planets.
2. Estimate of the Vertical Wind Shear
We consider the potential temperature as the sum of a height-only dependent mean and a perturbation that may vary in both height and latitude as follows:
𝜃=𝜃0(z) +𝜃′(𝜙,z), (3)
wherezdenotes a log-pressure vertical coordinate that for convenience we define such thatz=0corresponds to the approximate pressure level,pcof the cloud tops, i.e.,z= −Hlog(p∕pc), whereHis a vertical density scale height. Thermal wind balance relates latitudinal variations of𝜃′to the vertical shear through the relation
afuz= −
R He
−𝜅z∕H𝜃′
𝜙, (4)
whereais the planetary radius,Ris the gas constant, and𝜅=cp∕R, withcpthe specific heat at constant pressure. The observed cloud top winds provide the absolute vorticity,𝜁obs
a . To obtain an estimate for𝜃′, we assume that the actual potential vorticity at cloud level
q=𝜁aobs𝜃z (5)
corresponds to a stable atmosphere with a monotonic profile in latitude and, moreover, seek the minimal 𝜃′ required to achieve this. Such a minimal𝜃′ corresponds to a potential vorticity profile that is constant
between jet cores, more extreme𝜃′perturbations resulting in a more stable or sloping staircase profile. We
therefore write
q=𝜁mon
where𝜁mon
a is a suitable monotonic profile derived from a minimal rearrangement of𝜁aobs, details of which are provided in Appendix A. Having thus determined𝜁mon
a , the desired perturbation potential temperature may then be obtained by combining (3), (5), and (6) to give
𝛼∶= 𝜃
′
z 𝜃0z
= 𝜁 mon a 𝜁obs
a
−1. (7)
We emphasize that𝜃′thus obtained is the minimal𝜃′required to ensure a shear stable profile of potential
vorticity.
For convenience we define a planetary deformation radius,LD=NH∕2Ω, and a planetary mean Rhines scale,
LRh= √
aU∕2Ω, whereN2=g𝜃
0z∕𝜃0is the squared buoyancy frequency,gthe gravitational acceleration, and Ωis the planetary rotation rate and whereUis a typical velocity scale of the zonal flow. In terms of these parameters and using the relationgH=RT0, whereT0=𝜃0(z=0), (4) may be written as
H2
U
(
uze𝜅z∕H) z= −
L2 D
L2 Rh
𝛼𝜙
sin𝜙, (8)
where now the right-hand side is a known function of latitude at the cloud top level. Further detailed analysis would require knowledge of the vertical structure of the right-hand side below the cloud top height. We note, however, with reference to Figure 1 and as discussed in section 1 that the required𝜃′anomalies are positive
(warmer) on the poleward jet flank and negative (cooler) on the equatorward jet flank and are such that the winds increase in magnitude going downward below the cloud top. An estimate of the vertical scale of the zonal flow may therefore be obtained by assuming an approximately exponential variation ofuon a vertical scaleD, withu∼ ±Ue−z∕D, withD>0. From (7) and by reference to Figure 1 it follows that, in the northern hemisphere,𝛼𝜙<0whereu>0, and vice versa, and that the opposite signs hold in the southern hemisphere. We thus obtain
H2
D2 − 𝜅H D ∼ L2 D L2 Rh
|𝛼𝜙|
|sin𝜙| (9)
globally and for both westerly and easterly jets. Rewriting as a quadratic inD∕H, we obtain the solution,
D H ∼
𝜅 2𝜀
( −1±
√ 1+ 4𝜀
𝜅2 )
, (10)
where
𝜀= L 2 D
L2 Rh
|𝛼𝜙|
|sin𝜙| (11)
may be considered as a dimensionless measure of the nonmonotonicity of𝜁obs
a normalized by stratification and jet speed, which enter throughLDandLRh, respectively. There is considerable uncertainty concerning the value ofNin the cloudy regions of both Jupiter and Saturn. On Jupiter,Sugiyama et al.[2006] give values of
Non the order of 0.003 s−1, depending on assumptions of condensate abundances. On Saturn, dynamical analysis of the Brown Spot suggests a comparable value ofN≈0.003s−1; we use this value here, bearing in mind that actual values may differ substantially. Jet speeds are better constrained; for westward jets, we take simply the maximum jet speed, while for eastward jets we take the average of the two flanking westward jets as a robust mean velocity scale. With these parameters fixed, we have computed values of𝜀averaged over each jet according to the method outlined in Appendix A, obtaining values between approximately 0.005 and 0.03, with values for Jupiter being generally slightly smaller than those for Saturn. We note that when the nonmonotonicity of𝜁obs
a is large enough that 4𝜀∕𝜅
2≫1, the positive root of (10) gives the scaling relation
D H ∼
1 √
𝜀. (12)
Figure 2.Vertical depth scales of jets on (top) Jupiter and (bottom) Saturn: estimates ofD∕Hfor westerly jets (dark gray/red) and easterly jets (light gray/blue); smaller values indicate jets that increase more rapidly with depth.D∕H>0and has been plotted with positive values increasing downward to emphasize that it applies to theincreasein wind magnitudebelowthe cloud top level. Observed cloud top winds shown in the upper part of each figure were obtained from Voyager 1 and Cassini ISS measurements [Porco et al., 2003;Read et al., 2009].
downward beneath both positive and negative jets. Figure 2 indicates a shear beneath all jets that is more or less uniform in latitude and of comparable magnitude on both Jupiter and Saturn. Jets for which the nonmonotonicity is stronger, e.g., the sharp Saturnian jets near ±75∘, imply stronger shear, or smallerD, but the square root depen-dence in (12) means that the difference is relatively modest. The sensitivity to static stability should be borne in mind, a smaller static stability requiring gen-erally smaller 𝜃 perturbations, hence smaller vertical shear, to reconcile the nonmonotonic𝜁obs
a with a monotonicq. Since, as discussed, we should allow for the potential vorticity to be more substantially subcritical throughout the troposphere, the vertical scales of ū
obtained here may be considered as upper bounds for the vertical scales of the actual jets.
3. Consistency at the
Cloud Top
Vertical shear in Jupiter’s upper tropo-sphere calculated from thermal winds derived from the Voyager infrared spec-trometerGierasch et al.[1986] indicates jets that decrease in magnitude going upward above the cloud level, consistent with the above calculations. The corre-lation between thermal wind shearūz
at 270 mbar obtained byGierasch et al.
[1986] and cloud top winds gives values ofuz∕uon the order of 1∕4Hand conse-quently a vertical scaleD∼4H. This value for the vertical scale is marginally larger than the value obtained in section 2 above, but the difference is consistent with our construction, which places the inflection point in the vertical profile of zonal wind below the cloud top level and which implies that the vertical wind shear should decrease, and henceDincrease, with increasing height. Indeed, meridional sections of thermal wind obtained from both Voyager and Cassini retrievals indicate Jovian jets that become nearly barotropic in the upper troposphere and stratosphere, [Simon-Miller et al., 2006;Read et al., 2006]. A similar vertical structure was obtained from Cassini observations of Saturn [Read et al., 2009].
4. Estimate of
(
v
̄
∗, ̄
w
∗)
heat and momentum fluxes in a unified manner. In this framework, the mean meridional circulation(v̄∗, ̄w∗)
satisfies a mass continuity equation of the form
1
acos𝜙 𝜕
𝜕𝜙(v̄∗cos𝜙) + 1 𝜌0
𝜕 𝜕z(𝜌0w̄
∗) =0, (13)
while the thermal equation in steady state is dominated by the balance
̄
w∗𝜃
0z= −(𝜃−𝜃e)∕𝜏rad (14)
[e.g.,Holton et al., 1995], where𝜏rad(z)is a radiative equilibrium state. Using the scaling arguments above, identifying𝜃′with departures from the radiative state,𝜃−𝜃
e, and with𝛼∼𝜃′∕𝜃0zD, (13) and (14) give the approximate scaling
̄
v∗∼𝛼a𝛿𝜙∕𝜏
rad and w̄∗∼𝛼D∕𝜏rad, (15)
wherea𝛿𝜙is the approximate latitudinal distance between jets. An estimate of𝜏rad≈4×10⁷s was suggested byFlasar[1989] for the Jovian tropopause, which combined with computed values of𝛼of the order 0.03 yields ̄
v∗∼5×10⁻³ms−1andw̄∗∼2×10⁻⁵ms−1. For Saturn,Conrath and Pirraglia[1983] estimate𝜏
rad≈3×10⁸s, while 𝛼∼0.1, givingv̄∗∼5×10⁻³ms−1andw̄∗∼5×10⁻⁵ms−1. The larger ratio ofw̄∗tov̄∗on Saturn compared with
Jupiter is accounted for simply by the wider jet spacing and corresponding overturning cell. For comparison, we note thatFlasar et al.[2005] estimated somewhat higher subsidence over the south pole, withw̄∗≈10−4ms−1, possibly indicating stronger mechanical forcing in polar regions.
5. Conclusions
The conceptual model illustrated in Figure 1 and substantiated in section 2 provides a way to reconcile the observed nonmonotonic latitudinal profile of absolute vorticity at cloud top level, with the remarkable sta-tionarity of the zonal jets and well-established concepts of eddy potential vorticity mixing. Since small-scale Lagrangian stirring is not expected to “overmix” potential vorticity into a zonal mean distribution involving negative latitudinal gradients [Wood and McIntyre, 2010], we hypothesize that jets are at least marginally stable throughout the troposphere. The compensation is through latitudinal potential temperature anomalies which in turn imply a negative vertical shear of the zonal mean winds, with jets decreasing in magnitude going up, above the cloud tops, and increasing in magnitude going down. The vertical scales inferred in Figure 2 for the jet shear are those required by the assumption of marginal criticality; they may be considered as upper bounds of the vertical scale required for subcriticality. In other words, jet magnitude must increase downward below the cloud deck at least as fast as that implied by Figure 2. In fact,Thomson and McIntyre[2016] argue that the tropospheric jets must be substantially subcritical, since otherwise the growth of long-wave distur-bances would proceed unhindered, in contradistinction to the strikingly straight nature of the observed jets. We note that the latitudinal potential temperature variations obtained in our conceptual model are consis-tent both with the observed zone/belt coloration on Jupiter and with the direct temperature measurements in the upper tropospheres of both planets.
The present model applies to the midlatitude jets only and in a vertical layer beneath the cloud level but still well within the tropospheric weather layer. In the tropics, the absolute vorticity profile of the equatorial jets is monotonic and no compensating thermal perturbation appears necessary. Vertical shear of the sense dis-cussed above may nevertheless exist in the tropics, as evinced by the vertical profiling of the Galileo probe, and this would imply a potential vorticity that is well below criticality at levels at and below the cloud deck. Equatorial jets may still be described within the shallow-atmosphere framework, but the strong positive prograde jets obtained byScott and Polvani[2008] appear much narrower than the observed jets, a likely consequence of the purely radiative damping mechanism used in that model.
depth of the troposphere, including the dry-convecting interior. In our conceptual model, stirring is extended upward by the action of each jet as a Rossby waveguide, allowing the effect of the convective stirring to be manifested at progressively higher levels. The deceleration of the jets with increasing altitude in the middle troposphere and upper troposphere is not explained in our model, but one possible mechanism is the deposi-tion of momentum by breaking gravity waves, these being produced by the same disturbances that act to mix potential vorticity at the top of the dry convective region. The vertical decay scale would then be determined by the amount of energy radiated as gravity waves, relative to the amount input into the balanced, potential vorticity dominated flow, as well as by details of the radiated wave spectrum. An intriguing possibility is that attenuation by nonadvective mixing associated with gravity wave breaking may explain the potential vor-ticity structures obtained bySimon-Miller et al.[2006] andRead et al.[2006, 2009] at higher levels above the cloud tops. The situation may even be analogous to that of the terrestrial upper stratosphere/mesosphere, where a barotropically unstable annulus of potential vorticity forms around the upper regions of the winter polar vortex [Dunkerton and Delisi, 1986].
Because so little is known about the structure of the Jovian and Saturnian atmospheres below the visible cloud level, we have refrained from speculating about the details of the mechanical forcing of the jets and the dynamical principles that determine the jet spacing. The manner in which the circulations depicted in Figure 1 interact with Rossby wave stirring in the deep troposphere, the possible action of the jets as Rossby waveguides, and the possible role of Hadley circulations at and below the inflection point all deserve careful attention in future work. It is hoped that new data returned by the Juno spacecraft in its polar orbit of Jupiter will, in the near future, go some way either to confirm the scenario posed here or alternatively to indicate further dynamical mechanisms that must yet be incorporated into the conceptual model.
Appendix A: Evaluation of
𝝐
From the observed zonal velocity and associated absolute vorticity,𝜁obs
a , we define a corresponding mono-tonic profile𝜁mon
a by
𝜁mon a =
( 𝜁+
a +𝜁
−
a )
∕2, (A1)
where
𝜁+
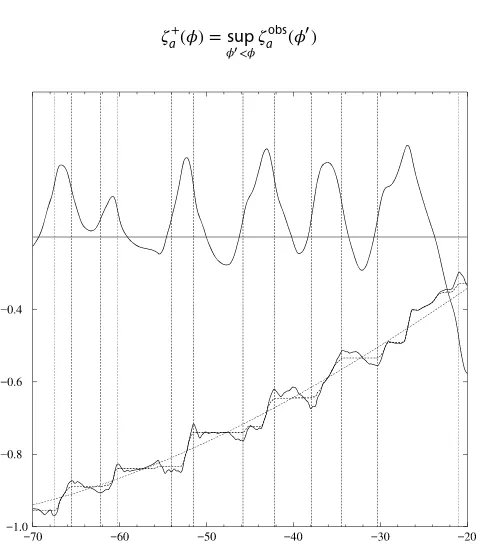
a(𝜙) =sup
𝜙′<𝜙𝜁 obs a (𝜙
[image:7.612.255.494.433.706.2]′) (A2)
Figure A1.Construction of the monotonic profile𝜁mon
a and the monotonicity parameter𝛼for the southern hemisphere midlatitudes on Jupiter:𝜁obs
a , solid;𝜁amon, dotted; andf, dotted; cloud top winds are shown in the upper part of the figure. Vertical lines denote latitudes of maximum overshoot in𝜁obs
and
𝜁−
a(𝜙) =𝜙inf′> 𝜙𝜁 obs a (𝜙
′). (A3)
While not an angular momentum preserving rearrangement of the original profile, it provides a simple means of smoothing out the overshoots appropriate to the level of approximation considered, while preserving the steep positive gradients of𝜁obs
a located in the westerly jet cores. Both quantities,𝜁 obs a and𝜁
mon
a , are reproduced in Figure A1 for a sample of the Jovian wind data. The quantity𝛼is then defined as in (7) as a measure of the departure of𝜁obs
a from monotonicity.
The quantity𝜀defined by (11) and appearing on the right-hand side of (8) involves a further derivative with respect to latitude, which is difficult to perform accurately due to the lack of sufficient smoothness. We therefore consider only the derivative averaged across entire jet regions, specifically, averaging𝛼𝜙between latitudes centred on the maximum overshoots in𝜁obs
a . In most instances such latitudes, indicated by the vertical lines in Figure A1, are well defined. Occasionally, however, the overshoots have a more complicated structure, in which cases we have estimated a suitable average value on a case-by-case basis; an example occurs at 𝜙= −54∘in Figure A1.
References
Allison, M. (2000), A similarity model for the windy Jovian thermocline,Planet. Space Sci.,48, 753–744.
Anderson, J. D., and G. Schubert (2007), Saturn’s gravitational field, internal rotation, and interior structure,Science,317, 1384–1387. Andrews, D. G., J. R. Holton, and C. B. Leovy (1987),Middle Atmosphere Dynamics, 489 pp., Academic Press, London.
Atkinson, D. H., J. B. Pollack, and A. Seiff (1998), The Galileo Probe Doppler Wind Experiment: Measurement of the deep zonal winds on Jupiter,J. Geophys. Res.,103, 22,911–22,928.
Conrath, B. J., and J. A. Pirraglia (1983), Thermal structure of Saturn from Voyager infrared measurements: Implications for atmospheric dynamics,Icarus,53, 286–292.
Dowling, T. E. (1995), Estimates of Jupiter’s deep zonal-wind profile from Shoemaker-Levy 9 data and Arnol’d’s second stability criterion,
Icarus,117, 439–442.
Dowling, T. E., and A. P. Ingersoll (1989), Jupiter’s great red spot as a shallow water system,J. Atmos. Sci.,46, 3256–3278.
Dritschel, D. G., and M. E. McIntyre (2008), Multiple jets as PV staircases: The Phillips effect and the resilience of eddy-transport barriers,
J. Atmos. Sci,65, 855–874.
Dunkerton, T. J., and D. P. Delisi (1986), Evolution of potential vorticity in the winter stratosphere of January–February 1979,J. Geophys. Res.,
91(D1), 1199–1208.
Dunkerton, T. J., and R. K. Scott (2008), A barotropic model of the angular momentum conserving potential vorticity staircase in spherical geometry,J. Atmos. Sci.,65, 1105–1136.
Flasar, F. M. (1989),Temporal Behavior of Jupiter’s Meteorology, pp. 324–343, NASA-SP-494.
Flasar, F. M., et al. (2005), Temperatures, winds and composition in the Saturnian system,Science,307, 1247–1251. Fletcher, L., et al. (2007), Characterising Saturn’s vertical temperature structure from Cassini/CIRS,Icarus,189, 457–478.
Gierasch, P. J., B. J. Conrath, and J. A. Magalhães (1986), Zonal mean properties of Jupiter’s upper troposphere from Voyager infrared observations,Icarus,67, 456–483.
Holton, J. R., P. H. Haynes, M. E. McIntyre, A. R. Douglass, R. B. Rood, and L. Pfister (1995), Stratosphere-troposphere exchange,Revs. Geophys.,
33, 403–439.
Ingersoll, A. P., and C. C. Porco (1978), Solar heating and internal heat flow on Jupiter,Icarus,35, 27–43.
Ingersoll, A. P., R. F. Beebe, J. L. Mitchell, G. W. Garneau, G. M. Yagi, and J.-P. Müller (1981), Interaction of eddies and mean zonal flow on Jupiter as inferred from Voyager 1 and 2 images,J. Geophys. Res.,86, 8733–8743.
Ingersoll, A. P., T. E. Dowling, P. J. Gierasch, G. S. Orton, P. L. Read, A. Sánchez-Lavega, A. P. Showman, A. A. Simon-Miller, and A. R. Vasavada (2004),Dynamics of Jupiter’s Atmosphere, chap. 6, Cambridge Univ. Press, Cambridge, U. K.
Kuo, H. L. (1949), Dynamic instability of two-dimensional, non-divergent flow in a barotropic atmosphere,J. Atmos. Sci.,6, 105–122. Lian, Y., and A. Showman (2008), Deep jets on gas giant planets,Icarus,194, 597–615.
Liu, J., T. Schneider, and Y. Kaspi (2013), Predictions of thermal and gravitational signals of Jupiter’s deep zonal winds,Icarus,244, 114–125. Marcus, P. S., and S. Shetty (2011), Jupiter’s zonal winds: Are they bands of homogenized potential vorticity organized as a monotonic
staircase?,Philos. Trans. R. Soc. A,369, 771–795.
McIntyre, M. E. (1982), How well do we understand the dynamics of stratospheric warmings?,J. Meteorol. Soc. Japan,60, 37–65. Orsolini, Y., and C. B. Leovy (1993), A model of large-scale instabilities in the Jovian troposphere. 1. Linear model,Icarus,106, 392–405. Porco, C. C., et al. (2003), Cassini imaging of Jupiter’s atmosphere, satellites and rings,Science,299, 1541–1547.
Read, P. L., P. J. Gierasch, B. J. Conrath, A. A. Simon-Miller, T. Fouchet, and Y. H. Yamazaki (2006), Mapping potential vorticity dynamics on Jupiter, I: Zonal-mean circulation from Cassini and Voyager 1 data,Q. J. R. Meteorol. Soc.,132, 1577–1603.
Read, P. L., B. J. Conrath, L. N. Fletcher, P. J. Gierasch, A. A. Simon-Miller, and L. C. Zuchowski (2009), Mapping potential vorticity dynamics on Saturn: Zonal mean circulation from Cassini and Voyager data,Planet. Space Sci.,57, 1682–1698.
Sánchez-Lavega, A., R. Hueso, and S. Pérez-Hoyos (2007), The three-dimensional structure of Saturn’s equatorial jet at cloud level,
Icarus,187, 510–519.
Scott, R. K., and D. G. Dritschel (2012), The structure of zonal jets in geostrophic turbulence,J. Fluid Mech.,711, 576–598. Scott, R. K., and L. M. Polvani (2008), Equatorial superrotation in shallow atmospheres,Geophys. Res. Lett.,35, L24202,
doi:10.1029/2008GL036060.
Scott, R. K., and A.-S. Tissier (2012), The generation of zonal jets by large-scale mixing,Phys. Fluids,24, 126601.
Shetty, S., X. S. Asay-Davis, and P. S. Marcus (2007), On the interaction of Jupiter’s great red spot and zonal jet streams,J. Atmos. Sci.,64, 4432–4444.
Acknowledgments
Simon-Miller, A. A., B. J. Conrath, P. J. Gierasch, G. S. Orton, R. K. Achterberg, F. M. Flasar, and B. M. Fisher (2006), Jupiter’s atmospheric temperatures: From Voyager IRIS to Cassini CIRS,Icarus,180, 98–112.
Sugiyama, K., M. Odaka, K. Kuramoto, and Y.-Y. Hayashi (2006), Static stability of the Jovian atmospheres estimated from moist adiabatic profiles,Geophys. Res. Lett.,33, L03201, doi:10.1029/2005GL024554.
Thomson, S. I., and M. E. McIntyre (2016), Jupiter’s unearthly jets: A new turbulent model exhibiting statistical steadiness without large-scale dissipation,J. Atmos. Sci.,73, 1119–1141.

![Figure 2. Read et al., 2006].A similar vertical structure was obtained from Cassini observations of Saturn [than the value obtained in section 2 above, but the difference is consistent with our construction, whichplaces the inflection point in the vertical p](https://thumb-us.123doks.com/thumbv2/123dok_us/9000061.396808/5.612.176.416.89.462/structure-observations-obtained-dierence-consistent-construction-whichplaces-inection.webp)