This is an Accepted Manuscript, which has been through the
Royal Society of Chemistry peer review process and has been
accepted for publication.
Accepted Manuscripts are published online shortly after
acceptance, before technical editing, formatting and proof reading.
Using this free service, authors can make their results available
to the community, in citable form, before we publish the edited
article. We will replace this Accepted Manuscript with the edited
and formatted Advance Article as soon as it is available.
You can find more information about Accepted Manuscripts in the
author guidelines
.
Please note that technical editing may introduce minor changes
to the text and/or graphics, which may alter content. The journal’s
standard
Terms & Conditions
and the ethical guidelines, outlined
in our
author and reviewer resource centre
, still apply. In no
event shall the Royal Society of Chemistry be held responsible
for any errors or omissions in this Accepted Manuscript or any
consequences arising from the use of any information it contains.
Accepted Manuscript
PCCP
Physical Chemistry Chemical Physics www.rsc.org/pccp
ISSN 1463-9076
PERSPECTIVE Darya Radziuk and Helmuth Möhwald Ultrasonically treated liquid interfaces for progress in cleaning and separation processes
Volume 18 Number 1 7 January 2016 Pages 1–636
PCCP
Physical Chemistry Chemical Physics
PCCP
ARTICLE
a.EaStCHEM School of Chemistry, University of St Andrews, North Haugh, St
Andrews KY16 9ST, United Kingdom. Fax: +441334 463808. Tel.: 441334 463800. E-mail: mb45@st-andrews.ac.uk.
b.Diamond Light Source Ltd, Didcot OX11 0DE, United Kingdom.
c.Department of Chemical and Process Engineering, University of Strathclyde,
James Weir Building, 75 Montrose Street, Glasgow G1 1XJ, United Kingdom.
† present addresses: N.M.: CNM Technologies GmbH, Herforder Strasse 155a, 33609 Bielefeld, Germany
Electronic Supplementary Information (ESI) available: [details of any supplementary information available should be included here]. See DOI: 10.1039/x0xx00000x
Received 00th January 20xx, Accepted 00th January 20xx
DOI: 10.1039/x0xx00000x
www.rsc.org/
Underpotential Deposition of Cu on Au(111) from Neutral
Chloride Containing Electrolyte
Hannah Aitchisona, Nikolaus Meyerbrökera†, Tien-Lin Leeb, Jörg Zegenhagenb, Thomas Pottera, Herbert Früchtla, Izabela Cebulac, Manfred Buck*a
The structure of a chloride terminated copper monolayer electrodeposited onto Au(111) from a CuSO4/KCl electrolyte was
investigated ex situ by three complementary experimental techniques (scanning tunneling microscopy (STM), photoelectron spectroscopy (PES), X-ray standing wave (XSW) excitation) and density functional theory (DFT) calculations. STM at atomic resolution reveals a stable, highly ordered layer which exhibits a Moiré structure and is described by a (5×5) unit cell. The XSW/PES data yield a well-defined position of the Cu layer and the value of 2.16 Å above the topmost Au layer suggests that the atoms are adsorbed in threefold hollow sites. The chloride exhibits some distribution around a distance of 3.77 Å in agreement with the observed Moiré pattern due to a higher order commensurate lattice. This structure, a high order commensurate Cl overlayer on top of a commensurate (1×1) Cu layer with Cu at threefold hollow sites, is corroborated by the DFT calculations.
Introduction
Deposition of a metal on a foreign metal substrate positive of the Nernst potential is a well-studied phenomenon in electrochemistry1-12 owing to its relevance to a diversity of
areas, ranging from the growth of thin metal films4 to
electroanalytical applications.13,14 Providing simple means of surface modification, underpotential deposition (UPD) has also been harnessed for the formation of self-assembled monolayers,15-19 and the intrinsic limitation to one or two atomic layers makes the UPD process attractive for processing on the nanoscale as exemplified by the growth of layers exploiting surface limited redox replacement (SLRR),20-22 the
formation of nanostructures,23,24 the tailoring of
electrocatalysts,22,25,26or the modification of nanoparticles.27,28 Among the numerous UPD systems,1Cu on metals such as Au, Ag, Pt, and Pd has been a focus of studies29-48with new aspects in regard to the intricate relationship between structures and deposition conditions continuing to be uncovered.12Numerous studies have established the crucial role of the anion in the
formation and structure of the UPD layer10,12,32,34,38,48-60which is highlighted by the stabilising effects of the sulfate anion on
the (√3×√3)R30° honeycomb structure57 and the
commensurate (1×1) structure of Cu on Au(111),10 or the
transition of a Cu-UPD layer on Au(111) from a (√3 x √3)R30° to
a (5×5) structure upon the exchange of the sulfate by chloride.31,37,38,50,61-64 Notably, Cu-UPD has overwhelmingly
been studied at pH ≤ 1 whereas studies employing less acidic
conditions43,48,65,66or even neutral pH67,68are rather scarce. Here we present the structural characterisation of a Cu-UPD layer on Au(111) prepared from a neutral chloride containing solution. Investigating UPD of Cu from neutral media is motivated by our interest in the combination of metal
deposition and molecular assemblies23,69,70 with
two-dimensional supramolecular assemblies, on the one hand, affording templating on the sub-5 nm scale, but, on the other hand, exhibiting limited stability in an acidic environment. The choice of chloride was guided by the idea that this anion adsorbs more strongly than sulfate and, thus, it can be expected that the highly ordered structures observed under acidic conditions persist at higher pH, in contrast to sulfate for
which we observed a loss of the well-defined (√3x√3)R30°
honeycomb structure upon increase of pH. Complementary techniques were applied comprising STM which provides lateral resolution on the atomic scale, XSW/PES as chemically specific and very precise structural tool to determine atomic positions (along the surface normal in this work), and DFT as an independent method to substantiate any structural model
derived from the experiments.
Physical
Chemistry
Chemical
Physics
Accepted
Manuscript
Published on 15 August 2017. Downloaded by University of St Andrews Library on 18/08/2017 10:11:43.
ARTICLE Journal Name
Results and discussion
Cyclic voltammetry (CV):Noting that the work was aimed at establishing a simple robust protocol for the preparation of a structurally well-defined UPD layer, all experiments were performed under ambient conditions using non-purged electrolyte solutions. The CVs of Cu-UPD at neutral pH as exemplified in Figure 1., parallel those of Cu deposition from acidic solution31,48,62,64 with features, like at low pH, varying with chloride concentration. Since the structural quality of the substrate, i.e., terrace width and step density, also plays a role, additional sample to sample variations were seen in our experiments using flame annealed Au/mica substrates. However, these variations in the CVs did not affect the structure observed in STM.
The most prominent feature is the peak pair A/A’ which, in an acidic environment, has been identified with a transition between a disordered phase and a (5×5) Cu-UPD overlayer structure. The exact dimensions of the ordered structure have
been reported to be potential dependent with a slight
compression seen in STM images when moving in the cathodic direction.31,64 Within the range of chloride concentrations examined (10 mM to 0.05 mM), the potential difference of peaks A and A’ widens from 20 mV at high concentration (Figure 1) to about 60 mV at low concentration with, in addition, a broadening of peak A. The structural quality of the substrate also affects the shape of the peaks up to the point where peak A’ exhibits a shoulder or even a second peak.
Fig. 1CV of Cu-UPD on Au(111)/mica in 2.5 mM CuSO4(aq) + 0.5 mM KCl recorded at a
scan rate of 10 mV s-1. Scan was started at 500 mV to the cathodic direction.
While the pair of peaks A/A’ is a characteristic feature of the system, irrespective of the structural details of the substrate and the chloride concentrations, we observed that the region negative of 150 mV, like for acidic pH, exhibits pronounced
variations as a function of chloride concentration.
Furthermore, it varied significantly from sample to sample which suggests that the surface quality, i.e., steps and terrace width, significantly affects the kinetics of the UPD process. Since our work focused on the investigation of the structure
associated with peak A, no systematic investigation of the region cathodic of 150 mV was performed. Therefore, we are unable to clearly correlate any specific feature in this region with structural transitions and chloride adsorption/desorption as done in studies at low pH.31,62,64Phenomenologically, peaks B/B’, which vary in intensity from clearly discernible to vanishingly small, are in the potential range where phase transitions occur62,64 and peak C is located in the region identified with chloride desorption.31,62Notably, with regard to the latter we did not observe a corresponding anodic peak which under acidic conditions indicates the readsorption of chloride.62,71
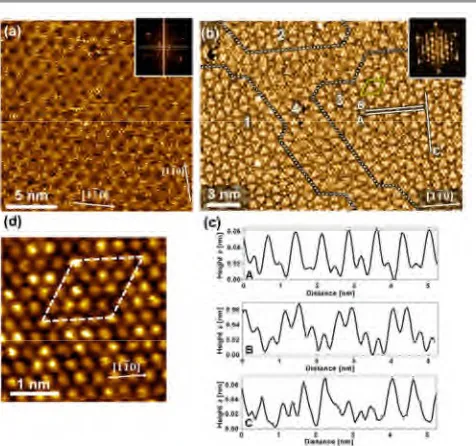
Fig. 2STM images of a CuCl-UPD layer on Au(111)/mica deposited from a neutral CuSO4/KCl solution at 200 mV (vs. Cu/Cu2+). (a,b) Images illustrating different tunnelling
contrast at identical tunneling conditions (U = 0.5 V, I = 0.03 nA). Inserts show Fourier transform. Second insert in (a) shows Moiré pattern in the vicinity of a step. Area 4 within dotted lines in (b) denotes boundary region between ordered domains 1-3. Yellow diamond indicates unit cell c) Height profiles along the lines shown in (b). (d) High resolution image (U = 0.3 V, I = 0.07 nA) of the UPD-layer. The dimension of the
rhombohedral unit cell of the UPD layer is a = b = 14.5 ± 0.3 Å and γ = 60°.
STM: Anticipating from the similarity of the CVs acquired at acidic and neutral pH that for the latter an ordered layer is also formed at potentials cathodic of peak A, UPD-layers deposited at 200 mV were investigated in ambient atmosphere by microscopy. The results are presented in Fig. 2. Not uncommon for STM in this environment, a substantial variation in the tunneling contrast and resolution due to tip effects is observed with images ranging from highlighting Moiré patterns (Fig. 2a) as known from in situ studies under acidic conditions38,64to atomically resolved images like the one depicted in Fig. 2b. The latter reveal distinct differences in the height of individual protrusions which, as further substantiated below, represent chlorine atoms. The orientation of the Moiré pattern along the 110 direction is inferred from the insert
in Fig. 2a which shows the structure on a larger scale next to a step parallel to the 110 direction. The high resolution
image of Fig. 2b as well as its Fourier transform reveal a
Physical
Chemistry
Chemical
Physics
Accepted
Manuscript
Published on 15 August 2017. Downloaded by University of St Andrews Library on 18/08/2017 10:11:43.
[image:3.595.306.544.229.452.2] [image:3.595.49.287.404.593.2]hexagonal packing of the chlorine atoms, which are aligned along the 110 direction and are separated by 3.6 ± 0.1 Å.
Domains can be identified (areas labelled 1-3) which are characterised by a distinct periodic pattern. These are separated by domain boundaries (area 4) where, over a distance of typically 2-3 unit cells, a less regular variation of the apparent height of the atoms indicate a break in translational symmetry. The line profiles shown in Fig. 2c illustrate a substantial variation in the height of the protrusions. Values are around 0.4-0.5 Å which is in the range of 0.5-1.2 Å reported for acidic environment.31,62,64 The unit cell of this adlayer structure is highlighted in the high resolution image of Figure 2d. A rhombohedral arrangement
with a = b = 14.5 ± 0.3 Å and γ = 60 ± 2° was found, which
corresponds to a (5×5) unit cell with respect to the in-plane lattice constant (2.88 Å) of the Au(111) surface. This value is at the lower end of the reported values between 14.4 Å and 15.6 Å. With regard to the exact dimensions of the unit cell of the higher order commensurate layer, there are reports that they either do not change,62 or decrease31,61,64 towards more cathodic potentials. The well-defined pattern and very regular height variations as seen in Fig. 2b suggest that the Cu/Cl-UPD structure is in registry with the substrate lattice and of the same dimension as the (5×5) unit cell observed in situin acidic media.31,38,61-64 However, imaging the chloride layer STM cannot provide insight into which of the two structures discussed by Hotloset al. is realised:62a (1×1) commensurate Cu layer with a locally incommensurate, densely packed (5×5)
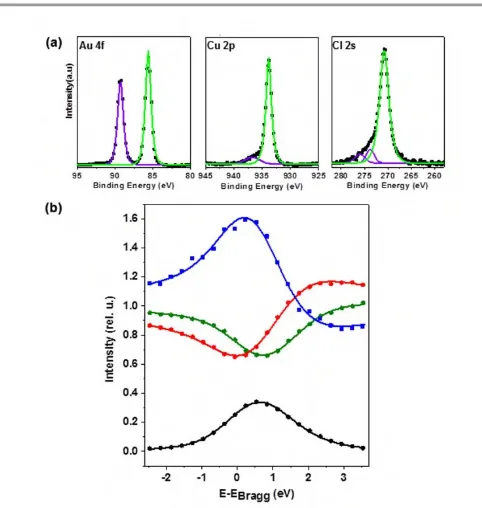
Fig. 3. a) XP spectra of chloride terminated Cu-UPD layer on Au(111) recorded with a photon energy of 2.642 keV for Au 4f, Cu 2p, and Cl 2s. (b) XSW profiles for Au 4f7/2 (red), Cu 2p3/2 (green) and Cl 2s (blue) from the UPD-Cu layer together with reflectivity curve (black). Filled circles and solid lines represent experimental data and least square fits to the profiles. XSW data were recorded over the range of 2.6415 keV – 2.6475 keV in increments of 300 meV for all species. Error bars are of the size of the symbols or smaller.
Cl layer adsorbed on top (model I) or both Cu and Cl forming the high order commensurate (5×5) lattice (model II).
XSW: The XSW data (scatter plots) and fitted profiles (solid lines) for Au 4f7/2, Cu 2p3/2 and Cl 2s in the UPD-(5×5) Cu/Au(111) single crystal sample are provided in Figure 3, along with the photoelectron spectra for each individual species. From the energy dependent XSW/PES data recorded over a range of 6 eV around the Au(111) Bragg peak, the coherent position P and fraction Fof adsorbate atoms were determined as outlined in the experimental section. The values of the coherent position P are converted into the real space distance dz by multiplication with the Au(111) lattice plane
spacing,70i.e.dz=P × 2.36 Å. Values for Pand the coherent
fractionF, which is a measure for the distribution around this main position,72are compiled in Table 1. For Au the value of 0.83 for the coherent fraction is close to unity which means that in the surface region most Au atoms occupy Au bulk lattice sites. A theoretical value of close to unity for an ideal crystal may be prevented by some surface disorder and relaxation. Indeed, the value of P= -0.04 may indicate a slight inward relaxation of the outermost Au atoms. The Fvalue of 0.81 for Cu is comparable to the one of Au and, therefore, the copper atoms are located in a well defined plane at a distance of 2.07 Å above the (bulk terminated) Au surface plane. Note that distances are determined by P modulo 1 because of the periodic nature of the wavefield planes. Since the chloride is located above the Cu layer40,62thePvalue of 0.56 corresponds to a value of 3.68 Å above the Au(111) surface plane. Compared to Cu and Au, the coherent fraction of the chloride is pronouncedly smaller, which suggests that Cl exhibits a substantially wider distribution normal to the surface, i.e. along the z-coordinate.
The position of Cu relative to Au is perfectly compatible with a pseudomorphic Cu layer, that is, the Cu atoms are in registry with the substrate and located in fcc threefold hollow sites.
Au 4f7/2 Cu 2p3/2 Cl 2s
P
XSW -0.038 ± 0.01 0.877 ± 0.01 0.56 ± 0.06
DFT I
II
0.886 0.556 0.92 0.354
F
XSW 0.827 ± 0.01 0.807 ± 0.01 0.45 ± 0.06
DFT
I 0.995 0.952 II 0.873 0.861
dz(Å) 2.270 ± 0.02 4.430 ± 0.02 6.04 ± 0.14
[image:4.595.43.284.419.673.2]dz(Å) 0 2.16 3.77
Table 1.Coherent position (P), coherent fraction (F) and vertical atom positionsdzof
the chloride terminated UPD-Cu layer on Au(111). XSW refers to experimental values, DFT to values derived from calculations of two different structural models, Au50Cu25Cl16
(I) and Au50Cu16Cl16(II) detailed in text. Values ofdzare calculated using the Au lattice
spacing of 2.36 Å.
Physical
Chemistry
Chemical
Physics
Accepted
Manuscript
Published on 15 August 2017. Downloaded by University of St Andrews Library on 18/08/2017 10:11:43.
[image:4.595.307.550.505.682.2]ARTICLE Journal Name
A calculation of the Au-Cu distance from the XSW data yields 2.73 Å which compares well to the 2.72 Å calculated from the sum of atomic radii of Au (1.445 Å) and Cu (1.275 Å). The well-defined position of the Cu atoms is also in line with the high value of F. In contrast, the much lower coherent fraction of 0.45 for the chloride anions reflects some vertical distribution of positions as a consequence of the lack of simple commensurability. Thus, the XSW data favour model I, where the Cu atoms occupy fcc sites and arrange in a (1×1) lattice, and the Cl form the top layer which lacks simple registry with the underlying metal. According to this interpretation it is the structure of the chloride layer seen by STM.
DFT calculations:To further substantiate the model concluded from the STM and XSW data, two structures, that have been discussed in the literature,31,37,62,73 were investigated computationally. The first one (model I) reflects the XSW and STM results and consists of a slab of two layers of Au atoms, a pseudomorphic (1×1) Cu layer, and a higher order commensurate Cl layer exhibiting a (5×5) unit cell. Its stoichiometry is Au50Cu25Cl16. The second structure (model II) has a stoichiometry of Au50Cu16Cl16and is characterised by the Cu and Cl jointly forming a locally incommensurate (5×5) superstructure. To elucidate which structure is more stable, the formation energy of slabs with the composition AuxCuyClz was calculated based on the following reaction:
x Au + y Cu + z/2 Cl2 → AuxCuyClz
This model reaction shows the hypothetical formation of the slab from bulk Au, bulk Cu and gas-phase Cl2, and gives the
formation energy as: = − − − /2 2.Eform
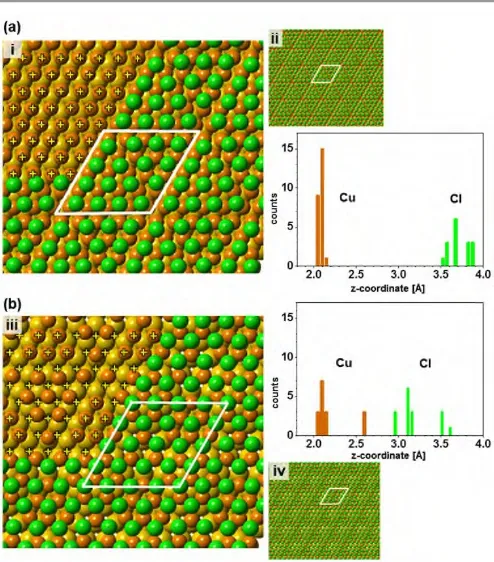
for Au50Cu25Cl16is lower by 0. 523 V thanEformof Au50Cu16Cl16, therefore, favouring the former as the more stable structure. Both energy minimised structures are presented in Fig. 4 together with histograms of the z-coordinates of the atoms. As seen from the detailed models (charts i and iii), the Cl atoms exhibit an essentially hexagonal arrangement in both cases. Thus, both structures are compatible with the STM image and the respective Fourier transform shown in Fig. 2b. It is noted that the triangular features discernible in charts ii and iv of Fig. 4 resemble patterns seen in a number of STM
studies.37,38,62 Owing to the different numbers, the
arrangements of the Cu atoms are distinctly different for the two structures as seen from the areas of charts i and iii where the Cl atoms are omitted. For model I the Cu atoms are essentially located in fcc sites (marked by +signs), i.e., the Cu layer is pseudomorphic with the Au substrate. In contrast, for model II there is a pronounced variation in adsorption sites with positions including fcc, hcp, and even close to on-top sites.
The histograms of the z-positions of the Cu and Cl atoms, shown in Fig. 4, reveal pronounced differences between the two structures. Firstly, Au50Cu25Cl16 has a very narrow z-distribution of Cu (zCu= 0.1 Å) and a wider distribution of Cl (zCl = 0.34 Å) whereas for Au50Cu16Cl16both atom types are scattered over a significantly larger range (zCu= 0.55 Å,zCl=
[image:5.595.306.553.253.534.2]0.64 Å). The interpretation is that, in model I, the Cu atoms occupy threefold hollow sites and, thus, are in registry with the Au substrate, whereas the Cl positions vary from threefold hollow sites to more bridge or even close to on top sites. Model II yields larger variations in the z-position for both type of atoms as neither the Cu nor the Cl atoms match the periodicity of the Au substrate. Secondly, the z-positions of the chlorine atoms are rather different for the two structures. The average z-position is 1.01 Å above the Cu for Au50Cu16Cl16, which is substantially lower than the 1.59 Å for Au50Cu25Cl16. This can be rationalised by simple geometrical reasoning as the larger average spacing between the Cu atoms in model II compared to model I, allows the Cl atoms, which are positioned between the Cu atoms, to move closer to the Au substrate.
Fig. 4.Models and (5×5) unit cells of the calculated structures of Au50Cu25Cl16(a) and
Au50Cu16Cl16(b), and respective histograms of the atom distributions along the surface
normal (Cu brown, Cl green). Yellow crosses in charts i and iii mark fcc positions in areas where Cl atoms have been omitted for clarity. z-coordinate in histograms is relative to the topmost Au layer, bin size is 0.05 Å. For details see text.
The differences in the positions of the Cu and Cl atoms between model I and II should also be reflected in the respective values of the coherent position P and coherent fraction F, which are calculated from the z-coordinates as described previously72and compiled in Table 1. As seen there is a close agreement between model I and the XSW data for P of both Cu and Cl, whereas model II yields substantially different values, too high for Cu and too low for Cl. Regarding the values of the coherent fraction, the agreement between DFT and the experimental data is less close. However, one should keep in mind that the models represent idealised structures. As the high resolution STM image of Fig. 2b
Physical
Chemistry
Chemical
Physics
Accepted
Manuscript
Published on 15 August 2017. Downloaded by University of St Andrews Library on 18/08/2017 10:11:43.
illustrates, the UPD appears to exhibit a substantial variation in the apparent height. While caution is required to interpret this STM determined height as geometrical height, it is conceivable that variations in the z-coordinate are larger than the model implies. Furthermore, as seen from Fig. 2b, domains with a perfectly ordered structure are separated by extended domain boundaries where the distinct pattern fades and the associated breaking of the translational symmetry could give rise to additional variations in the atomic positions which in turn might affect the coherent fraction.
Summarising the structural analysis, both XSW and DFT calculations support the structural model where Cu forms a layer which is commensurate with the Au(111) surface and the Cl atoms form the (5x5) overlayer seen by STM.
Contrasting Cu-UPD on Pt(111), for which numerous studies exist with more recent work concluding an incommensurate Cl layer on top of a commensurate (1x1) Cu layer instead of an incommensurate CuCl layer described by a zincblende structure,42,74,75 analogous studies for Au(111) are less frequent. While all structural studies were performed under acidic conditions, no conclusive picture has emerged yet. Some studies combining STM studies with information obtained from cyclic voltammetry and XPS data favour the incommensurate CuCl structure over the commensurate Cu layer.31,37,62,63 This is contrasted by a study using X-ray absorption spectroscopy (XAS) which finds that neither the zincblende structure nor the commensurate layer give satisfactory agreement with the experimental data.40The XAS data rule out a narrow distribution of bond distances including the Cu–Cl bond which is not consistent with the models concluded from the STM studies. Suggesting a significant degree of static disorder, the authors surmise that the Cu atoms could be shifted from high symmetry positions. This is indeed observed in the calculation of model II where the zincblende structure is the starting point and the final structure exhibits significant displacements of the Cu atoms, not only vertically but also in the surface plane. However, since both calculation and experimental data favour the commensurate (1×1) Cu overlayer (model I) in the present case, the question arises whether, depending on conditions, different structures could be realised.
One point is that, in contrast to the in situstudies in acidic media, the present study was carried out ex situ. This could explain differences in the contrast variation in the atomically resolved images of the (5×5) structure of this work (Fig. 2b) and those reported in the literature.31,37,38,61,62,64In the latter case the geometry can be described by unidirectionally oriented triangles with a more gradually varying contrast whereas the structure seen in Fig. 2b exhibits pronounced changes between adjacent atoms. However, a change as distinct as the transition of the Cu layer from an incommensurate to a commensurate structure just by a change of environment seems unlikely, given the fact that Cl forms an incommensurate layer on Cu(111).76 Furthermore, there is no indication from Cu-UPD from sulfuric acid that
changing the environment alters the adsorbate
structure.19,49,77 Another point is the chloride concentration.
However, an influence of the anion concentration is dismissed since, within the range covered in our experiments which varied between 0.05 mM and 10 mM, the same structure was observed by STM. Finally, the third and most obvious point is the difference in the pH value. Based on studies of anions on Au(111), which found a decisive influence of the pH on the adsorbate structure78 and of the solvent molecules on the
screening of surface dipoles,79 it seems reasonable to
speculate that the concentration of hydronium ions can also affect the Cu-UPD process through its influence on the chloride adsorbed on the gold prior to the Cu deposition. To substantiate this further, more detailed studies will be required.
Experimental
CuSO4⋅5H2O (99.999%, Sigma Aldrich), KCl (≥99.5%, Fluka), and
ethanol (AnalaR Normapur) were used as purchased. Au substrates (300 nm epitaxial Au(111) layer on mica wafer, Georg Albert PVD, Heidelberg, Germany) were annealed using a natural gas flame before use. For the XSW experiments Au(111) single crystals (MaTeck and Surface Preparation Lab) were used.
UPD. For deposition of a monolayer of copper with an
associated chloride anion, Au/mica (for STM experiments) or Au(111) single crystal (for XSW experiments) are immersed in aquous solution of CuSO4 + KCl(aq) (typical ratio 5:1 and KCl concentrations ranging from 0.5 to 0.05 mM) and a potential of 200 mV (vs. Cu/Cu2+) is applied for 1 minute. Prior to underpotential deposition of Cu, a cyclic voltammogram is recorded with a scan rate of 20 mV s-1in the range of 0.40 V to 0.00 V with a 5 second conditioning time at 0.4 V.
Characterisation. Samples were characterised at room
temperature by scanning tunneling microscopy (STM) and by the X-ray standing wave (XSW) technique.
STM. STM measurements were performed under ambient
pressure using a Molecular Imaging PicoSPM system with Picoscan Version 5.3.3 software. Tips were mechanically cut using wire cutters from platinum: iridium 80:20 wire (Advent Research Materials, 0.25 mm diameter, temper hard). Typical scanning parameters in constant current mode were 0.300 – 0.500 V for the tip bias (U) and 0.01– 0.1 nA for the tunneling current. We note that images were not dependent on current in the range examined which was up to 500 pA and which overlaps with the range of current values usedin situstudies.64
Images were evaluated using PicoScan V5.3.3 and WSxM80
software.
XSW. Experiments were carried out at beam line I09 at
Diamond Light Source in Oxfordshire. Samples were prepared on Au(111) single crystals under ambient conditions on site before being transferred to vacuum chamber for analysis. Au crystals were cleaned by flame annealing prior to use before UPD of Cu. No beam damage of the organic layers were
Physical
Chemistry
Chemical
Physics
Accepted
Manuscript
Published on 15 August 2017. Downloaded by University of St Andrews Library on 18/08/2017 10:11:43.
ARTICLE Journal Name
noticed when comparing photoelectron spectra before and after XSW measurements.
XSW data were taken around the Au(111) reflection at a Bragg angle close to 90° by scanning the photon energy from 2.6415 keV – 2.6475 keV in increments of 300 meV. Au 4f spectra were fitted by one component for each peak using a Gaussian/Lorentz (GL) ratio of 80. For Cu 2ptwo components were fitted to describe the large peak (GL = 90)) and the small shoulder (GL = 30). For the XSW analysis the integral of the large peak was used. In the case of the Cl 2sthree components were fitted with two describing the rather broad shoulder. Only the integral of the main peak was used for the XSW plots. Element specific absorption profiles were generated for chemically distinct atoms by plotting the background-subtracted core-level spectra against photon energy. Peak fitting and background subtraction were performed using CasaXPS software. A Scilab script written by Tien-Lin Lee at Diamond was used to plot the processed data, apply non-dipolar corrections81and extract values for coherent fraction and position, F and P, respectively for each measurement following well established procedures.72,82
DFT.Calculations were carried out using the VASP program, 83-85The PBE86functional, with D3-BJ87dispersion correction to
take into account van der Waals interactions, was used, along with a plane wave basis set with an energy cut-off of 400 eV. Projector augmented wave (PAW)88 pseudopotentials89 were used to model the core electrons more efficiently.
For bulk Au the atomic positions within the unit cell were fixed, and the unit cell parameters were optimised. For the calculations of the CuCl structures the atomic positions of the 2 Au layers were fixed; all other atoms were allowed to move freely during the optimisation.
Starting structures were a Cu layer with atoms in fcc sites and a hexagonal (5×5) Cl overlayer (model I) and a (5×5) Cu layer with Cl sitting in threefold hollow sites of the Cu layer (model II).
Conclusions
Combining different techniques we have established that a structurally well defined Cu-UPD layer can be generated using an aqueous, chloride containing neutral electrolyte. The milder preparation condition compared to the normally used acidic environment and its stability in ambient atmosphere opens the perspective to harness Cu-UPD for the generation of precise
nanostructures through templated deposition using
supramolecular networks.
Both standing wave and computational data favour the structural model where an incommensurate (5×5) Cl layer seen by STM is adsorbed on top of a (1×1) commensurate layer of Cu. Thus, it contrasts studies on Cu-UPD in an acidic environment which conclude either an incommensurate (5x5) CuCl adlayer structure31,62or a structure exhibiting significant disorder40. Thus adding to the puzzle of Cu-UPD in chloride containing electrolytes, this calls for a detailed comparative study which fully assesses the adsorbate system through a combination of structurally sensitive techniques.
Conflict of interest
There are no conflicts of interest to declare.
Acknowledgements
We thank the EaStCHEM Research Computing facility for computational support. Support by the Leverhulme Trust (RGP-2013-177) and EPSRC via a doctoral training grant (H.A.) is gratefully acknowledged. We acknowledge Diamond Light Source for time on beamline I09 under proposal SI9202.
Notes and references
1. E. Herrero, L. J. Buller and H. D. Abruna,Chem. Rev., 2001,101, 1897-1930.
2. L. B. Rogers, D. P. Krause, J. C. Griess and D. B. Ehrlinger, J. Electrochem. Soc., 1949,95, 33-46.
3. K. Uosaki, J. Morita, T. Katsuzaki, S. Takakusagi, K. Tamura, M. Takahasi, J. i. Mizuki and T. Kondo,J. Phys. Chem. C, 2011,115, 12471-12482.
4. W. J. Lorenz and G. Staikov,Surf. Sci., 1995,335, 32-43.
5. G. Staikov, ed.,Electrocrystallisation in Nanotechnology, Wiley-VCH, Weinheim, 2007.
6. E. Budevski, G. Staikov and W. J. Lorenz, Electrochim. Acta, 2000,45, 2559-2574.
7. O. A. Oviedo, C. E. Mayer, G. Staikov, E. P. M. Leiva and W. J. Lorenz,Surf. Sci., 2006,600, 4475-4483.
8. E. Budevski, G. Staikov and W. J. Lorenz,Electrochemical Phase Formation and Growth, VCH, Weinheim, 1996.
9. S. Frittmann, V. Halka and R. Schuster,Angew. Chem. Int. Ed., 2016,55, 4688-4691.
10. P. Velez, A. Cuesta, E. P. M. Leiva and V. A. Macagno, Electrochem. Commun., 2012,25, 54-57.
11. O. A. Oviedo, L. Reinaudi and E. P. M. Leiva, Electrochem. Commun., 2012,21, 14-17.
12. B. Madry, K. Wandelt and M. Nowicki,Electrochim. Acta, 2016,
217, 249-261.
13. P. Salaün and C. M. G. van den Berg, Anal. Chem., 2006,78, 5052-5060.
14. V. Beni, H. V. Newton, D. W. M. Arrigan, M. Hill, W. A. Lane and A. Mathewson,Anal. Chim. Acta, 2004,502, 195-206.
15. G. K. Jennings and P. E. Laibinis,J. Am. Chem. Soc., 1997,119, 5208-5214.
16. G. K. Jennings and P. E. Laibinis,Langmuir, 1996,12, 6173-6175. 17. H. Aitchison, H. Lu, S. W. L. Hogan, H. Früchtl, I. Cebula, M.
Zharnikov and M. Buck,Langmuir, 2016,32, 9397-9409. 18. I. Cebula, H. Lu, M. Zharnikov and M. Buck,Chem. Sci., 2013,4,
4455 - 4464.
19. I. Cebula, C. Shen and M. Buck,Angew. Chem. Int. Ed., 2010,49, 6220-6223.
20. S. R. Brankovic, J. X. Wang and R. R. Adžić, Surf. Sci., 2001,474,
L173-L179.
21. X. J. Yan, H. Y. Xiong, Q. G. Bai, J. Frenzel, C. H. Si, X. T. Chen, G. Eggeler and Z. H. Zhang,RSC Advances, 2015,5, 19409-19417. 22. T. Yang, G. J. Cao, O. L. Huang, Y. X. Ma, S. Wan, H. Zhao, N. Li,
X. Sun and F. J. Yint,Acs Applied Materials & Interfaces, 2015,7, 17162-17170.
23. C. Shen and M. Buck,Beilst. J. Nanotechnol., 2014,5, 258-267.
Physical
Chemistry
Chemical
Physics
Accepted
Manuscript
Published on 15 August 2017. Downloaded by University of St Andrews Library on 18/08/2017 10:11:43.
24. D. F. Liang, P. Rajput, J. Zegenhagen and G. Zangari, ChemElectroChem, 2014,1, 787-792.
25. F. Calle-Vallejo, M. T. M. Koper and A. S. Bandarenka,Chem. Soc. Rev., 2013,42, 5210-5230.
26. L. Zhang, S. I. Choi, J. Tao, H. C. Peng, S. F. Xie, Y. M. Zhu, Z. X. Xie and Y. N. Xia,Adv. Funct. Mater., 2014,24, 7520-7529. 27. A. Kumar and D. A. Buttry,J. Phys. Chem. C, 2015,119,
16927-16933.
28. S. Park, P. Yang, P. Corredor and M. J. Weaver, J. Am. Chem. Soc., 2002,124, 2428-2429.
29. O. R. Melroy, M. G. Samant, G. L. Borges, J. G. Gordon, L. Blum, J. H. White, M. J. Albarelli, M. McMillan and H. D. Abruna, Langmuir, 1988,4, 728-732.
30. K. Varga, P. Zelenay and A. Wieckowski,J. Electroanal. Chem., 1992,330, 453-467.
31. N. Batina, T. Will and D. M. Kolb,Faraday Discuss., 1992,94, 93-106.
32. W. Haiss and J.-K. Sass,Langmuir, 1996,12, 4311-4313. 33. Z. C. Shi, S. J. Wu and J. Lipkowski,J. Electroanal. Chem., 1995,
384, 171-177.
34. Z. C. Shi, S. J. Wu and J. Lipkowski,Electrochim. Acta, 1995,40, 9-15.
35. S. Wu, J. Lipkowski, T. Tyliszczak and A. P. Hitchcock,Prog. Surf. Sci., 1995,50, 227-236.
36. M. H. Hölzle, U. Retter and D. M. Kolb,J. Electroanal. Chem., 1994,371, 101-109.
37. H. Matsumoto, J. Inukai and M. Ito,J. Electroanal. Chem., 1994,
379, 223-231.
38. W. Haiss, D. Lackey, J. K. Sass, H. Meyer and R. J. Nichols,Chem. Phys. Lett., 1992,200, 343-349.
39. F. Möller, O. M. Magnussen and R. J. Behm,Electrochim. Acta, 1995,40, 1259-1265.
40. S. Wu, Z. Shi, J. Lipkowski, A. P. Hitchcock and T. Tyliszczak,J. Phys. Chem. B, 1997,101, 10310-10322.
41. M. A. Schneeweiss and D. M. Kolb,phys. stat. sol. a, 1999,173, 51-71.
42. M. S. Zei, K. Wu, M. Eiswirth and G. Ertl, Electrochim. Acta, 1999,45, 809-817.
43. A. I. Danilov, E. B. Molodkina, A. V. Rudnev, Y. M. Polukarov and J. M. Feliu,Electrochim. Acta, 2005,50, 5032-5043.
44. H. Uchida, M. Hiei and M. Watanabe, J. Electroanal. Chem., 1998,452, 97-106.
45. M. Nakamura, O. Endo, T. Ohta, M. Ito and Y. Yoda,Surf. Sci., 2002,514, 227-233.
46. J. Okada, J. Inukai and K. Itaya,Phys. Chem. Chem. Phys., 2001,
3, 3297-3302.
47. G. L. Borges, K. K. Kanazawa, J. G. Gordon, K. Ashley and J. Richer,J. Electroanal. Chem., 1994,364, 281-284.
48. D. Krznarić and T. Goričnik, Langmuir, 2001,17, 4347-4351.
49. M. S. Zei, G. Qiao, G. Lehmpfuhl and D. M. Kolb,Ber. Bunsen-Ges. Phys. Chem., 1987,91, 349-353.
50. O. M. Magnussen, J. Hotlos, G. Bettel, D. M. Kolb and R. J. Behm,J. Vac. Sci. Technol. B, 1991,9, 969-975.
51. R. Michaelis, M. S. Zei, R. S. Zhai and D. M. Kolb,J. Electroanal. Chem., 1992,339, 299-310.
52. S. Manne, P. K. Hansma, J. Massie, V. B. Elings and A. A. Gewirth,Science, 1991,251, 183-186.
53. Z. Shi and J. Lipkowski,J. Electroanal. Chem., 1994,369, 283-287.
54. Z. C. Shi and J. Lipkowski,J. Phys. Chem., 1995,99, 4170-4175.
55. M. F. Toney, J. N. Howard, J. Richer, G. L. Borges, J. G. Gordon, O. R. Melroy, D. Yee and L. B. Sorensen,Phys. Rev. Lett., 1995,
75, 4472-4475.
56. L. Blum, D. A. Huckaby and M. Legault,Electrochim. Acta, 1996,
41, 2207-2227.
57. J. G. Xu and X. W. Wang,Surf. Sci., 1998,408, 317-325.
58. Y. D. Chiu, W. P. Dow, Y. F. Liu, Y. L. Lee, S. L. Yau and S. M. Huang,Int. J. Electrochem. Sci., 2011,6, 3416-3426.
59. R. Gomez, H. S. Yee, G. M. Bommarito, J. M. Feliu and H. D. Abruna,Surf. Sci., 1995,335, 101-109.
60. N. M. Markovic, H. A. Gasteiger, C. A. Lucas, I. M. Tidswell and P. N. Ross,Surf. Sci., 1995,335, 91-100.
61. N. Ikemiya, S. Miyaoka and S. Hara,Surf. Sci., 1994,311, L641-L648.
62. J. Hotlos, O. M. Magnussen and R. J. Behm,Surf. Sci., 1995,335, 129-144.
63. H. Matsumoto, I. Oda, J. Inukai and M. Ito,J. Electroanal. Chem., 1993,356, 275-280.
64. I. V. Pobelov, G. Nagy and T. Wandlowski,J. Chem. Sci., 2009,
121, 745-756.
65. M. H. Hölzle, V. Zwing and D. M. Kolb,Electrochim. Acta, 1995,
40, 1237-1247.
66. S. Frittmann and R. Schuster, J. Phys. Chem. C, 2016, 120, 21522-21535.
67. P. Zelenay, L. M. Rice-Jackson, A. Wieckowski and J. Gawłowski,
Surf. Sci., 1991,256, 253-263.
68. C. Schlaup and S. Horch,Surf. Sci., 2013,608, 44-54.
69. C. Silien, M. T. Räisänen and M. Buck,Angew. Chem. Int. Ed., 2009,48, 3349-3352.
70. R. Madueno, M. T. Raisanen, C. Silien and M. Buck, Nature, 2008,454, 618-621.
71. N. Batina, T. Will and D. M. Kolb,Faraday Discuss., 1992, 93-106.
72. J. Zegenhagen,Surf. Sci. Rep., 1993,18, 199-271.
73. S. Wu, Z. Shi, J. Lipkowski, A. P. Hitchcock and T. Tyliszczak,J. Phys. Chem. B, 1997,101, 10310-10322.
74. Y. Soldo, E. Sibert, G. Tourillon, J. L. Hazemann, J. P. Levy, D. Aberdam, R. Faure and R. Durand,Electrochim. Acta, 2002,47, 3081-3091.
75. H. Bludau, K. Wu, M. S. Zei, M. Eiswirth, H. Over and G. Ertl, Surf. Sci., 1998,402, 786-789.
76. Y. Gründer, A. Drunkler, F. Golks, G. Wijts, J. Stettner, J. Zegenhagen and O. M. Magnussen,Surf. Sci., 2011,605, 1732-1737.
77. C. Shen, I. Cebula, C. Brown, J. Zhao, M. Zharnikov and M. Buck, Chem. Sci., 2012,3, 1858-1865.
78. A. Cuesta, M. Kleinert and D. M. Kolb,Phys. Chem. Chem. Phys., 2000,2, 5684-5690.
79. Z. Shi and J. Lipkowski,J. Electroanal. Chem., 1996, 403, 225-239.
80. I. Horcas, R. Fernandez, J. M. Gomez-Rodriguez, J. Colchero, J. Gomez-Herrero and A. M. Baro,Rev. Sci. Instrum., 2007,78. 81. I. Vartanyants, T. L. Lee, S. Thiess and J. Zegenhagen, Nucl.
Instrum. Methods Phys. Res., Sect. A, 2005,547, 196-207. 82. J. Zegenhagen, in Surface Science Techniques, eds. G. Bracco
and B. Holst, Springer, 2013, pp. 249-275.
83. G. Kresse and J. Hafner,Phys. Rev. B, 1993,47, 558-561. 84. G. Kresse and J. Hafner,Phys. Rev. B, 1994,49, 14251-14269. 85. G. Kresse and J. Furthmüller,Comput. Mater. Sci., 1996,6,
15-50.
86. J. P. Perdew, K. Burke and M. Ernzerhof,Phys. Rev. Lett., 1996,
77, 3865-3868.
Physical
Chemistry
Chemical
Physics
Accepted
Manuscript
Published on 15 August 2017. Downloaded by University of St Andrews Library on 18/08/2017 10:11:43.
ARTICLE Journal Name
87. S. Grimme, S. Ehrlich and L. Goerigk,J. Comput. Chem., 2011,
32, 1456-1465.
88. P. E. Blöchl,Phys. Rev. B, 1994,50, 17953-17979.
89. G. Kresse and D. Joubert,Phys. Rev. B, 1999,59, 1758-1775.
Physical
Chemistry
Chemical
Physics
Accepted
Manuscript
Published on 15 August 2017. Downloaded by University of St Andrews Library on 18/08/2017 10:11:43.