www.impactjournals.com/oncotarget/ Oncotarget, Vol. 7, No. 17
Tumor necrosis factor receptor 2-signaling in CD133-expressing
cells in renal clear cell carcinoma
Rafia S Al-Lamki1, Jun Wang1, Jun Yang1, Natalie Burrows2, Patrick H Maxwell2,
Timothy Eisen3, Anne Y Warren4, Sakari Vanharanta5, Simon Pacey3, Peter
Vandenabeele6, Jordan S Pober7, John R Bradley1
1Department of Medicine, NIHR Cambridge Biomedical Research Centre, University of Cambridge, Cambridge CB2 0QQ, UK 2 School of Clinical Medicine, Cambridge Institute of Medical Research, University of Cambridge, Cambridge Biomedical
Campus, Cambridge CB2 0XY, UK
3Department of Oncology, University of Cambridge, Cambridge CB2 0QQ, UK 4Department of Pathology, Addenbrooke's Hospital, Cambridge CB2 0QQ, UK
5MRC Cancer Unit, University of Cambridge, Hutchison/MRC Research Centre, Cambridge CB2 0XZ, UK
6VIB Inflammation Research Center, Ghent University, UGhent-VIB Research Building FSVM, 9052 Ghent, Belgium 7Department of Immunobiology, Yale University School of Medicine, New Haven, Connecticut 06520-8089, USA
Correspondence to: Rafia S. Al-Lamki, e-mail: rsma2@hermes.cam.ac.uk.
Keywords: renal clear cell carcinoma, TNFR2, CD133, cyclophosphamide
Received: September 30, 2015 Accepted: March 02, 2016 Published: March 16, 2016
ABSTRACT
Compared to normal kidney, renal clear cell carcinomas (ccRCC) contain increased
numbers of interstitial, non-hematopoietic CD133+cells that express stem cell
markers and exhibit low rates of proliferation. These cells fail to form tumors upon
transplantation but support tumor formation by differentiated malignant cells. We
hypothesized that killing of ccRCC CD133+ (RCCCD133+) cells by cytotoxic agents might
be enhanced by inducing them to divide. Since tumor necrosis factor-alpha (TNF), signalling through TNFR2, induces proliferation of malignant renal tubular epithelial
cells, we investigated whether TNFR2 might similarly affect RCCCD133+cells. We compared
treating organ cultures of ccRCC vs adjacent nontumour kidney (NK) and RCCCD133+vs
NK CD133+ (NKCD133+) cell cultures with wild-type TNF (wtTNF) or TNF muteins selective
for TNFR1 (R1TNF) or TNFR2 (R2TNF). In organ cultures, R2TNF increased expression
of TNFR2 and promoted cell cycle entry of both RCCCD133+ and NKCD133+ but effects were
greater in RCCCD133+. In contrast, R1TNF increased TNFR1 expression and promoted cell
death. Importantly, cyclophosphamide triggered much more cell death in RCCCD133+ and
NKCD133+cells pre-treated with R2TNF as compared to untreated controls. We conclude
that selective engagement of TNFR2 by TNF can drives RCCCD133+ proliferation and
thereby increase sensitivity to cell cycle-dependent cytotoxicity.
INTRODUCTION
Renal cell carcinoma (RCC) accounts for 85% of renal cancers, of which clear cell RCC (ccRCC) is the most prevalent form [1–5]. RCC responds poorly to cytotoxic drugs. Although, the prognosis for patients with this disease has recently improved due to earlier detection of RCC and expansion of treatment possibilities such as mTor inhibitors and VEGFR-targeted tyrosine kinase inhibitors [1], these treatments rarely yield complete responses. T-cell checkpoint inhibitors show promise
but are not standard of care at the time of writing. Thus, RCC is still a tumor with poor clinical outcome and
identification of additional cellular treatment targets is of
utmost importance for improving prognosis.
CD133 is a pentaspan transmembrane glycoprotein
(Prominin-1), whose specific functions are still unclear. It was initially identified as a specific marker for
hematopoietic stem cells [6, 7] but more recently it has been proposed to be a stem/progenitor marker in a variety of adult tissues including normal human kidney and RCC
www.impactjournals.com/oncotarget
stem/progenitor cells is a matter of debate (reviewed by Wu and Wu et al., [23], as it has been found on various differentiated adult epithelial cells, including renal tubular cells [10, 24–28]. Although CD133+ cells from several
human tumors exhibit xenotransplantation potential in
severe combined immunodeficiency (SCID) mice [8, 18, 19, 29], CD133+ cells from human RCC tissue (RCCCD133+cells)
[27] fail to form tumors when transplanted independently
in SCID mice but instead potentiate tumor engraftment
when co-transplanted with CD133- RCC cells [29]. Higher
numbers of CD133+cells in RCC tissue has been correlated
with increasing tumor grade [22] and was associated with a favourable prognosis in some studies [27, 30] but not others [31]. While it is unclear whether RCCCD133+cells
are true tumor stem cells and their prognostic significance
is uncertain, their ability to promote tumor formation by CD133- RCC cells may contribute to the resistance of these
tumors to conventional chemotherapy so that elimination of this population may improve outcomes.
Tumor necrosis factor-alpha (TNF) is a cytokine secreted by RCC with a number of tumor promoting properties [32] and inhibition or blockade of TNF has
shown clinical benefit in some patients with RCC [33– 35]. This seems paradoxical as TNF was first identified
as a cytokine that induced hemorrhagic necrosis of experimental tumors in mice [36]. We have shown that TNF can induce both cell death and proliferation in ccRCC cells in organ culture [37], and the relative expression and ligation of TNF receptor (TNFR) 1 and TNFR2 may be a
key determinant of which pathways dominate. Specifically,
ligation of TNFR1 promotes cell death whereas ligation
of TNFR2 more typically induces cell cycle entry. Since
the low rate of proliferation of RCCCD133+cells may be
protecting them from chemotherapy, we have investigated the effects of TNFR2 on RCCCD133+cells and asked whether
such pre-treatment would induce proliferation and thereby render them more susceptible to cell cycle-dependent chemotherapeutic drugs [38].
RESULTS
Enumeration and characterization of CD133+cells in NK and ccRCC
Immunostaining on sections of NK demonstrated rare interstitial CD133+cells (NKCD133+) (mean <3%)
within the cortex, consistent with a previous report [10]. In comparison, sections of ccRCC contained a noticeably higher frequency of RCCCD133+cells (RCCCD133+), which
increased further with tumor grade (Figure 1A panel i, quantified in B), ranging from mean ~6-8% in grade
1/2 tumors to 14-16% in grade 3/4 tumors. Combined-immunostaining for CD133 and a stem cell transcription factor, Oct4, demonstrated a strong nuclear staining of Oct4 in 8% of NKCD133+ and 12% of RCCCD133+cells (Figure 1A,
panel ii). Cultures of CD133+cells isolated from either NK
and ccRCC demonstrated spindle-shaped morphology and
scanty cytoplasm (Figure 1C). Because the glycosylated
form of CD133 expression that is recognized appears to
vary with the antibody used for staining [39] and because
different glycosylation patterns may be indicative with stemness, we tested different antibodies on our isolated cell populations. Four different anti-CD133 monoclonal
antibodies (W6B3C1, AC133, ab19898, E93002) displayed concordant immunolabeling (Supplementary Figure 1) and
the same cells expressed a marked signal for stem
cell-associated markers [Oct4, Lin28, Nanog and Sox2) and for
vimentin but lacked epithelial [cytokeratin and epithelial cell adhesion molecule (EpCAM)], endothelial [PECAM-1 (CD31)] and leukocyte [leukocyte common antigen (CD45)] markers (Figure 1E). This phenotype is most consistent with but does not absolutely establish identity as a stem cell population.
Expression of TNF and TNFRs and responses to TNF by RCCCD133+ and NKCD133+cells
RCCCD133+cells were examined for protein expression
of TNF and TNFRs at the basal level (untreated UT; 0h) and after treatment with wtTNF at various time points (3,6 & 18h). TNF and TNFRs were negligible in UT cultures, with TNFR2 expression detected at 3, 6 and 18h, with a higher level of expression at 18h. In comparison, TNF and TNFR1 expression were detected only in 18h cultures. (Figure 2A). Corresponding organ cultures of ccRCC demonstrated different levels of TNF (21+1.1%), TNFR1 (6.0+0.5%) and TNFR2 (28+1.2%) in CD133+cells. There were also a few
CD133- cells within the interstitial tissue that were positive
for TNF (25.0+0.2%), TNFR1 (2.0+0.1%) or TNFR2 (18.0+0.5%) (Figure 2B). Treatment with wtTNF increased
TNFR2 protein expression in both cultured cell types, but the effect was more pronounced in RCCCD133+cells with a
higher expression detected at 18h (15.2+0.8%) compared to 6h (8.1+0.4%) or 3h (6.0+0.5%). wtTNF also induced TNF (4.4+0.2%) and TNFR1 protein expression (3.0+0.1%) at 18h but not at 6 or 3h. Interestingly, R2TNF induced TNFR2 but not TNF or TNFR1 while R1TNF induced TNFR1 but not TNF or TNFR2 (data not shown). qRT-PCR of similar cultures demonstrated induction of TNF mRNA expression by wtTNF; increases were noted but did
not reach significance in NKCD133+cells treated with R1TNF
or R2TNF compared to UT cultures (***p<0.0001). In
comparison, all three treatments significantly induced TNF
mRNA expression in RCCCD133+cells (***p<0.0001 vs UT).
Notably, wtTNF and R1TNF (but not R2TNF) induced TNFR1 mRNA expression, with a more pronounced expression demonstrated in RCCCD133+cells and induced
by wtTNF (***p<0.0001) than by R1TNF (┼p<0.05) vs UT
cultures. TNFR2 mRNA expression was induced by wtTNF and R2TNF (not R1TNF) (***p<0.0001 vs UT cultures)
with a higher level of expression in RCCCD133+ compared to
We next assessed the effect of wtTNF, R1TNF and R2TNF on the induction of cell death and cell cycle activation in RCCCD133+ and NKCD133+cells. wtTNF or
R1TNF each induced increased cell death in RCCCD133+cells
as compared to UT or R2TNF-treated cultures [~27+0.9% by wtTNF and ~19+0.7% by R1TNF], positive for TUNEL in a time-dependent manner, with a marked increase in death
in 18h cultures (Figure 3A and 3B and Supplementary Table
1). These effects were less pronounced in NKCD133+cells, in
which wtTNF induced ~12+0.2% and R1TNF-induced
~6+0.2% cell death. Some RCCCD133+/TUNEL+ cells with
fragmented nuclei were TNFR1+ (but not TNFR2+) with
wtTNF inducing ~13+0.2% and R1TNF~6.6+0.2% (Figure
3C and Supplementary Table 2). Because R1TNF-induction
[image:3.612.128.488.172.630.2]of cell death in RCC organ cultures has been positively correlated with caspase activation [37], we examined similar cultures positive for TUNEL and TNFR1 for expression of cleaved caspase-3Asp175 by immunofluorescence (IF) and
Figure 1: A. Representative confocal image of ccRCC grade 3 show a significantly larger number of CD133+cells as compared to NK (arrows) (i), with some CD133+cells also positive for stem cell transcription factor Oct4 (arrows) (ii) B. The increase in CD133+cells correlate with tumor grade (*p<0.05 - grades 1 & 2 vs NK; ***p<0.001 - grades 3 & 4 vs NK), with more cells detected in grade 3/4 as compared to grade 1/2 (±p<0.01). C. Phase-contrast images of tissue-enriched CD133+cells from NK (NKCD133+) and RCC (RCCCD133+) show spindle-shaped morphology and a scanty cytoplasm and, D. are strongly positive for CD133. E. Both the cell types show expression of stem cell markers (Oct4, Lin28, Nanog and Sox2) and vimentin but lack epithelial, endothelial and leukocyte differentiation markers (Cytokeratin, EpCAM, CD31, CD45) t-tubules; G1-G4 - tumor grades 1- 4. Error bars represent mean ± SEM, data are from at least 3
www.impactjournals.com/oncotarget
flow cytometry (FACS). 77% of the RCCCD133+cells treated
with wtTNF that stained positive for TUNEL also stained positive for cleaved caspase 3Asp175 by FACS. However,
only 14% of wtTNF-treated TUNEL positive NKCD133+cells
stained positive for cleaved caspase 3Asp175 (Supplementary
Figures 2A and 2B). These data suggest that the majority
of TNF-induced cell death in RCCCD133+cells occurs via
caspase-3 activation.
wtTNF and R2TNF (but not R1TNF) induced increased pH3S10 signal, a marker of cell proliferation,
and this was more pronounced in RCCCD133+cells (wtTNF ~17%, R2TNF ~13%) compared to NKCD133+cells (wtTNF
Figure 2: A. CD133+ cells isolated from RCC (RCCCD133+) were quantified for expression of TNF or TNFR1 or TNFR2 at basal level (0h) and after treatment with wtTNF at various time points (3, 6 & 18h). TNFR2 expression is detected in cells at 3, 6 and 18h, with a higher level of expression after 18h. In comparison, expression for TNF and TNFR1 is only detected after 18h cultures. B. Representative images of corresponding ccRCC organ cultures show staining of TNF or TNFR1 or TNFR2 in CD133+cells (open arrows), with a few CD133-cells also positive for TNF or TNFR2 (shaded arrows). C. qRT-PCR analysis of RCCCD133+ and NKCD133+cells at day 7 following treatment with wtTNF, R1TNF and R2TNF show mRNA expression normalized to control samples value of 1 for each cell type. Error bars represent the
mean ± SEM, ***p<0.0001 vs UT; **p<0.001 vs UT; +p<0.05 vs R2TNF; ┼p<0.05 vs R1TNF, ns-not significant analyzed by ANOVA and
~7%, R2TNF ~5%) (Figures 3D and 3E).
Combined-immunostaining for pH3S10 and TNFR2 demonstrated
a strong signal for TNFR2 in some proliferating RCCCD133+cells (wtTNF~8% and R2TNF~6% vs 5% and
3% in NKCD133+cells)(Figure 3F). To further confirm
TNF-induction of cell cycle entry, similarly treated cultures
were subjected to IF with an alternative marker of cell proliferation, PCNA [40] (Figure 4A). FACS analysis of
similar cultures for PCNA expression were concordant
[image:5.612.129.490.122.595.2]with IF findings with wtTNF and R2TNF (but not R1TNF)
Figure 3: Representative confocal images of tissue-enriched CD133+cells from ccRCC and NK (RCCCD133+ and NKCD133+) immunostained for CD133 followed by TUNEL assay. A. Untreated (UT) and R2-TNF-treated cultures show a
rare signal for TUNEL (arrows). In contrast, cultures treated with wtTNF and R1TNF show an increased number of TUNEL+nuclei (arrows). B. Quantification of RCCCD133+/TUNEL+ and NKCD133+/TUNEL+ in 10 random fields of view at x40 magnification show a time-dependent increase in the number of positive cells, more pronounced in 18h than 3h cultures, with C. some RCCCD133+/TUNEL+cells are also positive for TNFR1 (red) D. RCCCD133+cells immunostained for pH3S10 (marker of cell cycle) show a rare pH3S10 positive nuclei in untreated (UT) and in R1TNF-treated cultures, while wtTNF and R2TNF-treated cultures show a strong signal (arrows). E. Percentage of RCCCD133+/pH3S10+cells in 10 random fields of view at x40 magnification, presented as proliferative index, show a time-dependent increase in proliferative cells, more pronounced in 18h cultures. F. Some proliferative RCCCD133+/pH3S10+cells are also positive for TNFR2 (green) (shaded arrows) with a few non-poliferative cells (pH3S10-) positive for TNFR2 (open arrows). Nuclei stained with Hoechst-33342.
Bars=mean + SEM, ***p<0.0001; **p<0.001 ; +p<0.05 signify statistically significant difference between treatments, data are from at least 3
www.impactjournals.com/oncotarget
showing a marked expression, more pronounced in RCCCD133+ compared to NKCD133+cells (Figure 4B). Similar
effects of wtTNF and R2TNF were demonstrated by cell viability assays (Figures 4C and 4D) in a time-dependent manner with increase viability in cultures at day 4 vs day 2 and in RCCCD133+ vs NKCD133+cells. These data are consistent
with the interpretation that TNF induces cell death of CD133+ normal and malignant renal cells through TNFR1
and cell cycle entry through TNFR2 in RCCCD133+cells. The
ability of wtTNF but neither of the muteins to increase
TNF staining is unexplained but all three treatments induced TNF mRNA in isolated RCCCD133+cells.
TNFR2 sensitizes RCCCD133+cells to killing by
Cyclophosphamide (CP)
Having established that signling through TNFR2 does promote entry of RCCCD133+ into cell cycle, we next
sought to determine whether R2TNF sensitizes RCCCD133+
[image:6.612.130.487.178.648.2]or NKCD133+cells to killing by CP. Cells were exposed to
Figure 4: A. Representative confiocal images of combined staining for TNFR2 and proliferative nuclear antigen (PCNA) showing
co-staining in some RCCCD133+ cells (arrows). B. Representative flow cytometry analysis of similar cultures from ccRCC and NK (RCCCD133+ and NKCD133+) show a high expression of PCNA induced by wtTNF- or R2TNF-treatment as compared to R1-TNF-treated and control
cultures (UT) after day 4. Quantification of two cell viability assays; CCK-8 C. and trypan blue exclusion assay D. are concordant with
flow cytometry showing an increase cell viability in cultures treated with wtTNF- and R2TNF as compared to UT and R1TNF-treated
cultures. Error bars represent the mean + SEM, ***p<0.0001 vs UT; **p<0.001 vs UT, ¥p<0.05 vs R1TNF; ±p<0.05 vs Day 2 (R2TNF), ns-not
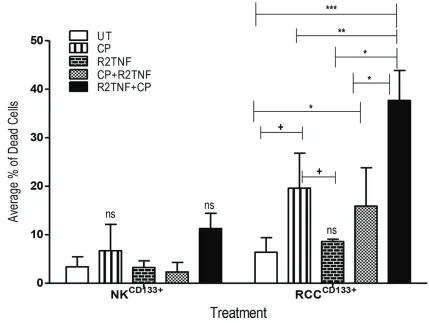
either CP alone, R2TNF alone, or CP followed by R2TNF (CP+R2TNF) or to R2TNF followed by CP (R2TNF+CP), and then analyzed by staining with FITC--conjugated
Annexin-V/Propidium Iodide (PI)and examined by FACS.
In comparison with UT cultures, R2TNF+CP (***p<0.001),
CP alone and CP+R2TNF (*p<0.05) all induced some
death in RCCCD133+cells with the highest level of cell death
induced by R2TNF+CP compared to treatment with CP alone (+p<0.01) or CP+R2TNF (*p<0.01). R2TNF+CP also
resulted in death of NKCD133+ but a significant level of death
was observed in only 1 out of 3 experiments, indicating that RCCCD133+cells are more sensitive to the cytotoxic
effects of CP than are NKCD133+ (Figure 5). The percentage
of dead RCCCD133+ and NKCD133+cells is presented in
Supplementary Table 3. Moreover, representative images of
FITC-Annexin-V/PI and phase-contrast microscopy are shown
in Supplementary Figures 3A and 3B. These data indicate
that signaling through TNFR2, probably by inducing proliferation, sensitizes RCCCD133+cells to killing by CP.
DISCUSSION
Our rationale for studying CD133+cells in NK
or RCC is their potential role as renal stem cell and tumor stem cells, respectively. In the present paper, we characterized these populations both in intact tissue and in cell culture. We have evaluated their responses to TNF, as this cytokine appears to play a complex role both in NK and ccRCC, being capable of inducing both proliferation and cytotoxic responses [37]. Analyzing responses mediated by TNFR1 and TNFR2 using muteins that selectively activate one receptor or the other can separate some of the seeming contradictions in TNF responses.
Our key findings are that in intact renal tissue there is a significant increase in the numbers of CD133+cells
in RCC vs NK, consistent with a prior report [27]. Furthermore, the frequency of RCCCD133+cells increased
with higher tumor grade. Both NKCD133+ and RCCCD133+cells
[image:7.612.89.518.297.620.2]are responsive to TNF. Specifically, ligation of TNFR2
Figure 5: Flow cytometry analysis showing the effect of cyclophosphamide (CP) in cultures of tissue-enriched CD133+cells from ccRCC and NK (RCCCD133+ and NKCD133+) treated with R2TNF before and after CP or with CP alone. Quantification of average percentage of dead cells stained with Annexin V and Propidium Iodide and analyzed with flow cytometry show
www.impactjournals.com/oncotarget
increases transcription of TNFR2 and promotes their entry into cell cycle in organ culture. The entry of RCCCD133+cells
into cell cycle in response to TNFR2 signaling increased susceptibility to CP-induced cell death. R2TNF also induced proliferation of NKCD133+cells but CP was less
effective in killing them as compared to RCCCD133+cells.
A key question, not fully answered by our findings,
is whether the interstitial CD133+cells in the renal cortex
are or are not renal stem cells. We found that CD133+cells
in RCC and NK were uniformly negative for the hematopoietic stem cell markers CD31 or CD45 but were strongly and persistently positive for stem cell markers
(Oct4, Sox2, Nanog and Lin28) and for vimentin [41].
These data strongly suggest that they are a primitive cell
type, consistent with previous studies [27, 29]. Although,
we failed to detect cytokeratin in the CD133+ cells from
both the study groups, we did however, observe its expression when driven to differentiate into an epithelial lineage (RA-L unpublished data), suggesting capacity of these progenitor cells to acquire markers characteristic of
fully differentiated renal epithelia. Stem cell transcription factors Oct4 and/or Sox2 have been found to bind to the
P1 promoter region of the CD133 gene and ectopic Oct4 or
Sox2 expression has been shown to trigger the CD133P1
activity in the lung cancer cell lines [42]. CD133 marker
was initially used to identify cancer stem cells (CSCs) in brain tumor [18, 19]. CD133+stem/progenitor cells, also
referred to as tumor-initiating cells, CSCs, stem-like cells [9, 20, 23, 29, 30, 43-47], have been isolated in normal and neoplastic tissue including the human kidney and RCC [9-11, 27, 29, 45, 48, 49]. Although some CD133+cells have
been shown to possess self-renewal properties and clonal
efficiency; current literature on the use of CD133 as the
only marker to identify stem cells has been questioned since its presence has been localized in a variety of adult epithelial cells including pancreas, liver and renal tubules [10, 26, 28, 50, 51] and localize to membrane protrusions [6]. In RCC, CD133+cells have been detected in apical
membrane of tumor cells in macro/microcytic regions [27] and in perinecrotic/ perivascular areas [20]. Moreover, in human kidneys, CD133 immunoreactivity was localized
to proximal tubules and Bowman’s capsule [50] and not
restricted to stem cells. Interestingly, other groups have shown that CD133 is not only a biomarker, but also functions in cell growth, development and tumor biology [52]. Indeed, CD133 expression and post-translational
modification are dynamic and reversible that is dependent
on cell microenvironment and physiological regulation [53].
The tumorigenic potential of CD133+cells
depends on the tissue of origin. For example, in human brain, CD133+cells are capable of self-renewal and
recapitulate the original tumor when transplanted in
SCID mice [19]. Similarly, CD133+cells from primary
lung tumors show higher tumorigenic potential than their CD133−counterparts and are able to reproduce the original tumor in SCID mice [8]. Conversely, in RCC,
undifferentiated CD133+cells express low level of Oct4,
have a low proliferative rate [27] and fail to form tumors
independently in SCID mice but support tumor growth when co-transplanted with tumor cells [29]. These
reports indicate that CD133+cells are a heterogeneous cell
population with varied function(s).
Recruitment of CD133+ pro-angiogenic cells in
cancer has been considered to play an important role in resistance to vascular growth factor (VEGF) neutralizing antibody such as bevacizumab, possibly due to failure to inhibit their differentiation into endothelial cell types [54]. Moreover, CD133 gene polymorphism have been associated with lower overall survival rate in patients treated with bevacizumab in metastatic colorectal cancer treated [55]. These studies generally have as their premise that VEGF as a tumor angiogenic factor. Neutralization of VEGF may play an additional role in RCC as these cells, like endothelium, express VEGF receptor 2 (VEGFR2) and proliferate in response to its autocrine production. Our prior studies of malignant tubular epithelial cells in ccRCC organ culture indicated that signalling through TNFR2 induced ligand-independent transactivation of VEGFR2 and that blockade of VEGFR2 kinase activity inhibited TNFR2-induced cell cycle entry [37, 56, 57].
Tumor cells and tumor microenvironment may play a vital role in regulating self-renewal properties of CD133+cells in RCC [29]. Inflammation and hypoxia are
characteristic features of neoplasm and facilitates tumor
growth. Cancer-associated inflammation is characterized by expression of cytokines, influx of leukocytes, tissue
remodeling and angiogenesis [58–60]. Cytokines have pro-tumor properties. TNF is secreted by RCC [37, 61], and increase stemness properties in RCC in 2D cultures [62]. TNF targets the quiescent/slow-cycling stem cells and promotes PI3K/AKT-driven expansion in melanoma by preventing their asymmetrical self-renewal [63]. These data strongly suggest that TNF,
present in the tumor microenvironment, may influence
the behaviour of CD133+cells in RCC and potentiate
their self-renewal properties. In our preliminary studies, we have demonstrated TNF-induced upregulation of stem cell transcription genes (Oct4, Nanog and Lin28) in RCCCD133+cells (RA-L, unpublished data), consistent with a
prior report by Ueda et al [64]. Hypoxia has been shown to
influence the expression of CD133 in RCC [65], as well as
in lung cancer, pancreatic cancer and glioma cells [66, 67]. We have previously reported that hypoxia both increases TNF expression and TNFR2 induction and expression of a stem cell marker Lin28 in c-kit+ cardiac stem cells
that then enter cell cycle [68]. Collectively, these findings
suggest that a transient exposure of RCCCD133+cells to TNF
and/or hypoxia may imprint their long-lasting molecular and/or cellular changes with functional consequences.
In summary, our data confirm that CD133+cells are
present in larger numbers in ccRCC than in NK and that they respond to TNFR2 signaling, which promotes their
in renal tumours remain unclear, they likely have
pathogenetic signficance. TNF, signaling via TNFR2, not
only causes these cells to proliferate, it also increases their senstivity to cell cycle-sensitive chemotherapy. Therefore, priming these cells with a TNFR2 agonist may enhance
the efficacy of chemotherapy for ccRCC.
MATERIALS AND METHODS
Antibodies, cytokines, and reagentsRecombinant human TNF (cat~201-TA), mouse anti-TNFR1 (cat~MAB225) and mouse anti-TNFR2 (MAB226) all from R&D Systems, Abington, UK, rabbit anti-TNFR1 (cat~ab19139) (Abcam, Cambridge, UK), rabbit anti-TNFR2 (cat~sc-7862 H202, Santa Cruz Biotechnology, Heidelberg, Germany), mouse anti-PECAM/CD31 (cat~M0823), mouse anti-cytokeratin (cat~M0821 clone MNF116) and mouse anti-CD45 (cat~M0701), mouse anti-Vimentin Clone V9 (cat~M0725) all from Dakocytomation, Ely, UK, rabbit anti-Vimentin (D21H3)(Cell Signaling Technology Inc, UK), rabbit anti-CD133 (E90032, Source Bioscience, Nottingham, UK); rabbit anti-CD133 (cat~ab19898, Abcam), mouse anti-CD133/1-W6B3C1 092-395) and mouse anti-CD133/1-AC133 (cat~130-090-422) both from Miltenyi Biotec Ltd, Surrey, UK, rabbit anti-human EpCAM (GTX113091, Source Bioscience); mouse anti-Sox2 (cat~MCA5660T) and mouse anti-Nanog (cat~MCA5657T, Bio-Rad
Laboratories Ltd , Hertfordshire, UK), Hoechst-33342
(Thermo Fisher Scientific, Paisley, UK); rabbit anti-Lin28 (cat~ab46020), rabbit anti-Oct4 (cat~ab19857),
mouse anti-phosphorylated Histone H3S10 (pH3S10) (cat~ab14955), rabbit anti-phosphorylated Histone H3S10
(pH3S10)(cat~ab5176), anti-TNF-alpha (cat~ab6671)
all from Abcam, mouse anti-proliferative cell nuclear
antigen (PCNA, cat~MAB424 clone PC10, Millipore,
Hertfordshire, UK). Cleaved caspase-3Asp175 (cat~9661,
Cell Signaling Technology, Leiden, The Netherlands). Tissue Dissociation Kit (cat~130-095-929), MS columns (cat~130-042-201), C-Tubes (cat~130-093-237) were from Miltenyi Biotec. TUNEL label (dUTP -FITC) (cat~11767291910), Terminal transferase enzyme
(TdT) (cat~03333566001), deoxynuclease-1 (DNase-1) and Annexin-V-FLUOS Staining Kit all from Roche
Diagnostics, Mannheim, Germany. Recombinant mutations of the TNF sequence which enable the mutated protein (“mutein”) to bind selectively to either of the TNFR subtypes; TNFR1 (R1TNF) and TNFR2 (R2TNF)
[37, 40, 69]. Cyclophosphamide was from Sigma-Aldrich, St. Louis, MO.
Tissue collection
Experiments using human tissue were performed with informed consent of patients and approval of
the local ethics committee and Cambridge University
hospital Tissue Bank. RCC tissue obtained from radical
nephrectomy specimens was immediately excised from tumors that grossly appeared to be ccRCC. This tumor
classification was later verified by routine histological assessment of paraffin-wax embedded samples. Non-clear
cell histological tumor types (e.g. papillary, chromophobe, and collecting duct) [70] were excluded and only ccRCC, graded according to the four-tiered Fuhrman nuclear grading system [71] and pathologically staged based on
the TNM classification [37, 72] were used. Tissue samples
from 40 patients were collected and scored as Fuhrman
grade 1 (n=10), Fuhrman grade 2 (n=10), Fuhrman grade 3 (n=12), and Fuhrman grade 4 (n=8). In parallel, adjacent non-tumor kidney (NK) (n=20), categorized histologically
as normal kidney cortex was collected remote from the
tumor site. All samples were either fixed overnight at 4°C
in 4% formaldehyde in 0.1M phosphate buffer pH 7.6 and
paraffin wax-embedded for immunofluorescence or
snap-frozen in isopentene-cooled in liquid nitrogen.
Parallel-unfixed fresh samples were processed for organ culture
experiments.
Kidney organ cultures
Organ cultures were performed as previously described [37]. In brief, duplicate 1 mm3 fragments of
tissue from ccRCC grade 1 and NK (n=5 per study group) were immersed in M199 medium containing 10% heat-inactivated fetal calf serum (FCS), antibiotics and 2.2mM
glutamine. Cultures were either left in media alone (untreated controls; UT) or treated with TNF (10ng/mL) or R1TNF or R2TNF (1µg/mL) [37, 40, 73] at various time
points (0, 3, 6 and 18h). Cultures were harvested, fixed in 4% formaldehyde and embedded in paraffin-wax.
Processing, isolation, and culture of CD133+cells from ccRCC and nontumor
adjacent kidney (NK)
ccRCC and NK (n=10 per study group) were
enzymatically digested as previously reported [68]. In brief, tissue was digested into single cell suspension using Tissue Dissociation Kit on a GentleMACs Disassociator and incubated on a MACsMix rotator (Miltenyi) for 30 min at 37oC, centrifuged at 300g for 5 min, passed
through 40µm strainer to remove cell clumps. Single cell
suspensions were cultured in nondifferentiating expansion
medium [29] [containing 60% low-glucose Dulbecco’s modified Eagle’s medium-LG (DMEM-LG), 2% FCS, 40% MCDB-201, 1x insulin-transferrin-selenium, 1x
linoleic acid 2-phosphate, 10-9 M dexamathasone, 104M
www.impactjournals.com/oncotarget
from ccRCC and NK (referred to as RCCCD133+ and
NKCD133+) was achieved by magnetic cell sorting system
according to the manufacturer's instructions (Mitenyi). A total of 6 x10⁸ cells were magnetically labeled with
CD133 microbeads and passed through the MACS column on MiniMACS Separator. The magnetically labeled
CD133+cells were eluted from magnetic column as the
positively selected cell fraction. Enriched population of RCCCD133+ and NKCD133+cells (~6x10⁵ cells/mL) were
seeded in T25 flasks and transferred to eight-well glass slide chambers (Thermo-scientific, UK). Once confluent,
cells were either UT or treated with wtTNF or R1TNF or R2TNF for 3 and 18h.
Single and combined immunofluorescence (IF)
Sections of ccRCC, NK and corresponding organ
cultures were immunostained for CD31 (1:50 dilution) as previously described [37, 40]. As CD133 expression has been associated with stem/progenitor cells in RCC, we co-immunostained some cultures with anti-CD133 and a
panel of stemness markers (Lin28, Oct4, Nanog, Sox2)
or markers for epithelial, endothelial and leukocytes (cytokeratin, CD31, EpCAM, CD45) and a mesenchymal marker (vimentin) (all used at 1:100 dilution). pH3S10 and
PCNA (used at 1:500 and 1:200 dilution) were used to detect cell cycle activation and assessed in association with
TNF and TNFRs. In addition, some cultures were subjected
to co-immunostaining for TNFR1 and cleaved caspase-3Asp175. Antibody binding sites were detected with Northern
Light-498 or -557-conjugated secondary antibodies (diluted
1:100), incubated 1h at room temperature. Hoechst-33342
(1μg/ml) was used for nuclei detection. Species-specific antiseras were used as negative controls. Slides were viewed on a Leica TCS-SPE confocal microscopy (CLSM)
(Leica Microsystems, Milton Keynes, UK) and image
for each fluorophore was acquired sequentially using the
same constant acquisition time and settings rather than simultaneously to avoid crosstalk between channels. Images
were then processed in Adobe Photoshop CS6 software.
Determination of RCCCD133+ and NKCD133+ cell
death
The effect of wtTNF, R1TNF and R2TNF treatment on cell death in RCCCD133+ and NKCD133+ was assessed
using TUNEL as previously described [37, 40, 74].
Briefly, RCCCD133+ and NKCD133 cells and organ cultures
from each of the four treatments were incubated with
FITC-dUTP-TUNEL label mix containing TdT-enzyme
plus Hoechst-33342 for nuclei detection and mounted in Vectorshield mountant (Vector Laboratories, Peterborough, UK). For negative controls, TdT-enzyme was omitted and for positive controls cultures were pretreated with DNase-1 enzyme (Promega, Hampshire, UK) before TUNEL. Three experiments were performed separately. Following TUNEL, some cultures were incubated with
anti-TNF and anti-TNFRs antibodies and detected using Northern Lights568-conjugated secondary antibody plus
Hoechst-33342. In addition, cell suspensions from UT and wtTNF-treated cultures from both the study groups were labeled with an antibody to cleaved-caspase-3Asp175
followed by incubation with a FITC-conjugated secondary antibody and analyzed by flow cytometry (FACS) using Canto II (BD Biosciences). All slides were viewed on a CLSM.
RNA isolation and quantitative reverse-transcription polymerase chain reaction (qRT-PCR)
Total cellular RNA was extracted from UT and wtTNF-, R1TNF-, R2TNF-treated cultures of RCCCD133+
and NKCD133+cells using the RNeasy Plus Mini Kit
(Qiagen, Germany). 6µg RNA from each sample was reversely transcribed into cDNA and measured using Taqman Reverse Transcription Kit according to the
manufacturer's instructions (ABI7700 System, Applied Biosystems, CA, USA). TaqMan_Gene Expression Assay
ID: TNFR1 (Hs00533560), TNFR2 (Hs00153550), TNF
(Hs99999043) were used. (GAPDH; Hs04420697) was
used for normalization.
Determination of RCCCD133+ and NKCD133+ cell
proliferation
The effect of wtTNF, R1TNF and R2TNF
on cell proliferation was evaluated by FACS using
immunostaining for anti-PCNA antibody and two different cell viability assays [cell counting kit-8 (CCK-8) and trypan blue exclusion]. RCCCD133+ and NKCD133+cells
serum-depleted were seeded in 12-well culture plates for
FACS (1x10⁵cells/mL), for CCK-8 assay (3x10⁴cells/mL)
and for trypan blue staining (5×10³cells/mL) in 24-well
culture plates. Cultures were either left UT or treated with
wtTNF, R1TNF or R2TNF for 48h and 96h. Cells were then rinsed in PBS, blocked with FcR blocking reagent (Miltenyi) and incubated with PE-conjugated antibody to PCNA- or with PE-conjugated isotype-specific antisera before examining using FACS Canto II. 10,000 events
were collected per sample and the data analysed with FlowJo software. For the CCK-8, cells were treated for
48h and the WST-8 reagent (10μL/well) Sigma-Aldrich, UK was added to each well and incubated for 2h at 37°C.
The absorbance optical density (OD) (proportional to the relative abundance of living cells) was measured at 450nm
wavelength using a microplate reader (Bio-Rad, USA). For
Determination of cytotoxic effect of cyclophosphamide (CP) by FACS
To evaluate the effect of CP following cell cycle activation of RCCCD133+ and NKCD133+cells by R2TNF, cells
(0.5×10⁵cells/well) were seeded in 24-well plates coated
with human plasma fibronectin. Cells were then either left
UT or treated with CP alone or R2TNF alone, or R2TNF for 48h before CP (R2TNF+CP) (to induce cell proliferation) or after (CP+R2TNF) for a further 48h. A dose response curve was initially set up to determine the optimal effect of CP using documented concentrations (1.25, 2.5 and 5µM) [75,
76] at 24h and 48h time points. No significant difference in
toxicity was demonstrated between the 3 doses, although a higher number of dead cells were evident at 48h. 1.25µM CP for 48h was therefore used for all subsequent experiments. Following treatment, cells were harvested and cytotoxic effect of CP determined by Annexin V/Propidium Iodide
(PI) staining using FACS. Cells were gated as fractions of
non-apoptotic live cells (Annexin V-/PI-), early apoptotic
cells (Annexin V+/PI-), late apoptotic and necrotic cells
(Annexin V+/PI+) and calculated as the average percentage
of dead cells. FlowJo and GraphPad softwares were used to
analyze the data, represented as mean ± SEM from at least
3 independent experiments.
Data analysis
Cell death and proliferative indices
The average number of RCCCD133+ and NKCD133+cells
positive for TUNEL were counted in 10 random fields of view at x40 magnification from each treatment divided
by the total cell numbers to generate the percentage
of positive cells. Similarly, the numbers of RCCCD133+
and NKCD133+cells positive for pH3S10 were counted and
divided by the total cell numbers to generate the % of positive cells, calculated as proliferative index (PI) for
each treatment. Error bars represent mean ± SEM. Each
experiment was repeated at least 3 times and the same
statistically significant differences between experimental
groups were observed in all three independent experiments although the absolute values varied. Microsoft Excel 2013 and GraphPad Prism 5.02 softwares were used for
data processing. Statistical significance was assessed by
the analysis of variance test and a p-value of <0.05 were
considered significant.
ACKNOWLEDGMENTS
The authors would like to express their gratitude to
The Human Research Tissue Bank who is supported by the
National Institute of Health Research (NIHR)-Cambridge
Biomedical Research Centre at the Cambridge University Hospitals NHS Foundation Trust for help with accessing
the tissue used in this study.
CONFLICTS OF INTEREST
No competing financial interests.GRANT SUPPORT
The National Institute for Health Research (NIHR)
Cambridge Biomedical Research Centre (RSA, JRB, AYW, PHM), Kidney Research UK (RSA, JW, SP, JRB), NIH grant R01-HL36003 (JSP), Cancer research UK grant RG75464 (TE), The Welcome Trust (NB, PHM), NSFC
(national natural science foundation of China) grant 81400278 (JY), Medical Research Council Cancer Unit
(SV), Belgian grants (Interuniversity Attraction Poles), Flemish grants (Methusalem grant (BOF09/01M00709)
and grants from the Research Foundation Flanders and Foundation against Cancer, Ghent University grants and
grants from Flanders Institute for Biotechnology (VIB)
(PV).
REFERENCES
1. Coppin C, Kollmannsberger C, Le L, Porzsolt F, Wilt TJ. Targeted therapy for advanced renal cell cancer (RCC): a Cochrane systematic review of published randomised trials.
BJU Int. 2011; 108: 1556-1563.
2. Ivan M, Kaelin WG, Jr. The von Hippel-Lindau tumor suppressor protein. Curr Opin Genet Dev. 2001; 11: 27-34. 3. Karakiewicz PI, Trinh QD, Bhojani N, Bensalah K,
Salomon L, de la Taille A, Tostain J, Cindolo L, Altieri V, Ficarra V, Schips L, Zigeuner R, Mulders PF, Valeri A, Descotes JL, Mejean A, et al. Renal cell carcinoma
with nodal metastases in the absence of distant metastatic
disease: prognostic indicators of disease-specific survival.
Eur Urol. 2007; 51: 1616-1624.
4. Linehan WM, Zbar B. Focus on kidney cancer. Cancer Cell.
2004; 6: 223-228.
5. Siegel R, Naishadham D, Jemal A. Cancer statistics, 2012. CA Cancer J Clin. 2012; 62: 10-29.
6. Miraglia S, Godfrey W, Yin AH, Atkins K, Warnke R, Holden JT, Bray RA, Waller EK, Buck DW. A novel
five-transmembrane hematopoietic stem cell antigen: isolation,
characterization, and molecular cloning. Blood. 1997; 90:
5013-5021.
7. Yin AH, Miraglia S, Zanjani ED, Almeida-Porada G, Ogawa M, Leary AG, Olweus J, Kearney J, Buck DW.
AC133, a novel marker for human hematopoietic stem and
progenitor cells. Blood. 1997; 90: 5002-5012.
8. Bertolini G, Roz L, Perego P, Tortoreto M, Fontanella E, Gatti L, Pratesi G, Fabbri A, Andriani F, Tinelli S, Roz E, Caserini R, Lo Vullo S, Camerini T, Mariani L, Delia D, et
al. Highly tumorigenic lung cancer CD133+ cells display stem-like features and are spared by cisplatin treatment.
www.impactjournals.com/oncotarget
9. Bussolati B, Brossa A, Camussi G. Resident stem cells and renal carcinoma. Int J Nephrol. 2011; 2011: 286985.
10. Bussolati B, Bruno S, Grange C, Buttiglieri S, Deregibus
MC, Cantino D, Camussi G. Isolation of renal progenitor cells from adult human kidney. Am J Pathol. 2005; 166: 545-555.
11. Bussolati B, Dekel B, Azzarone B, Camussi G. Human
renal cancer stem cells. Cancer Lett. 2013; 338: 141-146. 12. Collins AT, Berry PA, Hyde C, Stower MJ, Maitland NJ.
Prospective identification of tumorigenic prostate cancer stem cells. Cancer Res. 2005; 65: 10946-10951.
13. Eramo A, Lotti F, Sette G, Pilozzi E, Biffoni M, Di
Virgilio A, Conticello C, Ruco L, Peschle C, De Maria R.
Identification and expansion of the tumorigenic lung cancer
stem cell population. Cell Death Differ. 2008; 15: 504-514. 14. Ma S, Chan KW, Hu L, Lee TK, Wo JY, Ng IO, Zheng BJ,
Guan XY. Identification and characterization of tumorigenic
liver cancer stem/progenitor cells. Gastroenterology. 2007; 132: 2542-2556.
15. Monzani E, Facchetti F, Galmozzi E, Corsini E, Benetti A, Cavazzin C, Gritti A, Piccinini A, Porro D, Santinami
M, Invernici G, Parati E, Alessandri G, La Porta CA.
Melanoma contains CD133 and ABCG2 positive cells with
enhanced tumourigenic potential. Eur J Cancer. 2007; 43:
935-946.
16. Neuzil J, Stantic M, Zobalova R, Chladova J, Wang X, Prochazka L, Dong L, Andera L, Ralph SJ.
Tumour-initiating cells vs. cancer 'stem' cells and CD133: what's
in the name? Biochem Biophys Res Commun. 2007; 355: 855-859.
17. Ricci-Vitiani L, Lombardi DG, Pilozzi E, Biffoni M, Todaro M, Peschle C, De Maria R. Identification and
expansion of human colon-cancer-initiating cells. Nature. 2007; 445: 111-115.
18. Singh SK, Clarke ID, Terasaki M, Bonn VE, Hawkins C, Squire J, Dirks PB. Identification of a cancer stem cell in
human brain tumors. Cancer Res. 2003; 63: 5821-5828.
19. Singh SK, Hawkins C, Clarke ID, Squire JA, Bayani J, Hide T, Henkelman RM, Cusimano MD, Dirks PB. Identification
of human brain tumour initiating cells. Nature. 2004; 432:
396-401.
20. Varna M, Gapihan G, Feugeas JP, Ratajczak P, Tan S, Ferreira I, Leboeuf C, Setterblad N, Duval A, Verine J, Germain S, Mongiat-Artus P, Janin A, Bousquet G. Stem
cells increase in numbers in perinecrotic areas in human
renal cancer. Clin Cancer Res. 2015; 21: 916-924.
21. Ward HH, Romero E, Welford A, Pickett G, Bacallao R, Gattone VH, 2nd, Ness SA, Wandinger-Ness A, Roitbak T.
Adult human CD133/1(+) kidney cells isolated from papilla
integrate into developing kidney tubules. Biochim Biophys
Acta. 2011; 1812: 1344-1357.
22. Zhang Y, Sun B, Zhao X, Liu Z, Wang X, Yao X, Dong X, Chi J. Clinical significances and prognostic value of cancer
stem-like cells markers and vasculogenic mimicry in renal
cell carcinoma. J Surg Oncol. 2013; 108: 414-419.
23. Wu Y, Wu PY. CD133 as a marker for cancer stem cells:
progresses and concerns. Stem Cells Dev. 2009; 18:
1127-1134.
24. Florek M, Haase M, Marzesco AM, Freund D, Ehninger G,
Huttner WB, Corbeil D. Prominin-1/CD133, a neural and
hematopoietic stem cell marker, is expressed in adult human differentiated cells and certain types of kidney cancer. Cell
Tissue Res. 2005; 319: 15-26.
25. Immervoll H, Hoem D, Sakariassen PO, Steffensen OJ,
Molven A. Expression of the "stem cell marker" CD133
in pancreas and pancreatic ductal adenocarcinomas. BMC
Cancer. 2008; 8: 48.
26. Karbanova J, Missol-Kolka E, Fonseca AV, Lorra C, Janich
P, Hollerova H, Jaszai J, Ehrmann J, Kolar Z, Liebers C, Arl S, Subrtova D, Freund D, Mokry J, Huttner WB, Corbeil D.
The stem cell marker CD133 (Prominin-1) is expressed in various human glandular epithelia. J Histochem Cytochem.
2008; 56: 977-993.
27. Kim K, Ihm H, Ro JY, Cho YM. High-level expression of stem cell marker CD133 in clear cell renal cell carcinoma
with favorable prognosis. Oncol Lett. 2011; 2: 1095-1100.
28. Lardon J, Corbeil D, Huttner WB, Ling Z, Bouwens L. Stem cell marker prominin-1/AC133 is expressed in duct
cells of the adult human pancreas. Pancreas. 2008; 36: e1-6.
29. Bruno S, Bussolati B, Grange C, Collino F, Graziano ME,
Ferrando U, Camussi G. CD133+ renal progenitor cells
contribute to tumor angiogenesis. Am J Pathol. 2006; 169:
2223-2235.
30. Costa WH, Rocha RM, Cunha IW, Fonseca FP, Guimaraes
GC, Zequi Sde C. CD133 immunohistochemical expression
predicts progression and cancer-related death in renal cell carcinoma. World J Urol. 2012; 30: 553-558.
31. D'Alterio C, Cindolo L, Portella L, Polimeno M, Consales
C, Riccio A, Cioffi M, Franco R, Chiodini P, Carteni G, Mirone V, Longo N, Marra L, Perdona S, Claudio L,
Mascolo M, et al. Differential role of CD133 and CXCR4
in renal cell carcinoma. Cell Cycle. 2010; 9: 4492-4500.
32. Szlosarek P, Charles KA, Balkwill FR. Tumour necrosis
factor-alpha as a tumour promoter. Eur J Cancer. 2006; 42: 745-750.
33. Lee CP, Patel PM, Selby PJ, Hancock BW, Mak I, Pyle L, James MG, Beirne DA, Steeds S, A'Hern R, Gore
ME, Eisen T. Randomized phase II study comparing thalidomide with medroxyprogesterone acetate in patients with metastatic renal cell carcinoma. J Clin Oncol. 2006;
24: 898-903.
34. Harrison ML, Obermueller E, Maisey NR, Hoare S,
of infliximab at standard and high dose. J Clin Oncol. 2007; 25: 4542-4549.
35. Daliani DD, Eisenberg PD, Weems J, Lord R, Fueger R, Logothetis CJ. The results of a phase II randomized trial
comparing 5-fluorouracil and 5-fluorouracil plus
alpha-interferon: observations on the design of clinical trials for
androgen-independent prostate cancer. J Urol. 1995; 153: 1587-1591.
36. Carswell EA, Old LJ, Kassel RL, Green S, Fiore N, Williamson B. An endotoxin-induced serum factor that causes necrosis of tumors. Proc Natl Acad Sci U S A. 1975;
72: 3666-3670.
37. Al-Lamki RS, Sadler TJ, Wang J, Reid MJ, Warren AY, Movassagh M, Lu W, Mills IG, Neal DE, Burge J, Vandenebeele P, Pober JS, Bradley JR. Tumor necrosis
factor receptor expression and signaling in renal cell
carcinoma. Am J Pathol. 2010; 177: 943-954.
38. Shapiro GI, Harper JW. Anticancer drug targets: cell cycle and checkpoint control. J Clin Invest. 1999; 104:
1645-1653.
39. Hermansen SK, Christensen KG, Jensen SS, Kristensen BW. Inconsistent immunohistochemical expression patterns
of four different CD133 antibody clones in glioblastoma. J
Histochem Cytochem. 2011; 59: 391-407.
40. Al-Lamki RS, Wang J, Vandenabeele P, Bradley JA, Thiru S, Luo D, Min W, Pober JS, Bradley JR. TNFR1- and
TNFR2-mediated signaling pathways in human kidney
are cell type-specific and differentially contribute to renal injury. FASEB J. 2005; 19: 1637-1645.
41. Moggio A, D'Armento G, Bussolati B. Efficient stem cell
isolation from under vacuum preserved tissue samples. Organogenesis. 2012; 8: 71-75.
42. Iida H, Suzuki M, Goitsuka R, Ueno H. Hypoxia induces
CD133 expression in human lung cancer cells by
up-regulation of OCT3/4 and SOX2. Int J Oncol. 2012; 40: 71-79.
43. Canis M, Lechner A, Mack B, Zengel P, Laubender RP,
Koehler U, Heissmeyer V, Gires O. CD133 induces
tumour-initiating properties in HEK293 cells. Tumour Biol. 2013;
34: 437-443.
44. Hishikawa K, Takase O, Yoshikawa M, Tsujimura T,
Nangaku M, Takato T. Adult stem-like cells in kidney.
World J Stem Cells. 2015; 7: 490-494.
45. Lindgren D, Bostrom AK, Nilsson K, Hansson J, Sjolund J,
Moller C, Jirstrom K, Nilsson E, Landberg G, Axelson H, Johansson ME. Isolation and characterization of progenitor-like cells from human renal proximal tubules. Am J Pathol. 2011; 178: 828-837.
46. Lu B, Chiou SH, Deutsch E, Lorico A. Cancer stem cells. J Oncol. 2011; 2011: 269437.
47. Peng S, Maihle NJ, Huang Y. Pluripotency factors Lin28
and Oct4 identify a sub-population of stem cell-like cells in
ovarian cancer. Oncogene. 2010; 29: 2153-2159.
48. Bussolati B, Maeshima A, Peti-Peterdi J, Yokoo T, Lasagni L. Renal Stem Cells, Tissue Regeneration, and Stem Cell Therapies for Renal Diseases. Stem Cells Int. 2015; 2015: 302792.
49. Gupta S, Verfaillie C, Chmielewski D, Kren S, Eidman K, Connaire J, Heremans Y, Lund T, Blackstad M, Jiang Y,
Luttun A, Rosenberg ME. Isolation and characterization of
kidney-derived stem cells. J Am Soc Nephrol. 2006; 17:
3028-3040.
50. Sagrinati C, Netti GS, Mazzinghi B, Lazzeri E, Liotta F, Frosali F, Ronconi E, Meini C, Gacci M, Squecco R, Carini
M, Gesualdo L, Francini F, Maggi E, Annunziato F, Lasagni L, et al. Isolation and characterization of multipotent
progenitor cells from the Bowman's capsule of adult human kidneys. J Am Soc Nephrol. 2006; 17: 2443-2456.
51. Weigmann A, Corbeil D, Hellwig A, Huttner WB. Prominin, a novel microvilli-specific polytopic membrane
protein of the apical surface of epithelial cells, is targeted to plasmalemmal protrusions of non-epithelial cells. Proc Natl
Acad Sci U S A. 1997; 94: 12425-12430.
52. Liu X, Chen L, Jiang Z, Wang J, Su Z, Li G, Yu S, Liu Z. Malignant behaviorial characteristics of CD133(+/-)
glioblastoma cells from a Northern Chinese population. Exp Ther Med. 2013; 5: 65-72.
53. Feng JM, Miao ZH, Jiang Y, Chen Y, Li JX, Tong LJ, Zhang J, Huang YR, Ding J. Characterization of the
conversion between CD133+ and CD133- cells in colon
cancer SW620 cell line. Cancer Biol Ther. 2012; 13: 1396-1406.
54. Wang R, Chadalavada K, Wilshire J, Kowalik U, Hovinga
KE, Geber A, Fligelman B, Leversha M, Brennan C,
Tabar V. Glioblastoma stem-like cells give rise to tumour
endothelium. Nature. 2010; 468: 829-833.
55. Aravantinos G, Isaakidou A, Karantanos T, Sioziou A,
Theodoropoulos GE, Pektasides D, Gazouli M. Association of CD133 polymorphisms and response to bevacizumab in
patients with metastatic colorectal cancer. Cancer Biomark.
2015; 15: 843-850.
56. Al-Lamki RS, Mayadas TN. TNF receptors: signaling
pathways and contribution to renal dysfunction. Kidney Int.
2015; 87: 281-296.
57. Wang J, Al-Lamki RS. Tumor necrosis factor receptor 2: its contribution to acute cellular rejection and clear cell renal carcinoma. Biomed Res Int. 2013; 2013: 821310.
58. Allavena P, Garlanda C, Borrello MG, Sica A, Mantovani A. Pathways connecting inflammation and cancer. Curr
Opin Genet Dev. 2008; 18: 3-10.
59. Allavena P, Sica A, Solinas G, Porta C, Mantovani A. The inflammatory micro-environment in tumor progression:
the role of tumor-associated macrophages. Crit Rev Oncol
Hematol. 2008; 66: 1-9.
60. Germano G, Allavena P, Mantovani A. Cytokines as a key
www.impactjournals.com/oncotarget
61. de Vivar Chevez AR, Finke J, Bukowski R. The role of inflammation in kidney cancer. Adv Exp Med Biol. 2014; 816: 197-234.
62. Zhang L, Jiao M, Wu K, Li L, Zhu G, Wang X, He D, Wu
D. TNF-alpha induced epithelial mesenchymal transition increases stemness properties in renal cell carcinoma cells.
Int J Clin Exp Med. 2014; 7: 4951-4958.
63. Ostyn P, El Machhour R, Begard S, Kotecki N, Vandomme J, Flamenco P, Segard P, Masselot B, Formstecher P,
Touil Y, Polakowska R. Transient TNF regulates the self-renewing capacity of stem-like label-retaining cells in sphere and skin equivalent models of melanoma. Cell
Commun Signal. 2014; 12: 52.
64. Ueda M, Fujisawa T, Ono M, Hara ES, Pham HT, Nakajima R, Sonoyama W, Kuboki T. A short-term treatment with
tumor necrosis factor-alpha enhances stem cell phenotype
of human dental pulp cells. Stem Cell Res Ther. 2014; 5:
31.
65. Sun C, Song H, Zhang H, Hou C, Zhai T, Huang L, Zhang
L. CD133 expression in renal cell carcinoma (RCC) is correlated with nuclear hypoxia-inducing factor 1alpha (HIF-1alpha). J Cancer Res Clin Oncol. 2012; 138:
1619-1624.
66. Hashimoto O, Shimizu K, Semba S, Chiba S, Ku Y,
Yokozaki H, Hori Y. Hypoxia induces tumor aggressiveness and the expansion of CD133-positive cells in a hypoxia-inducible factor-1alpha-dependent manner in pancreatic
cancer cells. Pathobiology. 2011; 78: 181-192.
67. Soeda A, Park M, Lee D, Mintz A, Androutsellis-Theotokis A, McKay RD, Engh J, Iwama T, Kunisada T, Kassam AB,
Pollack IF, Park DM. Hypoxia promotes expansion of the CD133-positive glioma stem cells through activation of
HIF-1alpha. Oncogene. 2009; 28: 3949-3959.
68. Al-Lamki RS, Lu W, Wang J, Yang J, Sargeant TJ, Wells R, Suo C, Wright P, Goddard M, Huang Q, Lebastchi AH, Tellides G, Huang Y, Min W, Pober JS, Bradley JR.
TNF, acting through inducibly expressed TNFR2, drives
activation and cell cycle entry of c-Kit+ cardiac stem cells
in ischemic heart disease. Stem Cells. 2013; 31: 1881-1892. 69. Loetscher H, Stueber D, Banner D, Mackay F, Lesslauer W.
Human tumor necrosis factor alpha (TNF alpha) mutants
with exclusive specificity for the 55-kDa or 75-kDa TNF receptors. J Biol Chem. 1993; 268: 26350-26357.
70. Kovacs G, Akhtar M, Beckwith BJ, Bugert P, Cooper CS, Delahunt B, Eble JN, Fleming S, Ljungberg B, Medeiros LJ, Moch H, Reuter VE, Ritz E, Roos G, Schmidt D, Srigley JR, et al. The Heidelberg classification of renal cell tumours. J Pathol. 1997; 183: 131-133.
71. Fuhrman SA, Lasky LC, Limas C. Prognostic significance
of morphologic parameters in renal cell carcinoma. Am J
Surg Pathol. 1982; 6: 655-663.
72. Guinan P, Sobin LH, Algaba F, Badellino F, Kameyama S, MacLennan G, Novick A. TNM staging of renal cell
carcinoma: Workgroup No. 3. Union International Contre le Cancer (UICC) and the American Joint Committee on
Cancer (AJCC). Cancer. 1997; 80: 992-993.
73. Van Ostade X, Vandenabeele P, Tavernier J, Fiers W. Human tumor necrosis factor mutants with preferential binding to and activity on either the R55 or R75 receptor.
Eur J Biochem. 1994; 220: 771-779.
74. Gavrieli Y, Sherman Y, Ben-Sasson SA. Identification of programmed cell death in situ via specific labeling of nuclear DNA fragmentation. J Cell Biol. 1992; 119: 493-501.
75. Shen K, Song N, Kim Y, Tian C, Rice SD, Gabrin MJ, Symmans WF, Pusztai L, Lee JK. A systematic evaluation
of multi-gene predictors for the pathological response of
breast cancer patients to chemotherapy. PLoS One. 2012; 7: e49529.
76. Zhao H, Yuan X, Li D, Chen H, Jiang J, Wang Z, Sun X, Zheng Q. Isoliquiritigen enhances the antitumour activity
and decreases the genotoxic effect of cyclophosphamide.