Localizing the charged side chains of ion channels
within the crowded charge models
Justin J. Finnerty,
†Robert Eisenberg,
‡and Paolo Carloni
∗,¶Computational Biophysics, German Research School for Simulation Sciences, 52425 Jülich,
Germany, Department of Molecular Biophysics and Physiology, Rush University, Chicago IL
60612, United States of America, and Computational Biophysics, German Research School for
Simulation Sciences , 52425 Jülich, Germany and Institute for Advanced Simulation IAS-5,
Computational Biomedicine, Forschungszentrum Jülich, 52425 Jülich, Germany
E-mail: <[email protected]>
Abstract
The simplified coarse grained models of selectivity of Nonner, Eisenberg and co-workers predict
ion selectivity for a variety of different ion channels. The model includes the charged atoms of
the channel’s charged residues and permeant ions. However its MC implementation does not take
advantage of the increasingly large body of structural information available. Here, we introduce
the location of the channel’s charged residues in to the model’s Hamiltonian. In theDEKA Na+
channel this allow us to correlate the lysine’s topological location directly with the predicted
se-lectivity. In the NanC channel, from Escherichia coli, the dramatic variation in the resulting ion
∗To whom correspondence should be addressed
†Computational Biophysics, German Research School for Simulation Sciences, 52425 Jülich, Germany
‡Department of Molecular Biophysics and Physiology, Rush University, Chicago IL 60612, United States of
Amer-ica
Insti-population predicts novel selectivity regions and binding sites that can be directly correlated with
structural information. These results have well defined thermodynamic properties that are
signifi-cantly modified by structural detail allowing new insights with molecular detail.
Introduction
Ion selective channels are transmembrane proteins that allow the flow of ions such as Na+1–10,
K+11–20, Ca2+21–28 and Cl−29–32 into and out of a cell. Measured selectivities for ion channels
are typically small, ranging from a modest 5−10 : 1 for Na+ over Ca2+ in sodium channels to
1000 : 1 for Ca2+over Na+in calcium channels33. This means an ion channel achieves selectivity
by very small (a fewkBT) energy differences compared to the energies of ordinary covalent bonds.
Experimental work carried out in ionic concentrations ranging from 10−7M to 1.0 M has greatly
facilitated the investigation of molecular mechanisms governing the selectivity.
Computations have also helped us understand the mechanism and energetics of selectivity. On
one hand, a variety of molecular simulation methods have been used to estimate the free energy
of ion permeation through ion channels, for which structural information is available (such as K+
channels17–20 and recently a bacterial Na+ channel34,35). However, these simulations have not
studied the wide range of ion concentrations used in experiment. On the other hand, coarse-grain
methods such as the charge space competition (CSC) models of Nonner and Eisenberg36–44, some
using the induced charge computation (IC) method45, employ a Hamiltonian based only on
electro-statics and volume exclusion in a Monte Carlo (MC) simulation, to provide quantitative predictions
of selectivity in Na+46, L-type Ca2+47–50and RyR Ca2+51–56channels. These predictions come
from the output ion density profiles simulated over a wide range of well-defined concentrations.
The fact that the CSC model reproduces the selectivity of such a large class of ion channels shows
the critical involvement of electrostatic interactions in determining selectivity. However, because
the relationship of the simplified structure used so far in the charge space competition models to the
is still unclear.67
The charge space competition model uses drastic approximations to structure; representing the
ion channel protein as a thick walled tube with rounded edges. These simplifications to the
geome-try allow the CSC model Hamiltonian to use the Poisson-Boltzmann equation directly, instead of a
generalized Born model, when computing the electrostatic interactions (UIC) between the induced
charge on the protein-water dielectric boundary and all charged ions (in a computationally efficient
manner.) The Hamiltonian also includes contributions for the exact pair-wise screened Coulomb
potential (UC) and hard object overlap (Uoverlap) (see Methods section below for more details).
Charged amino acid residues from the ion channel (structural ions, ions modeled as charged
spheres) are restricted inside a hard-walled cylinder representing the selectivity filter (shown as the
light blue cylinder in Fig. 1a and Fig. 2a and b). We refer to this model as the flexible charge space
competition (FCC) model (named from Giri et al.60) to indicate the structural ions are confined
only inside this cylinder. Taking into accountwhere the charge bearing atoms of the side-chains
are located could allow the molecular mechanism of selectivity determined from the model to be
more directly compared with atomistic models. Here we present a localization procedure similar
to Yu et al19, which we call the localized charge space competition (LCC) model, that extends the
FCC implementation to introduce a parabolic potential well on the positions of the structural ions
(UR,i). We use the LCC in two ways, to study the impact of particle location in an abstract model
on the prediction of selectivity (focussing on the DEKA Na+ channel) and to take an atomistic
structure from experiment to screen for areas of potential interest for further experimental and
computational studies (focussing on the NanC channel68).
FCC calculations have been previously carried out46 on theDEKANa+ channel from
eukary-otes, with a geometry36,69,70 derived from sieving experiments using Pauling radii ions71. The
importance of the lysine residue on selectivity is known, although the mechanism of action is still
debated72. Here we use LCC to investigate how the location of the lysine charge in our model
selectivity as the equilibrium constant of the reaction74
M1+ (X·M2)filter
KM1,M2
M2+ (X·M1)filter (1)
where M1 and M2 are two ions outside channel X, competing to occupy, (X·M1)filter and (X·
M2)filter respectively, the selectivity filter region of channel X (Eqn. 1). This definition is
appropri-ate here as the model evaluappropri-ates the system under equilibrium conditions; we make no assumption
of a relationship between this measure and the selectivities measured from experiment. The
equi-librium constant KM1,M2 reads
KM1,M2 =
[X·M1] [M2]
[X·M2] [M1]
(2)
where [X·Mi] is evaluated as the occupancy of ion Mi in sub-intervals of the selectivity filter
model (shown as a brown line in Fig. 1c,d). The sub-interval is scanned along the channel pore to
determine which part of the ion density profile most closely predicts the experimental selectivities.
In this way the region of our model that contains the features responsible for selectivity can be
found.
The reported FCC model of the DEKANa+ channel has structural ion density profiles46 that
clearly show a−+−charge pattern (+refers to the lysine residue,−to E or D; patterns described
in Fig. 1e) dominates the structural ion density profile of the model, although small peaks of
positive ion density at either end indicate that populations of − −+ and +− − charge patterns
(see Fig. 1e) are also present. The self-organization into a−+−pattern is hardly surprising as it
maximizes both the separation of same charged side-chains and interaction between the oppositely
charged side-chains. In the FCC model the key sub-interval corresponds to the center of the channel
which is also the main location of the positive lysine ion. However, the center of the model is also
the key sub-interval found by FCC for the L-type Ca2+ channel47 which has no positive structural
FCC. Using LCC we can now investigate these different topological charge patterns separately and
study the impact they have on the selectivity, noting that the symmetry of our simulation makes
− −+ and +− − equivalent here. In this way LCC can demonstrate whether the selectivity is
associated with the central part of the pore model or the position of the lysine. Without localization
the importance of the lysine in any correlation with selectivity can only be inferred by our model.
We also applied LCC to a quite different channel that has many more charged residues within
the pore. The X-ray structure68 of N-acetylneuraminic acid-inducible outer-membrane
chan-nel (NanC) from Escherichia coli, a member of the oligogalacturonate-specific monomeric porin
(KdgM) family, was recently published. We therefore construct our simulation with structural
ion localisation based directly on the experimental structural information (see Methods for more
details).
In contrast to L-type Ca2+ channels49,50, the DEKA Na+ channel and the RyR Ca2+
recep-tor51–56, so far no signature selectivity motif related to NanC’s function has been identified in
its primary structure. This channel features a wide, long pore lined with an approximately equal
number of positively and negatively charged amino acid side chains, thirty in total (Fig. 2a and
Table S3 in supplementary information). We can use LCC as a tool to rapidly screen for areas and
residues that lie within the channel pore that are of potential interest for further experimental and
computational studies. As we show in the next section, these predictions could not have been made
without the high resolution structural information.
Results/Discussion
We now discuss applying the FCC and LCC methods on the DEKA Na+ channel to investigate
the role of the lysine in theDEKAsequence (for simulation details refer to the Methods section).
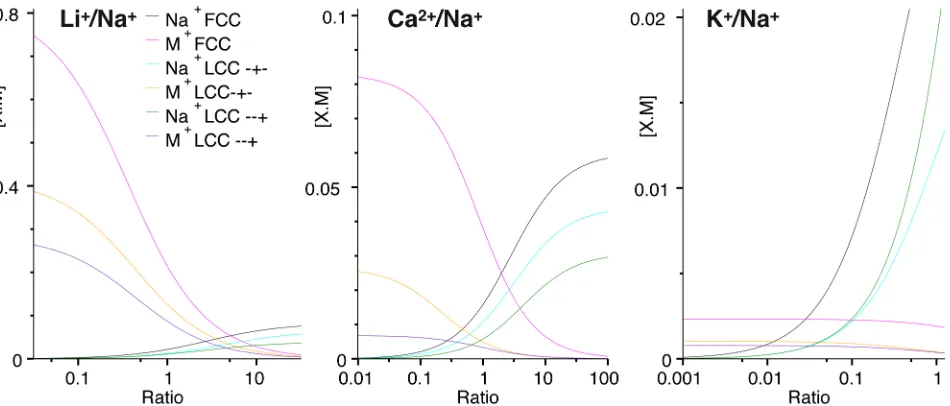
In sodium channels, the selectivity of Na+ over Li+ and K+ is largely in inverse proportion to
the volume of the ions33. Our results for selectivity in the FCC and LCC with −+− pattern
line in Fig. 1b, the zero point is the center of the channel and the selectivity filter occupies the
region[−5 : 5Å]). We find that localizing the side chains to give the− −+pattern (see Fig. 1e)
dramatically changes the Na+, K+, Ca2+ and Li+ ion density along the channel axis compared
to the original model. For the LCC with− −+ pattern the key sub-interval is located where the
lysine is localized at -2Å (interval[−3 :−1Å], brown line below Fig. 1d). The LCC simulations
on the−+−patterns (interval[−2.5 : 2.5Å]) and− −+(interval[−3 :−1Å]) patterns had similar
selectivity for Na+ over Ca2+ (Table 1). This selectivity was different from our value from the
FCC model. With LCC we see Ca2+ ion density is smaller than Na+ density at the location of
the lysine side-chain (Fig. 1c and d; 0 and -2Å respectively), while in the FCC profiles there is
only an increase in Ca2+ ion density at the location of D/E residues (Fig. 1b; +2 and -2Å). On the
other hand, localizing the sides chains to give the−+−pattern changes the predicted selectivity
with minimal change in the ion density along the channel axis. We conclude that the improvement
in the predicted calcium selectivity is due, at least in part, to the localization scheme making it
more difficult for the D and E side-chains to mitigate the repulsion between the doubly charged
cation and the now-localized lysine side-chain as the cation passes along the channel, regardless
of the charge pattern. Using LCC we can therefore demonstrate that selectivity is associated with
the the position of the lysine. As is particularly noticeable for the − −+ pattern (Fig. 1d), the
sub-interval is associated with a minima in the solute ion profile (at -2Å) and not the maxima (at
1.2Å), demonstrating that the model predicts that selectivity is based on passing an energy barrier
associated with repulsion between the lysine and the solute cation and not on a binding of the
solute cation to the anionic side chains.
We also found the density profiles from the FCC model can be approximated as the weighted
sum of the density profiles from the LCC model (as seen in Fig. 4),
ρ(FCC)u2×ρ(LCC,−+−) +1
2ρ(LCC,− −+) + 1
2ρ(LCC,+− −) (3)
pore axis). Because it can be approximated as the sum of(−+−)and(− −+)profiles the FCC
model can therefore be used as a common point for comparing the two LCC results. The similar
magnitude of the weighting factors demonstrates the(− −+)profile is not a direct response to the
presence of a solute ion which are only present in the channel in less than one hundredth of the
MC configurations. While the approximations of the model are too crude to obtain a quantitative
difference in energy, the low weighting factor implies that, from the electrostatic perspective, a
number of significantly different side-chain conformations may contribute to the mechanism of
selectivity in the Na+ channel.
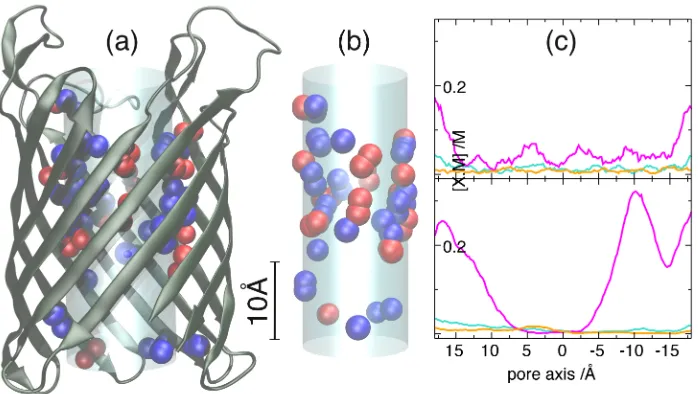
In the NanC channel (See Fig. 2), we find that the population of the permeating ions show
dramatic differences between the FCC and LCC calculations (Fig. 2c). The anion population from
the LCC method (2c right) has a minima between -2 and 6Å and maxima that are higher than
the chloride concentration in the bulk solution at 14 and -10Å. Our results from the Na+ channel
suggest the minima in the anion concentration could be a putative anion selectivity region. This
means that the residues ARG6, GLU17, ASP54, ARG107, ASP109, ARG129, GLU168, ASP188,
and ARG208 may be involved in selectivity for different anions. The maxima with higher than
bulk concentration suggest the presence of anion binding sites at 13Å based on LYS111 and/or
LYS153 and at -10Å based on LYS91. There may also be a peak in the region of -15Å suggesting
another binding site is associated with ARG72.
The ion density profiles in the LCC calculations differ from those of FCC. We first saw this
in the density of the cations in the Na+ channel model with the− −+localization pattern. This
change is even more striking in the NanC channel where LCC gives a very definite pattern (Fig. 2c
left). In this case we see a variation in the chloride profile that is a direct response to the more
realistic distribution of the pore’s charged side chains.
The results demonstrate that the inclusion of structural information from experiment directly
leads to changes in the predicted population density within the model pore. These changes allow
us to postulate residues of potential interest to other researchers investigating the selectivity of
the measuring interval required to reproduce the experimental selectivities in the Na+ channel
model to be directly related to a particular charged side-chain. This demonstrates the utility of the
LCC method to incorporate structural information which can lead to mechanistic insights in the
study of ion channels.
Methods
Theoretical model
Each channel is modeled as a thick walled tube with rounded edges that provides a pore (Fig. 1a)
separating two baths, essentially as done in a series of papers by Nonner, Eisenberg and colleagues
(see Boda et al.46). The solute ions can travel to any region of the system. For FCC, the structural
ions (from the channel’s charged side-chains) are found anywhere in a hard-walled cylinder
rep-resenting theselectivity filter of the pore (shown in light blue in Fig. 1a). Hard spheres of radius
Riand bearing a charge ofqi represent both the structural ions and the permeating ions (see Table
2). The CSC models compute the distribution of ions as outputs of the model. The only energies
in the FCC model are the electrostatics in the Hamiltonian and the steric repulsion implicit in the
rejection of overlapped spheres. Thus the coarse-grain potential energy of the Hamiltonian, U,
(Eqn. 4) is made of the ion–ion pair-wise Coulomb electrostatic interaction (UC, Eqn. 5), the
elec-trostatic interaction between ions and the induced charge at the dielectric boundary between the
protein and aqueous media in the model (UIC, Eqn. 6) and the overlap repulsion energy (See Sec.
S2 in supplementary information for more details). The effect of uncharged polar and non-polar
residues are considered implicitly by the dielectric constant of the protein that, along with the
sol-vent, defines the permittivity change at the dielectric boundary used inUIC. A continuum model is
used for the solvent based on the solvent’s permittivity screening of the charge–charge interactions
U =
UC+UIC : no overlap
∞ : otherwise.
(4)
whereUCis a standard screened Coulomb interaction defined for particleias
UC,i=
∑
jqiqj
1
εi+ 1
εj
2ri−rj
: for all particles j6=i (5)
whereqxis the charge,pxis the position, andεxis the dielectric constant of the environment around
particle x. The dielectric boundary potential (UIC) is represented by discretizing the boundary
surface into a series of tiles. This gives the Coulomb interaction contribution for particle i and
each tilekas
UIC,i=
∑
kqiqk
2|ri−rk|: for all protein surface tilesk (6)
where rk is the centre-point of the surface tile and qk is the induced charge computed using the
Poisson-Boltzmann equation using the IC discretized integral method45.
The LCC method introduced here puts additional constraints on the motion of the structural
ions. It differs from the hard-walled cylinder restriction of the FCC by the addition of a new term in
the potential energy function to localize each structural ioni. The localization closely follows that
of the confined micro-droplet model of Yu et al19and consists of a harmonic potentialUR,idefined
by a global constant kf with per-ion localization centre-points r0,i and maximum displacements
Rf,i
UR,i=
− kf R2f,i
ri−r0,i 2
:ri−r0,i 6Rf,i
∞ :ri−r0,i >Rf,i
(7)
Here we use a spring-like constant of kf
R2f,i compared to the single λg used by Yu et al.. This was
considered more reasonable than a single constant as a particle with a smaller maximum radiusRf,i
to read U =
UC+UIC+∑ i
UR,i : no overlap
∞ : overlap
(8)
where the sum is taken over all the localized structural ions.
The globalkf modulates the influence that the localization potential has on the total potential
energy, and the cut-off,Rf,i, ensures that the localization is never completely lost ifkf approaches
zero. The total localization potential is therefore bounded between zero and the number of
local-ized ions times kf. Yu et al. estimated a value for λg of 0.5-1.0 kcal/mol/Å 2
from MD of the
supposedly more rigid selectivity filter of KcsA K+ channel. Without access to an X-ray
struc-ture for the DEKA Na+ channel, the value kf to use was assessed empirically, with preliminary
calculations on the Na+ channel model carried out to determine a reasonable value for kf (See
Sec. S1 in the supplementary information). From these preliminary simulations the kf value of
1.24 (in units of kBT;≈3kJmol−1) was selected for theDEKA Na+ channel and also used in the
NanC simulations reported here. AsRf,i values used were 2Å and above, this is equivalent to a
λg value of less than 0.2 kcal/mol/Å 2
which Yu identified as allowing solute ion-structural ion
and structural ion-structural ion interactions to both significantly contribute to the potential energy.
Correspondingly, we found changes in kf have little effect on the qualitative results for the Na+
channel provided thatUR,i was about two orders of magnitude less than the electrostatic potential
terms (kf ≤3, Sec. S1 in the Supporting Information).
FCC and LCC calculations of a model
DEKA
Na
+channel
To calculate ion selectivity, Metropolis Monte Carlo simulations based on the potentialU were
carried out in the grand canonical ensemble (TVµM1,µM2)42,46,49,75,76. CSC evaluates the
concen-tration of the ion occupying the channel ([X·Mx] (x=1,2)in Eqn. 2) as a function of varying bulk
so that the [M1] and [M2] vary systematically while maintaining the total ionic strength constant.
[X·M1]and[X·M2]are then represented by mean occupancy valuesbM1 andbM2 (band
concen-tration ratio R notation from4) of M1 and M2, respectively, in a measurement interval within the
selectivity filter (See Eqn. S2 in the supplementary information). The measurement intervals used
are selected to best reproduce the experimental selectivities.
For theDEKANa+ channel structural information is not available. Therefore we chose ther0,i
to match the respective density maxima from the reported FCC model46; which gave us the−+−
pattern (see Fig. 1e) with a carboxylic acid localized at+2 and−2Å and the lysine ammonium at
0Å. We exchanged the axial positions of the lysine and one carboxylic acid to produce the− −+
model. Rf,i was set to the same value as the pore radius; this was considered reasonable here
because the pore radius (3Å) is small.
While KM1,M2 can be calculated from Eqn. 2 at a single concentration ratio R, fittingbMi to the
standarddose-response curve:
bMi,i=
bMi,max
1+10(log(R50,Mi)−log(Ri))
(9)
and then taking the point where bM1 =bM2 (Eqn. S5 in supplementary information) gives the
following quadratic expression for KM1,M2:
(KM1,M2)
2·bM1,max
R50,M2
+KM1,M2·(bM1,max−bM2,max)−bM2,max·R50,M1 =0 (10)
wherebx,maxare the fitted maximum occupancy and R50,xthe fitted ratio at fifty percent occupancy
(where R50,M2 is expressed in terms of the[M1]/[M2], as per R50,M1.)
The FCC set up as used in previous studies46 was used in this study and is only summarized
here. LCC calculations were performed with the exact same parameters as for the FCC set up
except for the addition of localization parameters for the the structural ions. The ion channel was
defined by a tube with internal radius of 3Å and external radius of 20Å. The selectivity region was
region changes to the bulk environment, was modeled by rounding the ends of the channel using an
arc of radius 5Å. This gave an overall length of the ion channel of 20Å. The dielectric constant of
the solvent was 80 and the protein was 10. The simulation temperature was 298K. The simulation
cell is a cylinder coaxial with the ion-channel pore. There was no periodicity used in the cell so
any interactions are based on the simple Cartesian displacement between objects. Sampling of the
ion concentrations in the bulk region was performed in a sub-region chosen to minimize effects
from the simulation cell boundaries (See supplementary information of Boda et al.49.)
Five particles in the pore represent the structural ions of the side-chains from the three charged
side chains in the pore. Two half-negative oxygen particles represent each carboxylic acid side
chain and one ammonium particle represents the side chain of the lysine. Simulations with
con-centration ratios up to 1:10 started with 150 solute ions; for example a [Na]/[Ca] ratio of 1:10
gives 98 Cl−, 5 Na+ and 47 Ca2+ ions. The number of solute particles, and correspondingly the
cell volume, was increased for larger concentration ratios so that none of the ion species started the
simulation with less than 2 particles. Because the number of particles changes due to the
grand-canonical trials, the number of each ion species was monitored and a warning given if the number
diverged by more than twice the square-root of the initial number. The ion densities used in the
mean for calculating[X·Mx]for the FCC and LCC−+−pattern were measured in the interval
[−2.5 : 2.5Å]and for LCC− −+pattern were measured in[−3 :−1Å], both relative to the
chan-nel pore center point (See Sec. S3 in supplementary information.) 1×10⁹MC trials or more were
carried out.
A series of simulations of theDEKANa+channel model were performed with various
concen-trations of LiCl, CaCl2and KCl in the presence of NaCl. The concentration ratio R (as[M]/[Na+])
for each cation M was varied at least from 0.01 to 100.0 while the ionic strength was maintained
FCC and LCC calculations of the NanC Channel from
Escherichia coli
As structural information is available for the NanC Channel, r0,i was set to the mean position
of the charged atom from the X-ray structure (PDB 2WJQ and 2WJR)68, and Rf,i was set to
the root mean square displacements (RMSD), derived from X-ray B-factors (using the classical
Biu8π2RMSD2). The translation of the NanC channel structure to our model involved some
ap-proximations. The determination of the cylindrical core length, of 36Å, and the vestibule regions,
of 10Å, was determined by simple observation of the structure. The internal radius used, of 7Å,
was chosen from the radius of Cα atoms of the cylinder backbone (12.5Å) from which we
sub-tracted an estimate of the volume of the non-charged parts of the side chains. We included all the
charged residues within the channel pore (≈ ±18Å of the protein centre point, shown in Fig. 2a and
listed in table S3 in the supplementary information). Those center-points that were outside the 7Å
radius were individually rescaled to bring them to about 1Å inside the channel model. The same
simulation procedure as for the Na+ channel above was used, differing only in the specification of
the channel geometry and locations of the structural ions.
Acknowledgements
The authors acknowledge the following help in the production of this work. The implementation
of localization into the LCC model was performed with the assistance of D. Boda and was based
on his FCC implementation. We are most grateful for his generous continual help. The parameters
used for the charged particles in the NanC channel were derived from MD simulations performed
by Paul Strodel in our lab. Financial funding from the Deutsche Forschungsgemeinschaft (DFG)
Supporting Information Available.
Further information is available on the following. Discussion of the results of the simulations with
varying kf that were used to determine the value used here. A more detailed description of the
potential energy terms. A more detailed description of the calculation of ion selectivity used here,
including the derivation of Eqn. 10. A table of the individual ion selectivities used to generate the
averages quoted in Tab. 1. A table of the coordinates of the charged atoms on the side chains of
NanC derived from the X-ray structure as used as input into our simulation. This information is
available free of charge via the Internet at http://pubs.acs.org/.
References
(1) Chandler, W. K.; Meves, H.J Physiol-London1965,180, 788.
(2) Binstock, L.; Lecar, H.J Gen Physiol1969,53, 342–361.
(3) Hille, B.J Gen Physiol1971,58, 599–619.
(4) Feldman, H. A.Anal Biochem1972,48, 317–338.
(5) Hille, B.J Gen Physiol1972,59, 637–658.
(6) Meves, H.; Vogel, W.J Physiol-London1973,235, 225–265.
(7) Binstock, L.J Gen Physiol1976,68, 551–562.
(8) Campbell, D. T.J Gen Physiol1976,67, 295–307.
(9) Ebert, G. A.; Goldman, L.J Gen Physiol1976,68, 327–340.
(10) Heinemann, S. H.; Teriau, H.; Stuhmer, W.; Imoto, K.; Numa, S.Nature1992,356, 441–443.
(11) Hille, B.J Gen Physiol1973,61, 669–686.
(13) Gay, L. A.; Stanfield, P. R.Pflugers Archiv-Eur J Physiol1978,378, 177–179.
(14) Reuter, H.; Stevens, C. F.J Membr Biol1980,57, 103–118.
(15) Blatz, A. L.; Magleby, K. L.Biophys J1984,45, A306.
(16) Taylor, P. S.J Physiol-London1987,388, 437–447.
(17) Aqvist, J.; Luzhkov, V.Nature2000,404, 881–884.
(18) Dudev, T.; Lim, C.J Am Chem Soc2009,131, 8092–8101.
(19) Yu, H.; Noskov, S. Y.; Roux, B.Proc Natl Acad Sci U S A2010,107, 20329–20334.
(20) Kim, I.; Allen, T. W.Proc Natl Acad Sci U S A2011,108, 17963–17968.
(21) Hess, P.; Lansman, J. B.; Tsien, R. W.J Gen Physiol1986,88, 293–319.
(22) Tsien, R. W.; Hess, P.; McCleskey, E. W.; Rosenberg, R. L.Ann Rev Biophys Biophys Chem
1987,16, 265–290.
(23) Yang, J.; Ellinor, P. T.; Sather, W. A.; Zhang, J. F.; Tsien, R. W.Nature1993,366, 158–161.
(24) Ellinor, P. T.; Yang, J.; Sather, W. A.; Zhang, J. F.; Tsien, R. W.Neuron1995,15, 1121–1132.
(25) Koch, S. E.; Bodi, I.; Schwartz, A.; Varadi, G.J Biol Chem2000,275, 34493–34500.
(26) Wu, X. S.; Edwards, H. D.; Sather, W. A.J Biol Chem2000,275, 31778–31785.
(27) Sather, W. A.; McCleskey, E. W.Annu Rev Physiol2003,65, 133–159.
(28) Ramachandran, S.; Serohijos, A. W. R.; Xu, L.; Meissner, G.; Dokholyan, N. V.PLoS Comput
Biol2009,5, e1000367.
(29) Bormann, J.; Hamill, O.; Sakmann, B.J Physiol-London1987,385, 243–286.
(31) Li, M.; McCann, J. D.; Welsh, M. J.Am J Physiol1990,259, C295–C301.
(32) Maduke, M.; Miller, C.; Mindell, J. A.Annu Rev Biophys Biomol Struct2000,29, 411–438.
(33) Hille, B.Ionic channels of excitable membranes, 2nd ed.; Sinauer Associates, Inc:
Sunder-land, Massachusetts, 1992.
(34) Furini, S.; Domene, C.PLoS Comput Biol2012,8, e1002476.
(35) Payandeh, J.; Scheuer, T.; Zheng, N.; Catterall, W. A.Nature2011,475, 353–358.
(36) Nonner, W.; Catacuzzeno, L.; Eisenberg, B.Biophys J2000,79, 1976–1992.
(37) Nonner, W.; Chen, D. P.; Eisenberg, B.Biophys J1998,74, 2327 – 2334.
(38) Nonner, W.; Eisenberg, B.Biophys J 1998,75, 1287–1305.
(39) Boda, D.; Busath, D. D.; Henderson, D.; Sokolowski, S.J Phys Chem B 2000, 104, 8903–
8910.
(40) Boda, D.; Henderson, D. D.; Busath, D. D.J Phys Chem B2001,105, 11574–11577.
(41) Boda, D.; Busath, D.; Eisenberg, B.; Henderson, D.; Nonner, W.Phys Chem Chem Physics
2002,4, 5154–5160.
(42) Boda, D.; Gillespie, D.; Nonner, W.; Henderson, D.; Eisenberg, B. Phys Rev E Stat Nonlin
Soft Matter Phys2004,69, 046702.
(43) Gillespie, D.; Nonner, W.; Henderson, D.; Eisenberg, R. S.Phys Chem Chem Physics2002,
4, 4763–4769.
(44) Nonner, W.; Gillespie, D.; Henderson, D.; Eisenberg, B. J Phys Chem B 2001, 105, 6427–
6436.
(46) Boda, D.; Nonner, W.; Valiskó, M.; Henderson, D.; Eisenberg, B.; Gillespie, D.Biophys J
2007,93, 1960–1980.
(47) Boda, D.; Valisko, M.; Henderson, D.; Eisenberg, B.; Gillespie, D.; Nonner, W.J Gen Physiol
2009,133, 497–509.
(48) Boda, D.; Nonner, W.; Henderson, D.; Eisenberg, B.; Gillespie, D.Biophys J2008,94, 3486–
3496.
(49) Boda, D.; Valiskó, M.; Eisenberg, B.; Nonner, W.; Henderson, D.; Gillespie, D.J Chem Phys
2006,125, 34901.
(50) Boda, D.; Valiskó, M.; Eisenberg, B.; Nonner, W.; Henderson, D.; Gillespie, D. Phys Rev
Lett2007,98, 168102.
(51) Gillespie, D.; Chen, H.; Fill, M.Cell Calcium2012,51, 427–433.
(52) Gillespie, D.; Giri, J.; Fill, M.Biophys J2009,97, 2212–2221.
(53) Gillespie, D.; Fill, M.Biophys J 2008,95, 3706–3714.
(54) Gillespie, D.; Boda, D.Biophys J 2008,95, 2658–2672.
(55) Gillespie, D.Biophys J 2008,94, 1169–1184.
(56) Wang, Y.; Xu, L.; Pasek, D. A.; Gillespie, D.; Meissner, G.Biophys J 2005,89, 256–265.
(57) Boda, D.; Giri, J.; Henderson, D.; Eisenberg, B.; Gillespie, D. J Chem Phys 2011, 134,
055102.
(58) Eisenberg, B.Fluct Noise Lett2012,11, 76–96.
(59) Eisenberg, B.Trans Faraday Soc2012,in, press.
(61) Eisenberg, B. Advances in Chemical Physics; John Wiley & Sons, Inc., 2011; Chapter
Crowded Charges in Ion Channels, pp 77–223.
(62) Krauss, D.; Eisenberg, B.; Gillespie, D.Eur Biophys J2011,40, 775–782.
(63) Krauss, D.; Gillespie, D.Eur Biophys J2010,39, 1513–1521.
(64) Eisenberg, R. S. B. Self-organized model of selectivity. 2008; http://www.ima.umn.
edu/2008-2009/W12.8-12.08/abstracts.html.
(65) Burger, M.; Eisenberg, R. S.; Engl, H.SIAM J Applied Math2007,67, 960–989.
(66) Eisenberg, B.Biophys Chem 2003, 100, 507–517, Special Issue in honor of John T. Edsall
(1902–2002).
(67) This contrasts to other coarse-graining approachs which have a well-defined relationship
be-tween structural information and model parameters: Noid, W. G.; Chu, J.-W.; Ayton, G. S.;
Krishna, V.; Izvekov, S.; Voth, G. A.; Das, A.; Andersen, H. C. J Chem Phys 2008, 128,
244114.
(68) Wirth, C.; Condemine, G.; Boiteux, C.; Bernèche, S.; Schirmer, T.; Peneff, C. M.J Mol Biol
2009,394, 718–731.
(69) Boda, D.; Henderson, D.; Eisenberg, B.; Gillespie, D.J Chem Phys2011,135, 064105.
(70) Gillespie, D.; Eisenberg, R. S.Eur Biophys J2002,31, 454–466.
(71) Dwyer, T. M.; Adams, D. J.; Hille, B.J Gen Physiol1980,75, 469–492.
(72) Lipkind, G. M.; Fozzard, H. A.J Gen Physiol2008,131, 523–529.
(73) This definition of selectivity is commonly used in Pharmacology and Chemistry for
(74) We reduce the confusion of having the one letter symbol ‘K’ for potassium, lysine and
equi-librium constants by adding a superscript plus ‘K+’ for potassium ions, writing ‘Lys’ for
lysine unless used in a residue sequence such as DEKA and using a subscript ‘KM1,M2’ for
equilibrium constants.
(75) Valleau, J. P.; Cohen, L. K.J Chem Phys1980,72, 5935–5941.
(76) Malasics, A.; Boda, D.J Chem Phys2010,132, 124102.
(77) Canessa, C. M.; Schild, L.; Buell, G.; Thorens, B.; Gautschi, I.; Horisberger, J. D.;
Rossier, B. C.Nature1994,367, 463–467.
(78) Tomaselli, G. F.; Chiamvimonvat, N.; Nuss, H. B.; Balser, J. R.; Pérez-García, M. T.;
Xu, R. H.; Orias, D. W.; Backx, P. H.; Marban, E.Biophys J1995,68, 1814–1827.
(79) Sheng, S.; Li, J.; McNulty, K. A.; Avery, D.; Kleyman, T. R.J Biol Chem2000, 275, 8572–
8581.
(80) Kellenberger, S.; Auberson, M.; Gautschi, I.; Schneeberger, E.; Schild, L. J Gen Physiol
2001,118, 679–692.
(81) Li, J.; Sheng, S.; Perry, C. J.; Kleyman, T. R.J Biol Chem2003,278, 13867–13874.
(82) Anantharam, A.; Palmer, L. G.J Gen Physiol2007,130, 55–70.
(83) Pauling, L.The Nature of the Chemical Bond, 3rd ed.; Ithaca, NY: Cornell University Press.,
Figure Legends
Figure 1: Simulation of Na+, Ca2+, K+and Li+occupancy in the eukaryoticDEKANa+ channel. (a) Schematic of the CSC model: The surface mesh used to calculate the Possion-Boltzmann induced charge is represented as black lines and lies on the interface between the aqueous media and the channel protein. The D, E and lysine charged side-chains lie within the aqueous zone highlighted in light blue. Lysine is represented as a single positively charged ammonium ion (blue) and the carboxylic acid groups of D and E are represented by two half-negatively charged oxygen ions each (red). The channel axis zero point is the center of the channel with the positive direction pointing up. The graphs show the Na+ (light-blue) and Ca2+(orange) ion concentrations along the filter region as found by FCC (b) and LCC (c-d) calculations. The Cl−ion concentrations are zero throughout the channel and are not shown. The brown lines in (c) and (d) show the two sub-intervals used to derive the selectivity. (c) and (d) are the results for the −+− and − −+
patterns, respectively with the schematic (e) showing how the charged side-chains are arranged in the light blue zone in (a). Shown in (a) is the−+−pattern (e upper), the− −+pattern (e lower) corresponds to an exchange, as indicated by the arrow, of the central blue sphere with the two red spheres at the bottom. The concentration profiles are from a simulation of equal concentration of CaCl2 and NaCl with a total ionic strength of 0.22M (220mM). The Inset in (d) shows the very
Figure 3: Na+ channel: Titration of sodium and lithium, calcium or potassium occupancies (nor-malized to 220mM ionic strength) against[Na]/[Li],[Na]/[Ca]or[Na]/[K]ratio respectively. Note the difference in the occupancy scales between different panels showing different ion pairs, with Na+ reaching similar occupancy maxima in all three graphs (eg. black lines). Lines represent a fit to Eqn. 9 (see Fig. S4 in the supporting information for calculated values).
0 100 200
[D] + [E] /M
-3 -2 -1 0 1 2 3 Pore Axis /Å
0 100 200
[Lys] /M
Figure 4: Na+channel: Comparison of the concentration of the structural ions along the pore axis with FCC and LCC methods. The black solid line is from FCC model, the red line from LCC with
[image:22.612.193.415.422.619.2]Tables
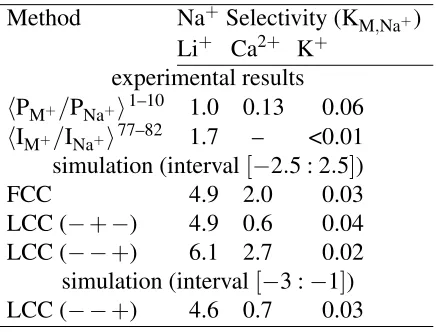
Table 1: Calculated modelDEKANa+ channel selectivity compared by localization method. The
− −+ and−+− labels show the charge and order of the structural ions along the channel (See Fig. 1e). Interval refers to the sub-region of the channel (shown as a brown line in Fig. 1c–d) used for computing selectivity, with zero being the channel center-point and the selectivity filter region being[−5 : 5Å]. (See Tab. S2 for full list of the experimental results.)
Method Na+ Selectivity (KM,Na+)
Li+ Ca2+ K+ experimental results
hPM+/PNa+i1–10 1.0 0.13 0.06
hIM+/INa+i77–82 1.7 – <0.01
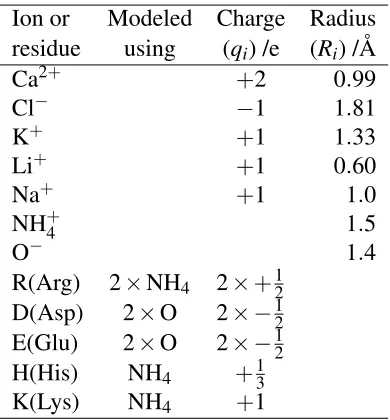
Table 2: Model ion parameters at physiological pH. Model particle charge and radius83parameters of the structural and solute ions at physiological pH. Solute ions and lysine residues all have a single charged atom and are modeled as a single hard sphere with a full charge. The carboxylic acid groups of D and E residues and the guanidinium of R residues have two charge bearing atoms and are modeled using two hard spheres having −1
2 and+ 1
2 charges, respectively. Because histidines
are 10% positively charged at physiological pH their imidazole group should be modeled with+101
charge. However, NanC has only three histidines in the pore which would give a non-integral total charge, so in this case the charge on each histidine was increased to+13.
Ion or Modeled Charge Radius residue using (qi) /e (Ri) /Å Ca2+ +2 0.99 Cl− −1 1.81
K+ +1 1.33
Li+ +1 0.60
Na+ +1 1.0
NH+4 1.5
O− 1.4
R(Arg) 2×NH4 2×+12
D(Asp) 2×O 2× −12
E(Glu) 2×O 2× −12
H(His) NH4 +13