Introduction
The perceived relevance of physiology in studies of climate change effects on marine ectotherms and ecosystems is currently limited; the major reason being that quantitative evidence linking physiological phenomena to ecosystem-level processes and change is scarce. Few studies have established clear links between field studies reporting a climate-induced effect at the ecosystem level and laboratory studies establishing the reasons for such an effect. As a recent example, the negative effects of summer extreme temperatures on population dynamics of eelpout (Zoarces viviparus) in the German Wadden Sea were related to laboratory studies of the oxygen and capacity limitation of heat tolerance (Pörtner and Knust, 2007). These principles shape the performance capacity of the species at the ecosystem level, exemplified in the growth patterns observed. Another example where thermal limitation of a species has been identified at the ecosystem level and where the physiological background is reasonably well understood is that of Pacific salmon in the Frazer River, BC, Canada (Farrell et al., 2008). Here the warming river prevents adult spawners from reaching their upstream spawning grounds, because of thermal limitations to aerobic swimming capacity. Both fish species experience their upper thermal limits of functional capacity in the field, either in growth (eelpout) or in muscular exercise (salmon). The long-term nature and irreversibility of the effect also suggest that both species experience their specific limits of warm acclimation capacity. In
case of the eelpout the environmental conditions therefore represent those at the southern-most distribution limit of the species.
Other species display a well-expressed passive range of thermal tolerance. Lab and field data collected in submersed Mediterranean mussel populations indicate that during summer heat these bivalves exploit their passive range of heat tolerance including the heat shock response (Anestis et al., 2007; Anestis et al., 2008). Vertical zonation of submersed mussels thus not only depends on their thermal window of aerobic performance but also is co-determined by their capacity for passive heat-resistance. This is even more so in bivalves living in the intertidal zone and indicates that these sessile species live where ambient temperatures periodically rise close to the upper lethal limits. Finally, the southern distribution limits of intertidal mussels (Mytilus edulis) along latitudinal clines correlate with their upper lethal limits (Jones et al., 2009). All of these data emphasize the usefulness of interpreting data from well-controlled laboratory experiments in the context of environmental data from the field.
Such combined lab and field data reflecting the physiology of thermal limitation and climate-induced shifts in species distribution are scarce. Further laboratory studies confirm, however, the underlying principles of the concept of oxygen- and capacity-limited tolerance in representative aquatic species from various animal phyla: sipunculids, annelids, molluscs (bivalves, cephalopods), crustaceans and vertebrates. These principles have been reviewed (see Pörtner, 2001; Pörtner, 2002; Pörtner et al., 2004) and may The Journal of Experimental Biology 213, 881-893
© 2010. Published by The Company of Biologists Ltd doi:10.1242/jeb.037523
Oxygen- and capacity-limitation of thermal tolerance: a matrix for integrating
climate-related stressor effects in marine ecosystems
H.-O. Pörtner
Integrative Ecophysiology, Alfred-Wegener-Institute, Am Handelshafen 12, 27570 Bremerhaven, Germany
Hans.Poertner@awi.de
Accepted 24 November 2009
Summary
The concept of oxygen- and capacity-dependent thermal tolerance in aquatic ectotherms has successfully explained climate-induced effects of rising temperatures on species abundance in the field. Oxygen supply to tissues and the resulting aerobic performance characters thus form a primary link between organismal fitness and its role and functioning at the ecosystem level. The thermal window of performance in water breathers matches their window of aerobic scope. Loss of performance reflects the earliest level of thermal stress, caused by hypoxaemia and the progressive mismatch of oxygen supply and demand at the borders of the thermal envelope. Oxygen deficiency elicits the transition to passive tolerance and associated systemic and cellular stress signals like hormonal responses or oxidative stress as well as the use of protection mechanisms like heat shock proteins at thermal extremes. Thermal acclimatization between seasons or adaptation to a climate regime involves shifting thermal windows and adjusting window widths. The need to specialize on a limited temperature range results from temperature-dependent trade-offs at several hierarchical levels, from molecular structure to whole-organism functioning, and may also support maximized energy efficiency. Various environmental factors like CO2 (ocean acidification) and hypoxia interact with these
principal relationships. Existing knowledge suggests that these factors elicit metabolic depression supporting passive tolerance to thermal extremes. However, they also exacerbate hypoxaemia, causing a narrowing of thermal performance windows and prematurely leading the organism to the limits of its thermal acclimation capacity. The conceptual analysis suggests that the relationships between energy turnover, the capacities of activity and other functions and the width of thermal windows may lead to an integrative understanding of specialization on climate and, as a thermal matrix, of sensitivity to climate change and the factors involved. Such functional relationships might also relate to climate-induced changes in species interactions and, thus, community responses at the ecosystem level.
also hold in air breathers relying on convective oxygen transport. Oxygen- and capacity-limited thermal tolerance (or, in other words, temperature-dependent oxygen limitation) has also been verified in larval stages of for example crustaceans (Storch et al., 2009) as well as in small zooplankton (Seidl et al., 2005). All of these observations match with a more general picture of how ambient oxygen levels shape and limit animal life through oxygen availability, be it in the limited capacity of adult specimens to ventilate their oxygen-limited egg masses (Cohen and Strathmann, 1996; Woods and Moran, 2008; Fernandez et al., 2000) or in the dependence of maximum body size of marine invertebrate phyla on temperature-dependent oxygen solubility and thus aquatic oxygen levels (Chapelle and Peck, 1999). These principles thus appear unifying in shaping (aquatic and possibly terrestrial) animal life, firstly referring to individual species. However, consideration of the physiology of species interacting at the ecosystem level (Pörtner and Farrell, 2008; Pörtner et al., 2010) is likely to improve the predictive power of presently insufficient physiological models of community dynamics (Davis et al., 1998). Starting from these observations one research direction is to deepen our understanding of climate specialization and sensitivity through mechanistic physiology including studies of the mechanisms of thermal adaptation and acclimatization at various levels: systemic, cellular to molecular (e.g. Guderley, 2004; Pörtner and Lannig, 2009; Dong and Somero, 2009) or of associated signalling pathways (e.g. Kassahn et al., 2009) and gene expression patterns (Hardewig et al., 1999; Lucassen et al., 2003; Lucassen et al., 2006; Podrabsky and Somero, 2004; McLelland et al., 2006). The other direction, less developed but equally important, is to establish firm links between physiological patterns and climate regimes or scenarios. This can be achieved through macrophysiology approaches, which use meta-analyses to firmly establish such patterns in relation to large scale variations in temperature or climate (e.g. Macpherson, 2002; Chown and Gaston, 2008; Gaston et al., 2009). Ideally, the two complementary directions would need to be equally developed for a comprehensive picture of climate specialization and sensitivity. However, the effort is so extensive that I am not aware of any example where such a comprehensive data set has been compiled for any one species or genus. This and the diversity of processes involved may also explain why a comprehensive or unifying concept, which brings together all the various aspects traditionally studied in evolutionary thermal biology and in thermal physiology and ecology, is only emerging and is not widely established.
For an assessment of climate effects at the ecosystem level it will be virtually impossible to elaborate such detailed knowledge in all individual species present in a community, and such effort may not even be needed. The main goal must be to gain predictive power for characterizing and quantifying the sensitivity of species to the effects of climate change. Furthermore, climate change involves environmental factors other than temperature; for example, the accumulation of anthropogenic CO2in the atmosphere and in the
ocean (ocean acidification) or the expansion of hypoxic zones. Future research must involve addressing the principal questions of why species specialize on limited temperature ranges, why they are sensitive to accumulating CO2 and how they deal with ambient
oxygen deficiency. With respect to individual factors, all of these questions have traditionally been investigated in the realm of comparative physiology and have repeatedly been reviewed along the way [for example with respect to hypoxia (Hochachka, 1980; Hochachka, 1986; Hochachka and Lutz, 2001; Grieshaber et al., 1994; Hand and Hardewig, 1996), with respect to temperature (Pörtner, 2001; Pörtner, 2002; Pörtner, 2006; Pörtner et al., 2006b; Pörtner et al., 2007; Angiletta, 2009; Somero, 2010) and with respect
to CO2(Ishimatsu et al., 2005; Pörtner et al., 2004; Pörtner et al.,
2005a; Pörtner, 2008)].
Understanding the mechanistic background of sensitivity to these factors as well as the mechanistic background of resulting changes in performance will at the same time lead to an explanation of the reason for specialization to a certain range of each factor. This involves knowledge of key molecular to whole-organism trade-offs and constraints in shorter-term acclimatization processes as well as in evolutionary adaptation, in both cases as a mechanistic background of specialization (e.g. Pörtner et al., 2007).
Furthermore, studies of climate effects on marine ectotherms and their ecosystems in a specific environment, like the Wadden Sea ecosystem, need to consider the effective ranges of abiotic factors. This concerns the means as well as the variability and extremes of each factor, for example with respect to temperature (cf. Pörtner and Knust, 2007; Helmuth et al., 2010). Here, studies considering the specific effect of variability of individual factors are scarce (e.g. Podrabsky and Somero, 2004). However, efforts have to reach beyond studies of the principles of the physiological response, for example to temperature or CO2or extreme hypoxia. Also, while comparative
physiology has traditionally looked at each factor in isolation, studying the interaction of factors is required for the development of realistic scenarios. For a cause and effect understanding and the prediction of ecosystem-level effects, unifying physiological concepts need to be developed, which integrate all relevant factors into the picture. Only then can comparative physiology reach beyond empirical observations and contribute to an accurate understanding of ongoing ecosystem change as well as to a mechanism-based projection of future scenarios. The present study focuses on such integration with respect to the effects of temperature, carbon dioxide and hypoxia.
In a climate context in general, thermal changes are key drivers of ongoing change (e.g. Pörtner and Knust, 2007); however, thermal changes co-occur with increasing hypoxia events due to enhanced stratification of water bodies and elevated oxygen demand of organisms in the warming seas (Stramma et al., 2008), as well as with progressive carbon dioxide accumulation leading to ocean acidification scenarios (Caldeira and Wickett, 2005; Cao and Caldeira, 2008). At increasing depths the anthropogenic CO2signal
is exacerbated in expanding oxygen-deficient areas like oxygen minimum layers (Brewer and Pelzer, 2009; Brewer, 2009). The intention of this review is to discuss the conceptual basis of studying the interaction of temperature, hypoxia and CO2effects in
the marine realm. It will briefly outline the physiological principles, elaborate on the few examples available and thereby identify research questions to be addressed. This focus is not meant to neglect other factors beyond temperature, CO2 and hypoxia; changing
salinities due to freshening, stratification or drought may play a role in some seas. In some coastal areas pollution, e.g. by heavy metals, may play a role and interact with the other factors (Sokolova and Lannig, 2008; Lannig et al., 2008).
Analyses of the interactions and effects of various environmental factors should integrate the concepts elaborated for the effect of individual factors. The observation that temperature, hypoxia and CO2all affect energy turnover and the systems of oxygen supply
In providing causality and in quantifying levels and changes of performance and resistance they provide a link between physiology and ecology and support an understanding of ecosystem-level processes as needed to achieve more realistic estimates of species and ecosystem sensitivities to environmental change.
Temperature-dependent niche dimensions: physiological principles
Oxygen- and capacity-limited thermal tolerance
Ecosystem changes elicited by anthropogenic impacts at local scales as well as by global climate change have opened our eyes to the need for an understanding of the mechanistic background of such changes. Which characters are rendering a species sensitive to climate and which are causing losses in abundance? What is driving species to extinction at local or larger scales? A recent analysis (Pörtner et al., 2010) suggests that a twist in the interpretation of available knowledge is suitable to start identifying the physiological dimensions of the environmental niche in which a species or one of its specific life-stages exist. Such dimensions result from the consideration of performance characters in relation to both biotic and abiotic characters. In the context of climate effects on marine ecosystems the underlying thermal physiology plays a key role. Therefore, and as recent insight into the mechanisms of thermal adaptation and limitation opens a perspective for a unifying concept
in the cause-and-effect understanding of climate change effects on aquatic ectotherms, the influence of temperature on marine organisms will be dealt with first.
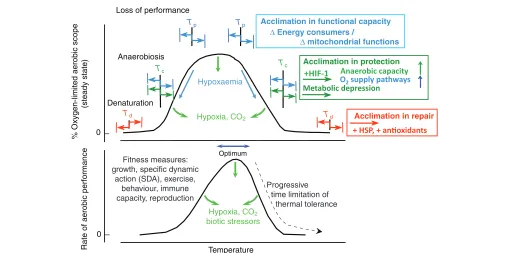
As a general principle, the concept of oxygen- and capacity-limited thermal tolerance explains how aerobic scope is capacity-limited by insufficient oxygen supply at both sides of the thermal window and sets the performance window in animals, with an optimum close to the upper pejus temperature (the latin ‘pejus’ means ‘getting worse’) (e.g. Pörtner and Knust, 2007; Pörtner and Farrell, 2008). The resulting temperature-dependent performance curve matches that with a long tradition of use in evolutionary analyses of thermal biology (for review, see Angiletta, 2009). The concept of oxygen-and capacity-limited thermal tolerance thus provides access to understanding the physiological mechanisms shaping and limiting performance and integrates those at whole-organism and tissue levels with the underlying biochemical and genomic mechanisms. Here, performance capacity largely relates to biochemical mechanisms setting aerobic capacity of cells and tissues in general and specifically to the capacity of ventilatory and circulatory organs to supply sufficient oxygen for covering physiological costs above maintenance. This statement builds on repeated findings that thermally limited oxygen supply capacity sets the width and positioning of organismal thermal windows on the temperature scale. Thermal limitation results from insufficient capacity reflected in a
Tp Tp
% Oxygen-limited
a
ero
b
ic
s
cope
(
s
te
a
dy
s
t
a
te)
0
Tc
Loss of performance
Tc
Anaerobiosis
Denaturation
Td Td
0
Temperature
R
a
te of
a
ero
b
ic perform
a
nce Optimum
Δ Energy consumers /
Δ mitochondrial functions
Acclimation in functional capacity
Hypoxaemia
Hypoxia, CO2
Hypoxia, CO2
biotic stressors
Acclimation in protection
Acclimation in repair
Fitness measures: growth, specific dynamic
action (SDA), exercise,
behaviour, immune capacity, reproduction
[image:3.612.52.564.350.603.2]Progressive time limitation of thermal tolerance
decrease in systemic oxygen levels (hypoxaemia) and finally a transition to anaerobic metabolism (Fig. 1).
Studies of temperature-dependent oxygen supply, mode of metabolism and associated mechanisms of thermal adaptation in marine invertebrates and fishes from various latitudes support the concept of oxygen- and capacity-limited thermal tolerance. Early evidence came from studies in marine invertebrates (annelids, sipunculids), which demonstrated a transition to anaerobic mitochondrial metabolism at both low and high ends (called critical temperatures) of their thermal window (Zielinski and Pörtner, 1996; Sommer et al., 1997). Work in bivalves and fishes showed the onset of anaerobic succinate formation at high temperatures (van Dijk et al., 1999; Pörtner et al., 1999; Peck et al., 2004). A more recent example confirmed that an onset of anaerobic metabolism at low and high temperature extremes also occurs in cephalopod mantle tissue (Melzner et al., 2006). The transition to mitochondrial anaerobiosis was shown to result from the development of progressive hypoxaemia in arterial haemolymph of a crustacean towards both sides of the thermal window, beyond the so-called pejus limits, with an optimum range of maximum body fluid PO2
in between (Frederich and Pörtner, 2000). Recent data indicate that arterial hypoxaemia upon cold exposure is less expressed in cold temperate crustaceans like Hyas araneus or Cancer pagurus (Metzger et al., 2007; Walther et al., 2009). These observations emphasize that the kinetic reduction in functional capacity of the oxygen supply system can be overcome by cold acclimatization or cold adaptation. Still, once the critical PO2of oxygen diffusion into cells and mitochondria is reached, mitochondria start to respire anaerobically. This emphasizes the role of oxygen homeostasis in the capillary bed as concluded from oxygen measurements in venous blood of fish or venous haemolymph of marine invertebrates (Lannig et al., 2004; Pörtner et al., 2006a).
Evidence for temperature-induced hypoxaemia in fish comes from relatively few examples, with the study by Lannig and colleagues reporting temperature-induced reductions in venous oxygen tension (Lannig et al., 2004), and the study by van Dijk and colleagues identifying the transition to anaerobic metabolism (van Dijk et al., 1999). Pörtner and colleagues (Pörtner and Knust, 2007; Pörtner et al., 2001; Pörtner et al., 2008) integrated these findings with those of temperature-dependent growth and abundance in the field. The study by Mark and colleagues (Mark et al., 2002) as well as that of Lannig and colleagues (Lannig et al., 2004) indicated a limited capacity of cardio-circulation to respond to warming beyond a certain limit, the pejus limit, while temperature-dependent oxygen demand increased. Ventilatory oxygen supply in fish does not appear to set primary limitation to thermal tolerance (Sartoris et al., 2003). Current knowledge indicates that excess ambient oxygen improves resistance to warming (Weatherley, 1970; Mark et al., 2002; Pörtner et al., 2006a) by shifting pejus limits (see Fig. 1). Accordingly, hypoxaemia or a mismatch in oxygen demand versussupply elicits the first levels of thermal limitation, e.g. through a levelling off and then a reduction in aerobic scope and performance upon warming.
Beyond pejus limits species start to exploit their passive range of tolerance but can only do so for limited time (Fig. 2) because their feeding performance and growth capacity and thus long-term fitness are progressively reduced (Pörtner and Knust, 2007) (cf. Pincebourde et al., 2008). Such performance limitations are in fact seen as reasons for climate-induced geographical shifts in the distribution of intertidal invertebrates (Wethey and Woodin, 2008). The onset of hypoxaemia and capacity loss explains such a decrease in fitness upon changing temperatures (Pörtner and Knust, 2007).
The time limitation of thermal tolerance thus starts beyond pejus temperatures. As oxidative and thermal stress threaten to damage molecular structures, mechanisms of protection and repair support or extend the period of time-limited thermal tolerance. These mechanisms, such as anti-oxidative defence, anaerobic metabolism or the heat-shock response, can display variable capacities, for example in relation to the size of anaerobic substrate stores or the efficiency of molecular chaperones (see Fig. 1). These mechanisms and their capacity can thus be modified by acclimation, thereby extending the period of sustained passive tolerance.
The simple model depicted in Fig.2 links the traditional estimates of lethal thermal limits or critical thermal maxima to the model of oxygen- and capacity-limited thermal tolerance by quantifying passive tolerance as the heat load tolerated over time until mortality sets in. The capacity to resist is reflected in a limited tolerable heat load above the pejus temperature Tp, characterized by the product
of exposure time above Tp(e.g. in hours) multiplied by the difference
between ambient temperature and Tp (T–Tp). Such passive heat
resistance can be exploited either by short-term exposures to extreme temperatures or during long-term exposures to temperatures mildly elevated above Tp. In both cases the tolerable heat load seems
to be similar if not identical, as indicated by systematic analyses of the time dependence of lethal temperatures in Antarctic ectotherms by Peck and colleagues (Peck et al., 2009a). Here, long-term moderate warming protocols in fact led to lower lethal limits than short-term exposures to higher temperatures. The time dependence of lethal thresholds thus follows the dashed line depicted in Fig. 2 confirming that the tolerated heat load above Tpremains constant
regardless of whether it is exploited by extended time periods and moderately elevated temperatures or by short-term exposure to
0
Exposure time beyond Tp
Lethal temperature
Upper Tp
0
T
emper
a
t
u
re (°C)
Acclimatization in protection: shift of Tcand/or Td
Heat excess tolerated over time ((T – Tp) ⫻t)
[image:4.612.321.564.64.271.2]Tp
Fig. 2. Mechanism-based projection of how lethal tolerance limits depend on the time duration of heat exposure. The upper pejus limit as defined in Fig. 1 delineates the onset of time limitation in thermal tolerance. The tolerable heat budget is the integral of excess temperature/heat
extreme temperatures. The model also emphasizes the role of protective mechanisms in setting the capacity of passive tolerance (Fig.1). Acclimation in these mechanisms would lead to an increase in the tolerated heat load due to a higher capacity of passive thermal tolerance. A shift in the position of the curve linked to a shift in Tc
(critical temperature indicating onset of anaerobic metabolism) and Td (denaturation temperature indicating heat induced loss of
structural integrity) to higher values would result and lead to a rise in time-dependent lethal temperatures. Such changes in the tolerated heat load upon acclimatization may be especially important in variable environments like the intertidal zone.
Acclimatization
With the concept of oxygen- and capacity-limited thermal tolerance as depicted in Fig. 1 came the conclusion that in a systemic to molecular hierarchy of thermal tolerance the whole organism would experience functional limitations first, associated with and exacerbated by systemic oxygen limitations which would then cause functional limitations or biochemical stress events at tissue, cellular or molecular levels (Pörtner, 2001; Pörtner, 2002a) (Fig. 1). Thermal windows shift through acclimatization or, on evolutionary time scales, adaptation at genomic levels (cf. Pörtner et al., 2009). Both involve adjustments through gene expression at the level of energy metabolism capacity, both aerobic (Guderley,
2004; Hardewig et al., 1999; Lucassen et al., 2006) and anaerobic (Nathanilides, 1996; Pörtner, 2002a; Zakhartsev et al., 2004). They may also involve small changes in gene coding and protein amino acid sequences upon temperature-dependent adaptation in functional proteins (Somero, 2010). The acute thermal window of a species and its limited capacity to undergo thermal acclimatization form the thermal niche (Fig. 3) which describes the borders of the thermal range that a species or life stage can live through, e.g. during the course of seasonal temperature fluctuations. The expected outcome of the acclimatization responses of the individual is a shift of the acute performance window within the thermal niche, which is reflected in temperature-dependent growth (growth studies always involve acclimatization to any specific temperature). Limits to such shifts are set by constraints in acclimatization capacity. In temperate zone eurytherms, seasonal acclimatization may occur over a wide temperature range, associated with shifts in energy turnover and changing widths of the thermal window (Fig. 3). The comparison of Atlantic cod populations in a latitudinal cline suggests that such limits in (cold) acclimatization capacity exist at the level of gene expression of aerobic enzymes (Fig.4). A further shift of the whole thermal niche beyond the present limits of acclimatization capacity would then occur only on evolutionary time scales when evolutionary adaptations occur over generations.
Gro
wth perf
or
m
a
nce
Tp
Tp
Acute thermal window
Minimum required performance
T (°C)
Warm acclimation in Antarctic fish
Habitat temperature 0.06
0.03
0
M
ass
g
a
in (g d
a
y
–1
)
MO
2
(
μ
mol g
–1
h
–1
)
4
3
2
1
0 5 10 15 20 25
–5 0 5 10 15 20 25 30
*
*
*
*
*
*
3.0
2.5
2.0
1.5
1.0
0.5
0
MO
2
(
μ
mol g
–1
h
–1
)
A
B
C
Seasonal acclimatization in temperate lugwormsTemperature (°C)
Winter Spring Summer
Temperature (°C)
C C
C
[image:5.612.50.559.348.654.2]It needs to be considered that acclimation or evolutionary adaptation would not necessarily lead to beneficial acclimation in terms of performance maximization. Thermal cues elicit seasonal adjustments in the thermal window, which may at the same time involve the onset of dormancy, or the onset of growth or reproduction. Drawing a simple picture for all of these performances is not possible and trade-offs between performances may exist. The important point is that acclimation is a means to cope with temperature oscillations and needs to be able to track environmental temperature changes.
The concept of the thermal niche as a window resulting from a limited capacity for acclimatization also explains the recent observation of phenotypic plasticity in two species of Antarctic fishes, the Antarctic notothenioid Pagothenia borchgrevinki (Seebacher et al., 2005) and the Antarctic eelpout Pachycara brachycephalum(Lannig et al., 2005). In the field, the former species lives close to freezing temperatures at –1.9°C, while the latter lives at temperatures between –0.4 and +1°C (Brodte et al., 2006b). In the eelpout, the longest acclimation period ever studied in Antarctic fishes, 10 months at +5°C, revealed a long-term capacity to warm acclimate, associated with a down regulation in the liver’s capacity for aerobic metabolism (Lannig et al., 2005) and a remodelling of mitochondrial functions (Mark et al., 2006). The eelpout displays an acclimated growth optimum at 4°C, with rates 2.5-fold higher than at 0°C (Brodte et al., 2006a) (Fig.3). Maximum growth occurs in the temperature range where cellular energy turnover is minimal (Mark et al., 2005). In the field, the species lives on the cold side of its thermal niche, below its thermal optimum (Figs 1 and 3). As functions are slowed by low temperature in all Antarctic ectotherms, this may not interfere with the eelpout’s ability to compete for space or resources.
However, residual acclimatization capacities are probably not found in all Antarctic fishes, and even less so in Antarctic invertebrates (Pörtner et al., 1999; Peck et al., 2009b). Extreme stenotherms probably exist among fishes, the most obvious being the icefishes, which lost the oxygen supply pathway bound to haemoglobin and myoglobin functioning. Icefishes are constrained to exploit the high oxygen solubility in cold Antarctic waters and body fluids at low metabolic rates (for a review, see Pörtner, 2006). From the point of
view of the oxygen-limitation concept, this specialization renders them vulnerable to even moderate warming trends.
All of these results support a generalized model of various stress responses in fishes (Kassahn et al., 2009), which encompasses the systemic to cellular and molecular responses involved according to the concept of oxygen- and capacity-limited thermal tolerance.
Life history and ecosystem implications
In aquatic, specifically marine, environments the emerging knowledge of these principles would support explanations of shifts in species composition (regime shifts) at the ecosystem level, of shifts in biogeography or of changes in species interaction and in food web structure (Pörtner and Farrell, 2008). The first evidence for an ecosystem-level impact of heat-induced within-organism oxygen limitation came from a study in eelpout (Zoarces viviparus) in the North Sea, where the species exists at the limit of its acclimatization capacity, i.e. on the warm side of their thermal niche. Species abundance in the Wadden Sea falls upon exposure to extreme summer temperatures. This occurs in the same temperature range where growth performance decreases. Large individuals are affected most by the heat stress as predicted from the allometry of oxygen limitation (cf. Pörtner, 2002b). The study by Pörtner and Knust (Pörtner and Knust, 2007) showed the link between thermally limited cardio-circulatory performance and aerobic scope and the onset of reduced growth performance and abundance in the natural environment, the German Wadden Sea. The study also showed that the species does not grow beyond a thermally set size limit in this area (Pörtner and Knust, 2007). This matches observations in cod, where between juveniles and adults, thermal windows shrink with increasing body size (Pörtner et al., 2008). The narrowest thermal windows would in fact be expected in larval stages and in large spawning adults. Applicability of these principles to early life-stages was demonstrated in larval stages of crustaceans (Storch et al., 2009). In adult spawners, narrow windows would result from the oxygen demand of large egg or sperm masses which form yet another tissue to be supplied with oxygen (Pörtner and Farrell, 2008). These two life-stages may be those reflecting the sensitive bottlenecks at the ecosystem level. Changes in window widths with life history may in
CS
a
ctivity (nor
m
a
liz
ed)
4
3
2
1
0
2.5
2.0
1.5
1.0
0.5
0
CO
X
a
ctivity (nor
m
a
liz
ed)
[image:6.612.44.562.66.261.2]0 1 2 3 4 0 0.5 1.0 1.5 2.0 2.5 CS mRNA (normalized) COX-2 mRNA (normalized)
fact explain reproductive failure in winter (e.g. Wethey and Woodin, 2008) when spawners mature and become especially sensitive to winter warming. Another suitable example is the spawning migration of mature salmon in the Pacific Northwest, which is progressively constrained by rising summer temperatures. Oxygen supply limitations during muscular exercise of migrating salmon play a key role in thermal limitation and the inability of the adult spawners to reach their spawning grounds in warming rivers (Farrell et al., 2008).
Further examples among invertebrates confirm the wider applicability of these concepts, for example across ecosystems. The distribution and vertical zonation of different species of Mediterranean bivalves follow their time-limited passive resistance to thermal stress. Oxygen limitation under thermal stress elicits or contributes to responses along the stress axis, involving signalling events, and is also linked to the heat shock response (Anestis et al., 2007; Anestis et al., 2008) (see Tomanek, 2008; Tomanek, 2010). The comparison of species populations in a latitudinal cline confirmed that the width of thermal windows is narrower in animals with a low level of energy turnover, especially at the lowest aquatic temperatures, in polar areas. Energy budget and the level of energy turnover associated with lifestyle, temperature range and variability as well as environmental challenges thus correlate positively with setting wide thermal windows (cf. Pörtner, 2004) (for a review, see Pörtner, 2006). This generalization is supported by recent observations of seasonal oscillations in metabolic costs within a (marine invertebrate) species, from low cost winter stenothermy, viahigh cost cold eurythermy in spring to lower cost eurythermy in summer. Such findings would
support a role for temperature variability in setting resting energy and oxygen demands even within individuals during seasonal temperature variations (Wittmann et al., 2008; Schroer et al., 2009).
Physiological background of hypoxia and CO2tolerance in
marine organisms
Hypoxia tolerance
Temperature and hypoxia would traditionally be considered as different environmental factors, with specific implications for whole-organism functioning. The problem of environmental hypoxia has traditionally been treated more or less independently and the conceptual framework developed needs to be looked at in more detail before attempting to integrate it with concepts developed for other stressors like temperature or CO2. In the context of whole-organism
requirements for ambient oxygen and of the associated levels of sensitivity to hypoxia (cf. Prosser, 1991) the concepts of oxyconformity, oxyregulation and the critical PO2are relevant. They
have been revisited earlier, considering systemic and cellular processes in declining ambient oxygen tensions from an integrative point of view (Pörtner and Grieshaber, 1993).
It was recognized early on that animals may show different patterns of oxygen consumption in response to changes in ambient PO2. Some keep their oxygen consumption more or less constant
over a wide range of PO2values and are called oxyregulators. Many of these become conformers once oxygen availability falls below the minimum needed to cover oxygen demand. Others show variable oxygen uptake over a wider range of ambient oxygen tensions and
Critical PO2at standard metabolic rate (SMR) in oxyregulators
Bufo marinus (toad) Palaemon elegans (shrimp)
2
1
0
Pc
(6 h)
MO
2
(
μ
mol g
–1
h
–1
)
SMR MO2
Lactate
0 50 100 150
L
a
ct
a
te (mmol l
–1
pl
as
m
a
)
12
6
0
*
A
Critical PO2 defines SMR in an (aerobic) oxyconformer
Pc
MO2
0 50 100 150 Ambient PO2 (Torr)
Ambient PO2 (Torr)
B
1.5
1.0
0.5
0
100
50
0
MO
2
(
μ
mol g
–1
h
–1
)
0.9
0.6
0.3
0
Coelomic
PO
2
(T
orr)
Excess MR
SMR
PO2
Succinate
Sipunculus nudus
S
u
ccin
a
te
(
μ
mol g
–1
fre
s
h m
ass
[image:7.612.48.352.63.428.2])
have, consequently, been termed oxyconformers. Only these aerobic oxyconformers should be considered as ‘true’ oxyconformers. They display oxyconformity at all (whole-organism, cellular and mitochondrial) levels (Pörtner and Grieshaber, 1993), probably due to the use of an alternative oxidase (cf. McDonald et al., 2009). In contrast, the progressive drop in oxygen consumption seen during extreme hypoxia in both oxyconformers and oxyregulators is caused by oxygen deficiency and associated with the transition to anaerobic metabolism. Intermediate responses exist (Mangum and van Winkle, 1973) which complicate such clear categorization in two stereotypes. The categories of oxyregulator and oxyconformer are nonetheless useful to clearly associate the metabolic patterns and the underlying mechanisms and to come up with terminology that is applicable to both types (Fig. 5).
Functional evidence for the presence of an alternative mitochondrial oxidase (cytochrome o) in some aerobic oxyconformers is circumstantial and indirect, but is reflected in typical patterns of metabolic regulation at whole-organism, cellular and mitochondrial levels, as seen in lower marine invertebrates, e.g. sipunculids, annelids or bivalves (Pörtner et al., 1985; Buchner et al., 2001; Tschischka et al., 2000; Pörtner and Grieshaber, 1993). This oxidase might represent an ancient mechanism of oxygen detoxification still prevalent in ‘lower’ animals living in hypoxic environments. Variable intracellular oxygen levels drive variable rates of oxygen consumption in oxyconformers, whereas this rate equals standard metabolic rate (see below) and remains constant above the Pcand independent of intracellular PO2in oxyregulators
(Pörtner and Grieshaber, 1993). However, aerobic oxyconformers can be behavioural oxyregulators, once they manage to keep oxygen levels in their water burrow or in their body fluids constant through compensatory adjustments in ventilatory (and circulatory) efforts.
Irrigation of worm burrows in the sediment or ventilation of gill chambers in bivalves may in fact involve apparent oxyregulation in these animals. By keeping oxygen in their body fluids at low levels (cf. Massabuau, 2001) they could minimize the extent to which oxygen detoxification by cytochrome o is necessary. Variable ventilatory capacities might thus explain (some of) the responses to variable oxygen tensions elaborated by Mangum and van Winkle (Mangum and van Winkle, 1973).
The terms oxyconformity and oxyregulation have been defined for quiescent animals, which display baseline or standard metabolic rate (SMR). SMR is defined as the lowest rate of oxygen consumption for oxyregulators, ‘which would be obtained when all organs were absolutely at rest’ (Krogh, 1914; Beamish and Mookherjii, 1964). The data available for several oxyregulators suggest that this rate is maintained down to the critical PO2below which anaerobiosis starts (see below). This clear physiological definition of SMR excludes the ‘perturbing’ effect of spontaneous muscular activity on the pattern of oxygen consumption during hypoxia. SMR is analysed (1) by correcting for the influence of spontaneous activity during long-term measurements, (2) by extrapolating to zero activity during analyses of aerobic metabolism at various activity levels, or (3) in both oxyregulators and oxyconformers, by determining metabolic rate at or slightly above the Pc, to exclude the effect of oxyconformity mechanisms.
[image:8.612.55.478.425.650.2]However, focusing on SMR may not be satisfying, as animals need to perform and are active at the ecosystem level such that the analysis falls short of sufficiently providing ecosystem-level implications. Nonetheless, for a principle comparison of the responses of oxyconformers and oxyregulators to progressive hypoxia the concept of SMR is relevant. According to a simple model the different patterns of conformity and regulation and associated metabolic
transition phases can be analysed and some ecosystem-level implications elaborated (Fig. 6).
Originally, the concept of a critical PO2 was introduced to characterize hypoxia sensitivity in oxyregulating animals. The Pc
is the oxygen tension below which the organism is no longer able to maintain its rate of oxygen consumption independent of the ambient oxygen tension. It starts to display a decreasing rate of oxygen uptake. This definition is not applicable to quantify hypoxia sensitivity in all animals including oxyconformers. Recent studies, which include an analysis of anaerobic processes at different oxygen tensions, demonstrate that this critical PO2is characterized not only by the transition from an oxygen-independent to an oxygen-dependent pattern of oxygen consumption but also by the onset of an anaerobic energy metabolism. Thus the failure of oxyregulation and the onset of anaerobiosis coincide, the reason being insufficient capacity for oxygen uptake and transport viathe blood (Pörtner and Grieshaber, 1993). This extended concept of the critical PO2(i.e. as the ambient oxygen tension below which water
oxygen concentration becomes limiting and anaerobic metabolism is needed to cover resting energy demand) becomes applicable in both oxyregulating and oxyconforming species. Combined analyses of changes in the overall rate of oxygen consumption, in oxygen transport viathe body fluids, and in the transition from aerobic to anaerobic energy production are required to unequivocally establish the critical PO2.
Anaerobic ATP production pathways are located in both the cytosol and the mitochondria, leading to the formation of either lactate (or opine) as the cytosolic glycolytic end product or succinate (as an indicator of mitochondrial anaerobic metabolism). These metabolites may, in many cases, be suitable cytosolic and mitochondrial markers indicating oxygen deficiency associated with the transition to anaerobic metabolism. However, muscular activity may even lead to pyruvate and lactate or opine accumulation when mitochondria are still performing aerobically (functional anaerobiosis). This emphasizes the importance of analysing mitochondrial processes in studies of hypoxia sensitivity. For example, long-term incubation of oxyconforming Sipunculus nudus below the Pc demonstrated that
succinate accumulation occurred before the opines were formed as glycolytic end products. Consequently, anaerobic glycolysis became involved in resting individuals of this species only when oxygen supply fell to an extent that no longer allowed (all of) the mitochondria to produce energy by aerobic means. This observation presents strong evidence that the animals exhibited their minimal aerobic metabolic rate at the critical PO2. As a corollary, the metabolic rate at the Pc
can be seen to represent the SMR of both oxyregulating and oxyconforming organisms. It follows that oxyregulators are able to maintain low metabolic rate (SMR) at PO2values higher than Pc(PcM
in Fig.6), whereas the oxygen consumption of ‘true’ oxyconformers increases above Pc. These animals show a second critical PO2(PcR
in Fig. 6), above which the elevated rate of oxygen uptake finally remains constant.
Further observations characterize the Pc. At systemic and cellular
levels, the transition from aerobic to anaerobic energy metabolism is linked to either a pronounced decrease or even an increase in oxygen consumption. The latter results from a stimulatory response elicited by for example lactate accumulation (Pörtner at al., 1991; Pörtner et al., 1994; Pinz and Pörtner, 2003). This observation again eliminates uncertainty in quantifying hypoxia sensitivity in oxyregulators: the critical oxygen tension is not characterized by ‘typical’ changes in metabolic rate but, initially, by the critical reduction of oxygen transfer via the blood or other body fluids, leading to the onset of anaerobic metabolism. Overall energy
expenditure continues to fall below the critical PO2, especially in those animals that are able to tolerate extended exposures to hypoxia and exploit anaerobic resources. They undergo metabolic depression as a passive, protective response and thereby avoid or minimize their reliance on anaerobic metabolism. At the whole-organism level, the Pc increases with organizational complexity,
from unicellular organisms to complex organisms like animals, because mechanisms causing additional limitations of oxygen provision become involved, as follows. (1) In a cell, diffusion limitation of oxygen in the membrane and the cytoplasm together with the rate of mitochondrial respiration and, perhaps, the clustering of mitochondria in areas of high energy need define the point at which the oxygen concentration finally becomes limiting and anaerobiosis commences. (2) At the tissue level capillary PO2(in
animals with closed circulatory systems) or bulk venous PO2(in
0 0
Temperature
R
a
te of
a
ero
b
ic met
ab
oli
s
m
0
0
Temperature At low and high Tc, Pc at SMR equals normoxic PO2.
Pc at SMR is minimal in the thermal optimum (Topt). Pc at MMR equals normoxic PO2.
Pcmax At MMR: Pcmax Pcmax
Pcmax = normoxia
Pc
(kP
a
)
Pc at SMR
MMR ?
Max. aerobic
scope
SMR
At SMR and Topt: Pcmin
Tc Tc
A
At MMR: Pcmax
B
R
a
te of
a
ero
b
ic perf
or
m
a
nce
At SMR and Topt: Pcmin Pc
at SMR
Hypoxia
?
Pcmax = normoxia
Pc
(kP
a
[image:9.612.318.564.252.580.2])
animals with an open circulatory system) are key parameters in determining whether oxygen provision is sufficient for the individual cell. The maintenance of the pressure head for sufficient oxygen supply depends upon the rate of perfusion, on the density of the capillaries and on blood oxygen transport. (3) For the whole organism the required pressure head, i.e. the Pc, will also depend
upon the structures and functions of the gas exchange organ and the circulatory system, and upon the O2affinity of the pigment and
its regulation. These mechanisms contribute to alleviate the principal problem that body surface to volume ratios are low and unfavourable for oxygen diffusion at large body sizes.
A summary of the different patterns discussed for regulators and conformers supports the simple model (see Fig.6) where, generally, oxygen consumption at the Pcof the resting organism is equivalent
to SMR, even when considering that a potential increase in oxygen uptake below the Pcmay occur as a response linked to the onset of
anaerobic metabolism. SMR or Pcvaries between species and their
life-stages as well as between individuals of the same species according to body size. SMR and Pc(resting) may even be variable
in an individual animal according to its physiological state under the prevailing endogenous and exogenous conditions. For example, long-term acclimatization to hypoxia may occur, such that the SMR and its critical PO2may be lower for individuals of the same species acclimated to hypoxia compared with ones exposed to higher oxygen tensions. Once an animal becomes active or displays a metabolic rate higher than SMR for other reasons, the Pcof aerobic metabolism
will rise and reach a high Pcmaxat maximum metabolic rate (see Fig. 6) (cf. Farrell and Richards, 2009).
Studies of temperature-dependent oxygen supply, mode of metabolism and associated mechanisms of thermal adaptation in marine invertebrates and fishes across latitudes have suggested a role for oxygen supply in thermal limitation and adaptation. From an integrative point of view the concepts of hypoxia sensitivity therefore readily apply in the context of thermal limitation and its role in understanding climate change effects on marine ecosystems. The concept of oxygen- and capacity-limited thermal tolerance provides a basis for integrating the two factors and provides access to the question of how temperature and hypoxia become effective at the ecosystem level (cf. Pörtner and Lannig, 2009). In principle, thermal stress causes systemic hypoxaemia at both ends of the thermal window. Oxygen supply capacity in relation to oxygen demand sets the width of the thermal window of an animal (Fig. 1). Thermally induced hypoxaemia and associated stress and signalling mechanisms probably shape acclimation responses at various molecular to whole-organism levels (e.g. Kassahn et al., 2009). Furthermore, thermal adaptation affects SMR and the cost of maintenance as well as the energy budget of an organism.
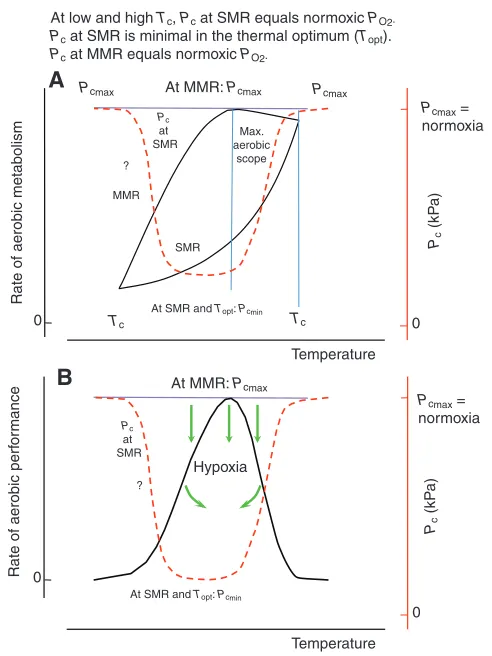
The integration of the concepts of thermal and hypoxia tolerance leads to new insights and perspectives relevant for hypoxia tolerance and vice versa(Fig. 7). Mechanism-based projection indicates that hypoxia tolerance is maximal within the thermal optimum. Close to the upper pejus temperature, the capacity of ventilatory and circulatory systems to provide oxygen to tissues is maximal and, accordingly, PcMis minimal. The positive balance between oxygen
supply capacity and oxygen demand is maintained during cooling to lower pejus temperatures. While cooling lowers the capacity for oxygen supply, it lowers metabolic rate at the same time and provides elevated solubility and thus high concentrations of ambient (and arterial) oxygen. Hypoxaemia setting in due to thermal limitation beyond both lower and upper Tpwill finally cause a rise in Pc, thus
indicating a progressive reduction of hypoxia tolerance at the borders of the thermal window [for a recent example of the temperature
dependence of Pcupon warming in a marine mussel see Jansen et
al. (Jansen et al., 2009)]. Finally, Pcreaches ambient values at both
critical temperatures [as delineated by Zakhartsev et al. (Zakhartsev et al., 2003) for the high Pc].
The difference between Pcand ambient oxygen tension indicates
the excess amount of oxygen exploitable by rising aerobic metabolic rate. This supports a rise in performance between the upper and lower critical temperatures. However, Pc rises in parallel with
metabolic rate until it again reaches ambient oxygen tensions characterizing the aerobic limit. As a corollary, the species-specific thermal window and the temperature sensitivity of Pcreflect the
temperature dependence of hypoxia sensitivity or, in other words, the integration of thermal and hypoxia sensitivities using the matrix of oxygen- and capacity-limited thermal tolerance. These relationships require consideration in analyses of hypoxia resistance at rising ambient temperatures. Conversely, ambient hypoxia causes a narrowing of the thermal window and a decrement in temperature-dependent performance. By influencing the levels of hypoxaemia it will probably also influence the processes involved in thermal acclimatization and adaptation. These processes counteract thermally induced hypoxaemia and would thereby also improve tolerance to ambient hypoxia. While these relationships remain largely unexplored experimentally, the widening of the conceptual basis and the inclusion of ambient hypoxia emphasizes the specialization of whole-organism functioning on limited temperature ranges as a key element in climate change effects on ecosystems. Accordingly and as a perspective, the operation of species and their sensitivity to environmental factors including hypoxia may in fact best be understood if analysed on a matrix of temperature-dependent performance (Pörtner and Knust, 2007; Pörtner and Farrell, 2008; Pörtner et al., 2008; Pörtner et al., 2009).
Tolerance to ocean acidification
In the case of CO2-induced ocean hypercapnia and acidification,
specific effects on marine ecosystems may still be so small that evidence for CO2-induced changes in the field is largely lacking,
with the major exception of a decrease in calcification rates of some coral reefs (De’ath et al., 2009). This decrease in calcification, however, probably includes stressful effects of ocean warming, which has repeatedly elicited bleaching and a decrease in coral cover of the reefs. Conversely, elevated CO2 tensions were found to
enhance the bleaching response (Anthony et al., 2008). Beyond the special case of coral reefs, future scenarios indicate that the specific or synergistic effects of ocean acidification threaten marine life forms. In some natural environments, the anthropogenic CO2signal
adds to natural variability. For example, CO2is already elevated in
expanding oxygen minimum layers such that hypoxic and hypercapnic conditions go hand in hand. Ocean acidification will exacerbate the level of hypercapnia experienced by marine organisms (cf. Brewer and Peltzer, 2009).
Ocean acidification will coincide with ocean warming and the expansion of hypoxic zones, due to enhanced stratification of warming seas and to elevated oxygen demand in oxygen-deficient waters. Increasingly, all three factors synergistically affect marine life forms. In similar ways to the synergistic effect of hypoxia and temperature, identification of the mechanisms through which temperature and CO2-related ocean physicochemistry jointly affect
organismal fitness, survival and success is crucial for understanding and projecting future change.
During transient exposure to hypoxia as experienced on a daily basis by intertidal organisms, CO2 triggers physiological and
time-limited exposure to such adverse conditions (e.g. Reipschäger et al., 1997) (for reviews, see Guppy and Withers, 1999; Storey and Storey, 2004; Richards, 2009). Available knowledge suggests unifying physiological principles of CO2 effects, across animal
groups and phyla (Pörtner et al., 2004; Pörtner et al., 2005a; Pörtner, 2008). Adopting thermal windows of optimized performance as a basic character defining species fitness and survival, and its capacity to interact with other species, accumulating CO2 acts through
performance reductions at the level of reproduction, behaviour and growth, especially at the edges of the thermal window (Fig.1). Here, the species-specific capacity of acid–base regulation, which is seen as a key component defining sensitivity to ocean acidification (Pörtner, 2008), may become even more limited as the organism moves from the thermal optimum towards extreme temperatures. As a result, functional capacity may be reduced, causing an exacerbation of temperature-induced hypoxaemia (Metzger et al., 2007). Reduced calcification rates may also occur and interfere with fitness measures. Overall, ocean acidification probably affects lower marine invertebrates most severely, which are characterized by a low capacity to compensate for disturbances in extracellular ion and acid–base status and sensitivity of metabolism to such disturbances. Available data (Walther et al., 2009) are in line with the projection that one key consequence of these features is a narrowing of thermal tolerance windows, as well as a reduced scope for performance at the ecosystem level (Fig.8) (Pörtner and Farrell, 2008). These changes in thermal envelopes may have major implications for the ranges of geographical distribution of these organisms and in species interactions.
Synopsis and perspectives
As a corollary, the concepts and findings discussed in the present paper are in line with the general perception that aquatic fauna and their life-stages specialize on climate and associated temperature variability. The related temperature windows underlie the observed sensitivities to climate-induced temperature extremes. The first line of sensitivity is reflected in decrements in performance, i.e. the capacities to forage, migrate, grow or reproduce, followed by various steps characterizing the capacity of passive resistance to temperature extremes. So far, these generalized conclusions build on evidence from relatively few examples, mostly from temperate waters. In these cases, the changes at the ecosystem level were related to physiological limitations (cf. Pörtner and Farrell, 2008). To what extent the limits of the thermal niche of a species (which includes the limits of acclimation capacity, Fig. 3) match those of its niche realized at the ecosystem level (cf. Pörtner et al., 2010) remains to
be elaborated via many more examples. The present conceptual analysis demonstrates that as temperature has pervasive effects on all levels of biological organization, synergistic effects of important climate-related factors like hypoxia or elevated CO2levels are most
adequately considered by building on the concept of oxygen- and capacity-dependent thermal windows as a matrix. In fact, the applicability of this matrix is not restricted to these factors; further environmental parameters can be included accordingly. For example, recent work in oysters demonstrated that pollution by heavy metals like cadmium causes enhanced costs in aerobic metabolism. The resulting load on oxygen supply capacity causes a reduction in heat tolerance and represents a mechanism for how climate sensitivity is enhanced at contaminated sites (Lannig et al., 2008; Sokolova and Lannig, 2008).
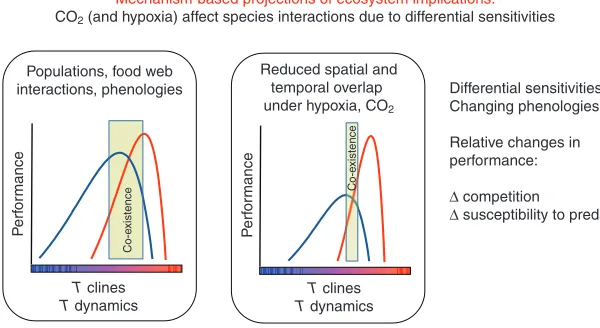
These principles may even become applicable at a higher organizational level, when elaborating the mechanisms involved in changes of community composition and food web structure and in projecting future ecosystem changes (Pörtner and Farrell, 2008). Such effects may build on differential performances and sensitivities in species coexisting in the same ecosystem due to spatial and temporal overlap of their differential distribution ranges. In brief, such interacting species would still specialize on different climates and would probably do so for the sake of energy savings and efficiency (Pörtner, 2006). Available evidence suggests that more agile species, partly due to better oxygen supply systems, are more eurythermal and, accordingly, would cover wider ranges of geographical and thermal distribution (Pörtner, 2002b; Peck et al., 2009a). Cold stenothermal species display low levels of energy turnover with the benefit of a high level of growth efficiency (e.g. Heilmayer et al., 2004; Pörtner et al., 2005b). The different but overlapping thermal windows of species interacting in an ecosystem probably influence the quality and intensity as well as the seasonal timing of their interactions (Pörtner and Farrell, 2008). Multiple stressors (abiotic factors like CO2, hypoxia and toxicants; biotic
factors like limited food availability, predation pressure or competition) may narrow the acute thermal window of aerobic performance (and the thermal niche) and, moreover, lower the performance maximum to various degrees (see below). In the case of abiotic factors this may occur mostly through temperature-induced hypoxaemia being exacerbated by ambient hypercapnia or hypoxia (Metzger et al., 2007; Pörtner and Farrell, 2008). Changing window widths of temperature-dependent performances would therefore be a key aspect to be considered in a climate change context. Furthermore, a species’ realized niche would include a threshold of minimum performance required to ensure interactions and Mechanism-based projections of ecosystem implications:
CO2 (and hypoxia) affect species interactions due to differential sensitivities
Populations, food web
interactions, phenologies
Reduced spatial and temporal overlap
under hypoxia, CO2
P
erf
or
m
a
nce
P
erf
or
m
a
nce
Co-e
xi
s
tence
Co-e
xi
s
tence
T clines
T dynamics
T clines
T dynamics
Differential sensitivities
Changing phenologies
Relative changes in performance:
Δ competition
[image:11.612.46.346.71.235.2]Δsusceptibility to predation
competitiveness at the ecosystem level (Pörtner et al., 2010). There are currently no analyses available which have determined such temperature-dependent limits from this point of view or the required levels of minimal performance in the context of a thermal window. Loss of aerobic scope, overall and for specific performances, may not only be caused by unfavourable abiotic conditions like extreme temperatures, elevated CO2levels or ambient hypoxia. Such a loss
may also arise vialower food availability as well as unfavourable shifts in energy budget through limited energy availability overall or through excessive energy demands of foraging. Competition might add further costs and exploit a significant fraction of the energy budget, possibly at the expense of growth performance, developmental rate and reproductive output or of the capacity to exert combinations of these ‘activities’ fuelled by residual aerobic scope. Again, the fact that growth, development and reproduction need to operate above a minimum rate may add to the narrowing of the window to the realized thermal niche. Such energy budget components will thus need to be included in future analyses of the thermal niche and its implications at the ecosystem level.
Along with the concept of oxygen- and capacity-limited thermal tolerance a mechanistic framework emerges which is suitable for guiding the collection and interpretation of data on climate change effects at species and ecosystem levels and to avoid misinterpretation of effects and underlying principles. It also supports the development of more reliable, mechanism-based projections into the future, which is not possible with the mathematical modelling of empirical data alone. This framework may in fact help to parameterize the respective models addressing climate change effects on ecosystems. Mechanism-based projections founded on physiological knowledge and data collected under consideration of environmental scenarios and variability are therefore proposed as reliable tools to predict the change in the performance and fitness of individual species and their life-stages as well as in species interactions.
Acknowledgements
This work is a contribution to the ‘European Project On Ocean Acidification’ (EPOCA) which received funding from the European Community’s Seventh Framework Programme (FP7/2007-2013) under grant agreement no. 211384. It is also a contribution to the project ‘Biological Impacts Of Ocean Acidification’ (BIOACID) funded by the German minister of research and education (BMBF) and to the AWI research program PACES.
References
Anestis, A., Lazou, A., Pörtner, H. O. and Michaelidis, B.(2007). Behavioural, metabolic and molecular stress indicators in the marine bivalve Mytilus
galloprovincialis during long-term acclimation at increasing ambient temperature. Am. J. Physiol.293, R911-R921.
Anestis, A., Pörtner, H. O., Lazou, A. and Michaelidis, B.(2008). Metabolic and molecular stress responses of sublittoral bearded horse mussel Modiolus barbatus to warming sea water. Implications for vertical zonation. J. Exp. Biol. 211, 2889-2898. Angiletta, M.(2009). Thermal Adaptation. A Theoretical And Empirical Synthesis.
289 pp. Oxford: Oxford University Press.
Anthony, K. R. N., Kline, D. I., Diaz-Pulido, G., Dove, S. and Hoegh-Guldberg, O. (2008). Ocean acidification causes bleaching and productivity loss in coral reef builders. Proc. Natl. Acad. Sci. USA 105, 17442-17446.
Beamish, F. W. H. and Mookherjii, P. S.(1964). Respiration of fishes with special emphasis on standard oxygen consumption I. Influence of weight and temperature on respiration of goldfish, Carassius auratus L. Can. J. Zool. 42, 161, 1964. Brewer, P. G.(2009). A changing ocean seen with clarity.Proc. Natl. Acad. Sci. USA
106, 12213-12214.
Brewer, P. G. and Peltzer, E. T.(2009). Limits to marine life.Science 324, 347-348. Brodte, E., Knust, R. and Pörtner, H. O.(2006a). Temperature dependent energy
allocation to growth in Antarctic and boreal eelpout (Zoarcidae), Polar Biol.30, 95-107.
Brodte, E., Knust, R., Pörtner, H. O. and Arntz, W. E.(2006b). Biology of the Antarctic eelpout Pachycara brachycephalum. Deep Sea Res. II Top. Stud. Oceanogr.53, 1131-1140.
Buchner, T., Abele, D. and Pörtner, H. O.(2001). Oxyconformity in the intertidal worm Sipunculus nudus: The mitochondrial background and energetic consequences. Comp. Biochem. Physiol.129B, 109-120.
Caldeira, K. and Wickett, M. E.(2005). Ocean model predictions of chemistry changes from carbon dioxide emissions to the atmosphere and ocean, J. Geophys. Res.110, C09S04, doi:10.1029/2004JC002671.
Cao, L. and Caldeira, K.(2008). Atmospheric CO2stabilization and ocean acidification. Geophys. Res. Lett.35, L19609, doi:10.1029/2008GL035072. Chapelle, G. and Peck, L. S.(1999). Polar gigantism dictated by oxygen availability.
Nature399, 114-115.
Chown, S. L. and Gaston, K. J.(2008). Macrophysiology for a changing world. Proc. R. Soc. Lond. B 275, 1469-1478.
Cohen, S. P. and Strathmann, R. R.(1996). Embryos as the edge of tolerance: effects of environment and structure of egg masses on supply of oxygen to embryos. Biol. Bull.190, 8-15.
Davis, A. J., Lawton, J. H., Shorrocks, B. and Jenkinson, L. S.(1998). Individualistic species responses invalidate simple physiological models of community dynamics under global environmental change. J. An. Ecol.67, 600-612. De’ath, G., Lough, J. M. and Fabricius, K. E.(2009). Declining coral calcification on
the Great Barrier Reef. Sci.323, 116-119.
Dong, Y. and Somero, G. N.(2009). Temperature adaptation of cytosolic malate dehydrogenases of limpets (genus Lottia): differences in stability and function due to minor changes in sequence correlate with biogeographic and vertical distributions J. Exp. Biol. 212, 169-177.
Farrell, A. P. and Richards, J. G.(2009). Defining hypoxia: an integrative synthesis of the responses of fish to hypoxia. Fish Physiol.27, 487-503.
Farrell, A. P., Hinch, S. G., Cooke, S. J., Patterson, D. A., Crossin, G. T., Lapointe, M. and Mathes, M. T.(2008). Pacific salmon in hot water: applying aerobic scope models and biotelemetry to predict the success of spawning migrations. Physiol. Biochem. Zool.81, 697-708.
Fernandez, M., Bock, C. and Pörtner, H. O.(2000). The cost of being a caring mother. Ecol. Lett.3, 487-494.
Frederich, M. and Pörtner, H. O.(2000). Oxygen limitation of thermal tolerance defined by cardiac and ventilatory performance in the spider crab Maja squinado. Am. J. Physiol.279, R1531-R1538.
Gaston, K. J., Chown S. L., Calosi. P., Bernardo, J, Bilton, D. T., Clarke, A., Clusella-Trullas, S., Ghalambor, C. K., Konarzewski, M., Peck, L. S., et al. (2009) Macrophysiology: a conceptual re-unification. Am. Nat.174, 595-612. Grieshaber, M. K., Hardewig, I., Kreutzer, U. and Pörtner, H. O.(1994).
Physiological and metabolic responses to hypoxia in invertebrates. Rev. Physiol. Biochem. Pharmacol.125, 43-147.
Guderley, H.(2004). Metabolic responses to low temperature in fish muscle. Biol. Rev. 79, 409-427.
Guppy, M. and Withers, P.(1999). Metabolic depression in animals: physiological perspectives and biochemical generalizations. Biol. Rev. 74, 1-40.
Hand, S. C. and Hardewig, I.(1996). Downregulation of cellular metabolism during environmental stress: mechanisms and implications. Annu. Rev. Physiol.58, 539-563.
Hardewig, I., van Dijk, P. L. M., Moyes, C. D. and Pörtner, H. O.(1999). Temperature-dependent expression of cytochrome c oxidase in fish: a comparison between temperate and Antarctic eelpout. Am. J. Physiol.277, R508-R516. Heilmayer, O., Brey, T. and Pörtner, H. O.(2004). Growth efficiency and temperature
in scallops: a comparative analysis of species adapted to different temperatures. Funct. Ecol. 18, 641-647.
Helmuth, B., Broitman, B., Yamane, L., Gilman, S. E., Mach, K., Mislan, K. A. S. and Denny, M. W.(2010). Organismal climatology: analyzing environmental variability at scales relevant to physiological stress. J. Exp. Biol. 213, 995-1003. Hochachka, P. W.(1980). Living Without Oxygen: Closed And Open Systems In
Hypoxia Tolerance. Cambridge, MA: Harvard University Press.
Hochachka, P. W.(1986). Defense strategies against hypoxia and hypothermia. Science 231, 234-241.
Hochachka, P. W. and Lutz, P. L.(2001). Mechanism, origin, and evolution of anoxia tolerance in animals. Comp. Biochem. Physiol. 130B, 435-459.
Ishimatsu, A., Hayashi, M. and Kikkawa, T.(2008). Fishes in high-CO2, acidified oceans. Mar. Ecol. Progr. Ser. 373, 295-302.
Jansen, J. M., Hummel, H. and Wendelaar Bonga, S.(2009). The respiratory capacity of marine mussels (Mytilus galloprovincialis) in relation to the high temperature threshold. Comp. Biochem. Physiol. 153A, 399-402.
Jones, S. J., Mieszkowska, N. and Wethey, D. S.(2009). Linking thermal tolerances and biogeography: Mytilus edulis (L.) at its southern limit on the east coast of the United States. Biol. Bull. 217, 73-85.
Kassahn, K., Crozier, R. H., Pörtner, H. O. and Caley, M. J.(2009). Animal performance and stress: responses and tolerance limits at different levels of biological organisation. Biol. Rev.84, 277-292.
Krogh, A.(1914). The quantitative relation between temperature and standard metabolism in animals. Int. Z. physik. Chem. Biol. 1, 491-508.
Lannig, G., Bock, C., Sartoris, F. J. and Pörtner, H. O.(2004). Oxygen limitation of thermal tolerance in cod, Gadus morhua L. studied by non-invasive NMR techniques and on-line venous oxygen monitoring. Am. J. Physiol.287, R902-R910.
Lannig, G., Storch, D. and Pörtner, H. O.(2005). Aerobic mitochondrial capacities in Antarctic and temperate eelpout (Zoarcidae) subjected to warm versus cold acclimation. Polar Biol. 28, 575-584.
Lannig, G., Cherkasov, A. S., Pörtner, H. O., Bock, C. and Sokolova, I. M.(2008). Cadmium-dependent oxygen limitation affects temperature tolerance in eastern oysters (Crassostrea virginica Gmelin). Am. J. Physiol. 294, 1338-1346. Lucassen, M., Schmidt, A. and Pörtner, H. O.(2003). Cold induced mitochondrial
proliferation in Zoarces viviparus: Changes in enzyme activities and mRNA levels. Am. J. Physiol.258, R1410-R1420.
Lucassen, M., Koschnick, N., Eckerle, L. G. and Pörtner, H. O.(2006). Mitochondrial mechanisms of cold adaptation in cod (Gadus morhua) populations from different climatic zones. J. Exp. Biol. 209, 2462-2471.