ZIRCONIA-BASED ELECTROCERAMIC MATERIALS FOR
SOFC APPLICATIONS
Alan John Feighery
A Thesis Submitted for the Degree of PhD
at the
University of St Andrews
1999
Full metadata for this item is available in
St Andrews Research Repository
at:
http://research-repository.st-andrews.ac.uk/
Please use this identifier to cite or link to this item:
http://hdl.handle.net/10023/13601
University of St Andrews
0
0
School of Chemistry
Zirconia-based Electroceramic
Materials for SOFC
Applications
Alan John Feighery
ProQuest Number: 10166333
All rights reserved INFORMATION TO ALL USERS
The quality of this reproduction is dependent upon the quality of the copy submitted. In the unlikely event that the author did not send a com plete manuscript and there are missing pages, these will be noted. Also, if material had to be removed,
a note will indicate the deletion.
uest
ProQuest 10166333
Published by ProQuest LLO (2017). Copyright of the Dissertation is held by the Author. All rights reserved.
This work is protected against unauthorized copying under Title 17, United States C ode Microform Edition © ProQuest LLO.
ProQuest LLO.
789 East Eisenhower Parkway P.Q. Box 1346
DECLARATION
I, Alan J. Feighery, hereby certify that this thesis, which is approximately 50000 words in length, has been written by me, that it is the record of work caiTied out by me and that it has not been submitted in any previous application for a higher degree.
Date 2 6 j Signature of Candidate
I was admitted as a research student in October 1995 and as a candidate for the degree of Doctor Philosophy in October 1996; the higher study for which this is a record was carried out in the University of St. Andrews between 1995 and 1998.
Date 2 6^^ Signature of Candidate
I hereby certify that the candidate has fulfilled the conditions of the Resolution and Regulations appropriate for the degree of Doctor of Philosophy in the University of St. Andrews and that the candidate is qualified to submit this thesis in application for that degree.
2
Date Z 6 / ^ / ' ^ Signature of Supervisor
In submitting this thesis to the University of St Andrews I understand that I am giving permission for it to be made available for use in accordance with the regulations of the University Library for the time being in force, subject to any copyright vested in the work not being affected thereby. I also understand that the title and abstract will be published, and that a copy of the work may be made and supplied to any bona fide library or research worker.
ACKNOWLEDGEMENTS
I would like to thank Dr John Irvine for his supervision, guidance and encouragement over the last three years. Thanks also to Dr Iain Gibson of Queen Mary and Westfield College for his advice and Professor Chaogui Zheng of the University of Beijing for his assistance with the phase diagram work,
I would like to thank Dr Ron Smith at ISIS for assistance in performing Neutron Diffraction experiments and Drs Andy Dent, Ian Harvey and Andy Smith at the Daresbury SRS for assistance with EXAFS experiments.
Many thanlcs to the technical support staff Brian Walker, Colin Smith, Jim Rennie and of course Bobby Cathcart for his unique brand of humour.
Thanks also to the EPSRC and Tioxide Specialities Ltd for fimding.
ABSTRACT
The phase relations, electrical properties and structural characteristics of doped cubic stabilised Zirconia based electroceramic materials have been investigated using a number of characterisation techniques.
The phase relations of the ternary systems Zr0 2-Y203-Ti0 2 and Zr0 2-Gd203-
Ti0 2 at 1500°C have been investigated. Electrical characterisation in air and in low
oxygen partial pressures has been carried out using 2-probe A.C. Impedance Spectroscopy and 4-probe D.C. resistivity measurements to ascertain whether compositions within these systems could be utilised as the anode materials in Solid Oxide Fuel Cells. The effect of porosity on the ionic and electronic conducting properties of the Zr0 2~Y203-Ti0 2 system has been investigated to provide a clearer
understanding of the effect of the porosity within candidate anode materials.
The effect of AI2O3 additions on the electrical properties and stability of the Solid Oxide Fuel Cell material of choice, 8 mol% Yttria stabilised Zirconia, has been
investigated. AI2O3 has been found to remain primarily as a second phase within the
8YSZ, however a small quantity of Al^^ does dissolve into the fluorite matrix. AI2O3 has been found to have a negligible effect on the high temperature ionic conductivity of 8YSZ and improves the resistance of 8YSZ to hydrothermal degradation by
stabilising the cubic structure.
High temperature Time of Flight Neutron Diffraction has been used to linlc the change in activation energy observed in 8YSZ to a break down in local ordering of
oxygen ions. Extended X-ray absorption Fine Structure Spectroscopy has been used to characterise the local structure of the cations in 8 mol% Yttria-stabilised Zirconia.
CONTENTS
PAGES
CHAPTER 1. mTRODUCTION 1-29
CHAPTER 2. EXPERIMENTAL 30-68
CHAPTER 3. PHASE RELATIONS AND ELECTRICAL CONDUCTIVITY IN THE TERNARY SYSTEM
ZrOz-YzOa-TIOz
69-122
CHAPTER 4. PHASE RELATIONS AND ELECTRICAL 123-155 CONDUCTIVITY IN THE TERNARY SYSTEM
ZrOg-GdzOs-TiOg
CHAPTER 5. EFFECT OF ALUMINA ADDITIONS ON THE ELECTRICAL PROPERTIES OF 8 MOL% YTTRIA-STABHISED ZIRCONIA
156-190
CHAPTER 6. NEUTRON DIFFRACTION STUDIES OF 8 MOL%YSZ (Zro.8sisYo.i48sOi.926)
191-218
CHAPTER 7. EXAFS SPECTROSCOPY STUDIES OF CATION 219-236 CO-ORDINATION ENVIRONMENTS IN 8YSZ
CHAPTER 1
Introduction
1.1. Fuel Cells 1
1. Thermodynamics 1
2. Fuel Cell Technology 2
1.2. The Solid Oxide Fuel CeU 4
1. Solid Oxide Fuel Cell Design 6
2. Tubular Design 6
3. Planar Design 8
4. Monolithic Design 10
1.3. Solid Oxide Fuel Cell Materials 11
1. The Electrolyte 11
1. Yttria-stabilised Zirconia 12
2. Other Electrolyte Materials 15
2. The Anode 17
2. Ni/YSZ Cermets 18
3. Other Anode Materials 19
4. Mixed Conducting Anode Materials 19
3. The Cathode 22
4. The Interconnects 22
1.4. Aim of Project 24
LI. Fuel Cells
Fuel cells offer a means of electrochemical conversion of hydrogen or hydrocarbon fuels, (such as methane), to directly produce electricity. In theory electrochemical conversion processes offer a much higher efficiency for the generation of electricity than conventional methods.
1.1.1. Thermodynamics
The most common methods, to produce electricity are either by oil or gas fired processes, where the combustion of the fuel drives a turbine in which mechanical work is indirectly converted to electricity. These conventional processes are subject to the Carnot limitation. This is where the efficiency of an engine is given by the
equation:-T| — - T? Ti
where rj is the efficiency of the process, Ti is the temperature of the combustion process and Tz is the temperature of the heat sink. For the second law of thermodynamics to be obeyed Tz ^ 0, therefore, energy must always be lost as heat in the suiToundings for the process to be spontaneous.
Electrochemical combustion, however, is not confined by the Carnot limitation. This is because this process gives a direct method of energy conversion e.g. The theimodynamic data for the reaction of hydrogen and oxygen, at standard conditions are AH° = -285 kJmof’ and AG° = -237 kJmof' [1,2]. Therefore in a fuel cell at constant pressure it would be theoretically possible to obtain 237kJ of electrical work, which is only slightly less than the heat evolved from combustion at constant pressure (-285kJ). This variation in energy is solely due to the loss in entropy on the formation of liquid water from gaseous hydrogen and oxygen. Theoretical efficiency of a Hz based fuel cell would therefore be given by
-237 kJ X 100 =80%
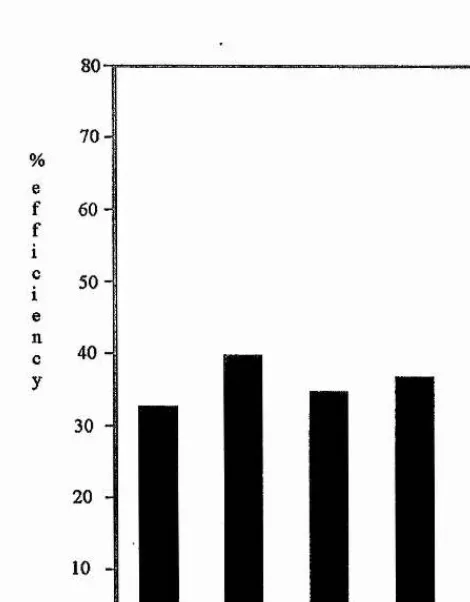
In practice the amount of energy is around 70%. Figure 1.1 compares this result with the efficiencies which are obtainable from common energy production methods. Recent developments in combined cycle gas turbine design have boosted efficiency to 55-60% [3].
80-1
70-%
e f 60 -f i c 50-i e n c 40
-y
30
20
10
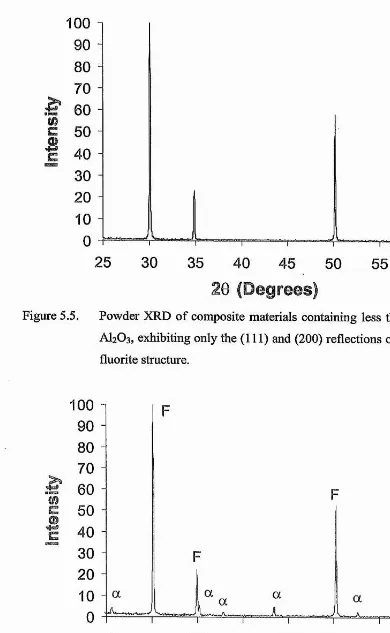
[image:10.615.176.411.168.469.2]-nuclear nat gas coal fuel cell
Figure 1.1. Comparison of the efficiencies obtainable from different energy production methods [4].
Fuel Cell Technology
Since the discovery of a simple hydrogen/oxygen fuel cell, which used sulphuric acid as the electrolyte, by Grove in 1839 [5], and the discovery of a solid-oxide electrolyte by Nemst in 1899 [6], a variety of devices have been produced. The many
(PAFC) and the Solid Oxide Fuel Cell (SOFC) [7]. For transportation, the proton exchange membrane fuel cell (PEMFC) has a clear advantage because it has a low operating temperature (60-90°C) allowing rapid start-up and its high power density lends itself to the stringent space and weight requirements required for the automotive market. For stationary applications, where the efficiency of power generation is most important, both low and high temperature fuel cells compare favourably with conventional generating methods below 500 kW. For larger, multi-megawatt power plants, the high temperature fuel cells, such as the SOFC ai*e favoured. This is because the heat generated can be used in a combined gas turbine cycle and can provide efficiencies of over 70%, some 10% higher than conventional technology. In recent years, significant advances have been made in the development of SOFCs [8-10] and many test systems are currently undergoing long tem tests.
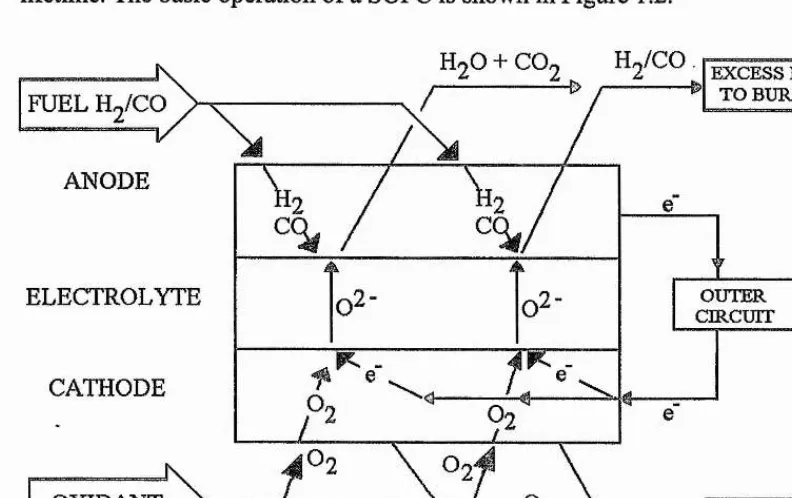
The solid oxide fuel cell (SOFC) is an all ceramic fuel cell which means there are few constraints on design. This gives it distinct advantages over other types of fuel cells because it does not require the use of either precious materials or corrosive liquids. This means it has both a low maintenance cost and also the possibility of a long running lifetime. The basic operation of a SOFC is shown in Figure 1.2.
H ./CO. EXCESS FUEL TO BURNER
ANODE
V 4k
ELECTROLYTE
CATHODE
[image:12.615.97.493.221.470.2]OXIDANT
Figure 1.2. The basic operation of a SOFC.
The fuel gases can be H2, CO or alkanes such as methane, or more realistically
natural gas. Electrochemical oxidation of alkanes can occur at the anode at the nonnal temperature of operation between 900 and 1000°C but other processes are more important. For example, methane, in the presence of oxygen can thermally decompose to carbon and water at high temperatures (>1000°C). Thus, the fuel gases are first converted into H2 and CO by steam refoiming. The steam reforming of hydrocarbon
fuels involves the endothermie reaction
which is obviously favoured by low pressure and high temperature. The water gas shift equilibrium, which is pressure independent is represented by the equation
CO (g) + H2O (g) ++ 0 0 2(g) + H2 (g) AH = -41.1 Mmol'
Thus overall, these reactions are favoured by high temperatures, a high steam ratio and low pressures. The higher hydrocarbons in natural gas also react with steam in a similar fashion.
If insufficient steam is present, carbon may be deposited according to the following equations
2CO (g) CO2 (g) + C (s) AH = -172 IcJmof' (Boudouard Reaction)
and
CH4(g) < ^2H2(g) + C(s) AH = +86.2kJmol'^
The decomposition of methane to carbon and hydrogen is obviously favoured by high temperatures, but is much less endothermie than the reforming reaction and hence will not occur in the presence of steam. The decomposition for both reactions is termed cracking and the deposition of carbon is called coking. Coking is undesirable because deposited carbon can block the flow of gas and covers the anode, lowering reforming activity. The steam reforming treatment can be done by one of three methods. These are external, integrated or internal reforming [11].
External reforming takes place in a separate reforming reactor which comprises of heated tubes filled with Nickel or Noble metal catalysts through which steam and the fuel gas is passed. The maximum efficiency of this type of aiTangement is 60%.
reforming unit and the directly contacting fuel cells. The efficiency of this set up is still around 60%.
Internal reforming takes place in every cell at the anode. The advantage of this system is that the steam produced by the fuel cell reaction contributes to the partial pressure of water vapour in the gas mixture at the anode. This therefore prevents the cracking reaction. However, the main drawback of this arrangement is that the reforming reaction is endothermie whilst the cell reaction is exothermic. This can lead to large temperature gradients over the anode which may cause damage to the cell in the form of cracks. For a natural gas fired SOFC with internal reforming, an efficiency of up to 6 8% can be realised if the waste heat is used for additional production of
electricity with a steam turbine.
1.2.1. Solid Oxide Foe! Cell Design
Westinghouse in the U.S.A. were the first major company to carry out major research on SOFCs but in recent years many other organisations have been involved in the research and development of this field [12], many stack designs have been proposed
for SOFCs but the two most common and distinct types are the tubular and planar designs.
1.2.2. Tubular Design
fibres sinter bonded with each other and also to the nickel metal in the fuel electrode. This is shown in Figure 1.4 [15]. State of the art cells have been shown to exhibit high performance and stability, and have been tested for up to 70000 hours. Typical output is 0.68V at a current density of 250 mA/cm^ on hydrogen fuel 89% Hz, 11% HgO with an 85% hiel utilisation [13,16-18]. This therefore gives a power density of 0.17 Wcm'^.
The advantages of the tubular design are that the respective gases are kept separate from each other by the actual natuie of the cell design thus eliminating the necessity of finding a material to make gas tight seals. The oxidant gas is passed through the centre of the tube by use of an injector tube whereas the fuel gas remains distinct around the outside of the fuel cell tube. There is therefore no need for any seals. Another advantage is that the long cell length is beneficial for in-situ reforming. The fuel/spent fuel mixture can be distributed along the cell and thus reduce the amount of local cooling that arises from the endothermie reforming reaction. The catalytic reforming reaction, especially using Nickel, is more rapid than the exothermic combustion reaction which leads to local cooling of the cell. The distribution of the gas mixture therefore avoids the possibility of severe local thermal stresses within the ceramic components. The nature of multi cell stacking also means that individual cells can slide along the Nickel felt when thermal expansion and contraction results in mismatches. This set up means that the formation of cracks will be limited to just one cell.
interfacial reactions involving Strontium Oxide at the high temperatures involved in the CVD deposition process.
INTERCGNNECT
ELECTROLYTE
FUEL FLOW
AIRFLOW
AIR ELECTRODE
FUEL ELECTRODE
POROUS SUPPORT
Figure 1.3. Sealless tubular design of SOFC (Westinghouse) [14].
POSm VE CURRENT COLLECTOR FUEL
FUEL
NICKEL PLATED OVER INTERCONNECT
FUEL
NICKEL FELT
FUEL
OXIDANT OXIDANT
NICKEL FELT
OXIDANT OXIDANT
NICKEL FELT INTERCONNECT
ANODE ELECTROLYTE CATHODE
POROUS SUPPORT TUBE
NEGATIVE CURRENT COLLECTOR
1.2.3. Planar Design
The planar design is the simplest configuration of components and is stated to offer 10-100 times greater volumetric power density than the tubular designs [13]. A representation of this design is given in Figure 1.6. [14]. A single cell comprises of a three layer stmcture of anode, electrolyte and cathode, which are sandwiched together. The fiiel cell stack is made by separating subsequent cells by a bipolar interconnect which has ribs on each side to allow the passage of the gases. Different geometries can be obtained by the direction of these interconnects, either co-flow or cross-flow. A complete SOFC planar stack is formed by the continued stacking of the layers to the desired height. The nature of the planar design allows many fabrication methods to be employed. Some examples are CVD, EVD [20,21], plasma spraying [22], laser evaporation [23] or most simply screen printing of electrodes onto a tape cast electrolyte. Typical output of a single cell with the planar arrangement is 0.7 V at a current density of 260 mAcm'^. This therefore shows a power density of 0.18 Wcm'^. This is similar to that of the tubular cell but shows a higher volumetric power density than that of the tubular design [14].
The other major advantages of the planar design are that the electrode production process can easily be accomplished by mass production methods such as screen printing and tape casting. These processes aie easier and cheaper than the CVD/EVD methods utilised in the tubular design.
via the interconnect is important. A limited contact area will lead to a long path for the current in the plane of each electrode. This can lead to high ohmic losses.
V/
FUEL tO /H ,
Figure 1.6. Planar Design of the SOFC [19].
1.2.4. Moffiolithic Design
end plate
anode Ni/YSZ cermet electrolyte YSZ cathode LaMnOo
bipolar separator plate: oxide, Ni, Cr-alloy
anode Ni/YSZ cermet
INTERCONNECT
ANODE
CATHODE
OXIDANT
FUEL
ELECTROLYTE
Figure 1.5. The Monolithic design of a SOFC.
1.3. Solid Oxide Fuel Cell Materials
1.3.1. The Electrolyte
The electrolyte, typically formed by the sintering of a compacted powder, has to be dense, preventing any gaseous diffusion through the electrolyte and contain very low levels of impurities, which can have a detrimental effect on the oxide ion conduction. Either of these factors would produce ohmic losses, with a corresponding decrease in the cell voltage, E and the efficiency of the cell. The electrolyte must also be a purely ionic conductor over a wide range of oxygen partial pressures. The current solid electrolyte of choice is Yttria stabilised Zirconia. Several manufacturers produce YSZ by different routes resulting in products with often vastly different properties. For example Tosoh produce 8YSZ by a co-precipitation route and Tioxide used a plasma
For planar solid oxide fuel cells, which have a higher power density and lower fabrication costs than the tubular design, tape casting is well suited for the production of thin membranes. For example, the production route used by Domier consisted of mixing the ceramic raw materials Z1O2, Y2O3 and AI2O3 together and processing with organic
components such as solvents, plasticizer and binder to form a slurry [25]. Pore formation prevention is achieved by deaerating the slurry and then metering it to a casting head. The slurry is drawn out to form a tape between two adjustable blades and Mylar carrier foil. The solvents are then evaporated from the cast tape in a drying tunnel using infrared radiators. The 'green' sheets which are obtained are then punched out from the dried flexible tapes. The punching residue can then be dissolved and mixed-in with the fresh slurry for re-utilisation. The punched-out substrates are then sintered at greater than 1500°C for several hours.
Yttria-stabilised Zirconia
Pure Zirconia can exist in three polymorphs at ambient pressures. The differences in the structures of the three polymorphs are illustrated by the changes in cell angle and lattice parameter shown in Table 1.1.
Table 1.1. Crystallographic data for the three polymorphs of Zirconia[26, 27, 28].
Monoclinic Tetragonal Cubic
Space Group P2i /c Space Group P42/nmc Space Group Fm3m
a = 5.3129 Â a = 5.094 Â a = 5.090 Â
b = 5.2125 Â c = 5.177 Â c = 5.1471 Â
p =99.218°
Po = 5.820 gcm'^ Po = 6.090 gcm*^ Po = 6.206 gcm'^
Metastable, or kinetically stable, tetragonal Zirconia has been obtained at room temperature, but its formation is dependent upon crystallite size and cooling regime [31]; metastable tetragonal Zirconia requires crystallite sizes less than 30 nm. A metastable tetragonal Zirconia phase is commonly obtained from the preparation of Zirconia by wet chemical processing routes e.g. sol-gel [32], where crystallites with diameters between 10 and 30 nm are readily obtained.
The instability of the cubic Zirconia polymorph at room temperature is unusual compared to other and M'^‘^02 compounds with the fluorite structure e.g. Th0 2,
Cap2, which are cubic at room temperature. The fluorite structure is illustrated in Figure
1.7. It consists of a cubic close packed array of Zirconium ions, with oxygen occupying all the tetrahedral sites between the close packed layers. The cubic close packed layers of metal ions are oriented parallel to the {111} planes of the unit cell. In the fluorite structure with space gioup Fm3m, Zirconium and Oxygen ions are located at the following positions:
Zr 4(a) 00 0
O 8(c) + (000, %K0, !40&^, 0^!4) + %%%
Alternatively, redefining the origin of the unit cell by displacing the unit cell along one of the body diagonals by one quarter of the length of the diagonal, i.e.
the Fluorite structure can be described as a primitive cubic array of anions in which the eight co-ordinate sites at the cube body centres aie alternatively empty and occupied by a cation.
As the unit cell of the fluorite structuie is orthogonal, calculation of the interatomic distances is straightforward and involves simple trigonometric calculations. The formulae for the interatomic distances in the cubic fluorite structure are thus:
Cation - Anion distances: d^ = ((a/2)^+(a/2)^)+(a/2)^ == 3aVl 6 .'.d = 3'^a/4 = 0.433a
Zirconia usually shatters on heating because of the changes in volume that accompany the monoclinic c* tetragonal transition. The tetragonal to monoclinic transition is accompanied by a 5% contraction in volume. The phase transition and the shattering may be avoided by doping with MgO, CaO, Y2O3, Gd203 and rare earth
oxides [29]. These oxides form solid solutions with the high temperature, cubic polymorph of Zr0 2 (stable only at > 2400°C in pure Zr0 2) and these cubic solid
solutions are stabilised to much lower temperatures.
The stabilisation involves the substitution of the aliovalent cation for Zirconium, with a corresponding introduction of oxygen vacancies as the charge compensating species. Stabilised Zirconia has reversible expansion/contraction behavioui* on thermal cycling without any disruptive phase transitions. The substitution of Zirconium with Yttrium is summarised below using Kroger-Vink notation [33], which is commonly used to describe the reaction of point defects. The introduction of oxygen vacancies leads to oxide-ion conductivity in doped Zirconia.
Y2O3 — Z1O2 > 2Yzr’ + Vo" + 30o
Yzr represents a negatively charged defect of a Y^’*' ion on a Zr"^^ ion lattice site, Vo a positively charged oxygen vacancy and Oq an oxygen ion on its lattice site.
Because of the larger ionic radius of the aliovalent dopant (1.15Â for Y^^ compared to 0.98Â for Zr"^*^, in eight fold co-ordination) the tetragonal and cubic polymorphs of Zirconia are stabilised to lower temperatures due to an increase in the average cation radius. This subsequently allows an increase in the co-ordination number of the cation from 7 in the monoclinic structure to almost 8 in cubic stabilised Zirconia;
13.1.2. Other Electrolyte Materials
An alternative to stabilised Zirconia is the use of Ceria based electrolytes. CeOz solid solutions show higher oxygen ion conductivity values than doped Zirconia (see Figure 1.8) and also higher values of oxygen surface exchange coefficient [34]. These factors suggest that similar power densities can be obtained from stacks incorporating CeOz electrolytes at lower temperatures than similar stacks incorporating Zr0 2 based
electrolytes. This reduced temperature of operation will be beneficial in terms of a decrease in the number of thermally related materials problems such as exchange of ions between component layers and/or the introduction of cracks between component layers due to thermal cycling. However all of these beneficial properties are offset by the redox behaviour of Ce"^^, and the resulting introduction of electronic conductivity when is the oxygen partial pressure is low i.e.
0 0"" K Oz + Vo" + 2e' (Ce^^l
The increase of electronic conductivity due to the presence of Ce^^ severely decreases the magnitude of the ionic domain of Ce0 2 based electrolytes. Recent work
on the doping of the basic Ce0 2 material with small amounts of dopant ions have been
shown to widen the ionic domain [35]. Other researchers suggested coating the Ce0 2
with a stabilised Zr0 2 layer which effectively suppresses the reduction of Ce0 2 [36,37].
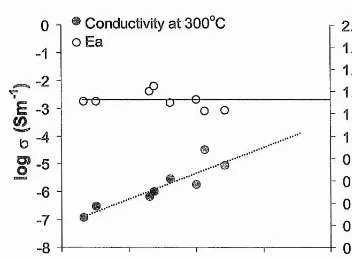
Bi2Û3 based oxides also exhibit high oxide ion conduction e.g. Bi2Vo.9Cuo.1O5.35
(BiCuVOx) has an oxide ion conductivity 50 to 100 times greater than any other electrolyte at 300°C but like the Ce0 2 based oxides, n-type semiconduction is dominant
a)
b)
Figure 1.7 a)The face centred cubic fluorite structure of Yttria-stabilised Zirconia
Ishihara et al reported that LaGaO] exhibits high oxide ion conductivity when Sr is doped for the La site and Mg for the Ga site [40]. Lao.9Sro.1Gao.8Mgo.2O3, which has
the perovskite structure exhibits an oxide ion conductivity higher than that of Sc-doped ZrOz and lower than that of Bi203. The conductivity of doped LaGaOg is 10 Sm'‘ at
850°C, i.e. the same as the conductivity in 8 mol% Yttria Stabilised Zirconia at 1000°C.
However, recent structural studies indicated that several phase transitions occur in doped LaGaÛ3 between room temperature and 1000°C [41,42], which indicates that it is
unlikely that it will replace YSZ as the material of choice for SOFC devices.
Temperature (*^C)
900 800 700 600 500 400 300 " STAINLESS STEEL
Cr^fÈlY^Ojl. mCONEL-AlzO]
0
Rq s Uw = QMahmxm^ j SRI,F SUPPORTED ELECTROLYTES 1
•2 15 nm
SUPPORTED ELECI'ROLYTES •3
-4
0.8 1.8 2.0
IOOO/T(IO^xK'*)
Figure 1.8. Comparative conductivities of CqOi and Zr0 2 based electrolyte materials
[34].
1.3.2. The Anode
1.3.2.2. NI/YSZ Cermets
The anode currently used in SOFC development is a Nickel/YSZ cermet, which incorporates active particles of Nickel in an inactive YSZ support. The fuel oxidation occurring at the anode involves the adsorption of the fuel onto the Nickel, e.g.
Hz + 2Ni 2NiH
2NiH + o HzO + 2Ni + V»" + 2e"
The Nickel metal is dispersed in YSZ to support the Nickel particles, to prevent the fusion of the Nickel particles at high temperatures, to match similar thermal expansion of the anode and electrolyte and to provide a porous structure. The porous structure is required so that the reaction of the fuel gas with the oxygen ions and the electrons can occur over a large surface area. Electronic conductivity [44] and the thermal expansion [45] both increase with Nickel content, so to prevent the thermal expansion from becoming too different from that of the electrolyte a compromise has to be made. A typical Nickel content of 30 vol% is used, producing a porosity of 30% and a conductivity significantly greater than the accepted minimum value of 50 Scm'^ [46]. The Nickel is usually introduced to the YSZ powder as NiO and is reduced in situ in the fiiel cell, providing an enhanced porous microstructure [47].
There are, however, several problems associated with Ni/YSZ cermets. These include the sintering of Nickel [48], which reduces the active surface area available for oxidation to occur, Nickel Sulphide formation due to Sulphur being present in the natural gas [49] and carbon deposition, especially from higher hydrocarbons [50]. The carbon deposition also catalysed by Nickel which means that steam must be present to prevent coking from occurring. This coking is reduced by steam reforming but anode degradation in the form of Nickel sintering occurs with high partial pressures of steam [51]. Lithium addition to the anode has been reported to significantly lower the activation energy for surface carbon removal from the anode [52].
and a binder. Thickness of the applied films and the grain size can be controlled by varying the ratio of the components in the mixture.
1.3.2.3. Other Anode Materials
Ruthenium/Stabilised ZrOz cermets have been studied and shown to have a higher resistance to sintering whilst still possessing a high reforming activity [53]. Cobalt/stabilised Z1O2 cermets have also been investigated and shown to have a higher
tolerance to Sulphur than Nickel/YSZ ceimets [54]. The cost of Co, however, is much higher. The suitability of mixed valence states such as found in LiTi204, MgxTia-xOs,
CrTi2 0s and Nb doped MgTi2 05, Mg2Ti0 4 and Sm2Ti2 0? have been studied by Steele et
al [55]. Of these the mixed Niobium, Magnesium pseudobrookites looked the most promising. However these materials are unstable over a wide range of oxygen partial pressures.
1.3.2.4. Mixed Conducting Anode Materials
Mixed conducting oxides have been proposed for use as SOFC anodes [56]. These have been said to offer theoretical improvements in performance over purely electronic conductors. This is because in cermet anodes based on electronic conductors the oxidation of fuel can only occur at the so called triple point regions between the electrolyte, electrode and the gas, Figure 1.10a. In a mixed conductor, however, the oxygen ions can move through the electronic conducting matrix and the electrochemical combustion of hydrogen can occur over the whole particle surface area. Figure 1.10b. This larger surface area for reaction results in lower polaiisation losses at the electrode.
The most common mixed conductor studied is that of oxides based on solid solutions in the Zr0 2-Y203-Ti0 2 system [56-62]. Due to the presence of a variable
SOFC stack, Figure 1.11. Any potential replacement for Ni/YSZ cermets must have high conductivity although not necessarily as good as conventional Ni cermets.
a
8
.2 10
0 10 20 30 40 50 60 Volume% Nickel
Figure 1.9a Conductivity ofNi/YSZ cermet versus Ni content at 1000°C [14]. VOL%Ni
0 15 30 51 72 100
S 12
0 20 40 60 80 100
VOL%NiO
Nickel
Particle
O " O
Y
SZ electrolyte
Triple
Point
Figure 1.10a. Reaction area for a cermet composed of ionic conducting and electronic conducting components.
Mixed
Ccmducting
Particle
Whole particle acts
as
a
triple
point
c r
YSZ electrolyte
1.3.3. The Cathode
Doped Lanthanum Manganite is the cathode material currently used in SOFCs due to its high electronic conductivity in oxidising atmospheres [64-66], Replacing some La^^ in LaMnOs, with Sr^^ can improve the conductivity, by increasing the content [67].
i.e. LaMnOs — SrO--- > La^+i.xSr^Mn^^.xMn'^^xOs
A substitution of 10 mol% Sr^"*" produces an increase in electronic conductivity from 75 to 125 Scm'* at 1000°C [6 8]. The thermal expansion coefficient of LaMnOs is quite
similar to that of Yttria stabilised Zirconia (11.2 x 10’*^ and increases slightly with the addition of strontium [69]. Accurate tailoring of the thermal expansion can be made by the substitution of smaller Ca^^ for La^VSr^"^. A significant problem which has recently received much attention [70-73] is the reaction of the cathode and electrolyte during co-sintering and in reducing atmospheres at fuel cell temperatures, producing poorly conducting phases e.g. La2Zr2 0? [74] which increase the ohmic losses and
reduce the performance of the fuel cell.
1.3.4. The Interconnects
producing highly reactive powders, sintering of LaCrOs to near full density in air has been possible [80].
Reaction spraying is an efficient means of powder processing [81]. This technique utilises aqueous solutions of chlorides and nitrates, which are pumped into a reactor, which has a temperature above 1000°C. Atomisation is carried out by means of pressure and the powder is separated by filters. When falling from the top to the bottom of the reactor, the droplets undergo the stages of solvent evaporation, decomposition of the salts and formation of the perovsldte phase, which has a small crystallite size. The small crystallites result in good sintering behaviour.
The powder obtained from the reaction spraying can then be ball milled to prepare a tape casting slurry. Slurry preparation is usually performed in an annular ball mill by mixing the powder with solvents, plastisizers and organic binders.
Temperature (®C) 11001000 900 800 700
10"
10"
R
(Qcm ) 10
10"
10"
10,-3
YSZ electrolyte
LaCrOg (Mg) inta*connect
LaMhOj (Sr) cathode
Ni/YSZ cermet anode
0.7 0.8 0.9 1.0 1.1 1.2 1.3 1000/T(10^ X K"b
1.4. Aim
Yttria-stabilised Zirconia (YSZ) is likely to remain the material of choice for the electrolyte in Solid Oxide Fuel Cells (SOFC), due to its high oxide-ion conductivity at 800-1000°C. Nickel/YSZ cermets are currently used as the anode materials in SOFCs because of their compatibility with the YSZ electrolyte and their high electronic conductivity. However, 8 moI% YSZ is metastable resulting in degradation of
conductivity with time at fuel cell operating temperatures and is fragile, restricting the thicloiess and thus conductivity of YSZ plates required for use in the planar design of SOFCs. The cermet anodes also have several problems associated with them, particularly the build up of carbon on the nickel. Thus for SOFCs to become commercially viable devices, the electrolyte 8YSZ must be stabilised to reduce
degradation in conductivity with time and strengthened. New anodes must be found in order to replace the current Nickel/YSZ cermets.
The aims of this study are to address these materials problems to aid SOFC commercialisation. The aims are essentially threefold:
1. In the search for viable alternatives to Ni/YSZ ceimets as anode materials, determine and characterise the single phase cubic regions of two rare earth stabilised Zirconia systems, which have been doped with reducible Ti"‘‘^, in teims of their structural and electrochemical properties (chapters 3 and 4).
2. To strengthen the YSZ electrolyte so that it may be used in planar SOFCs, determine the effect of Alumina additions on the electrical, structural and mechanical properties of 8 mol% YSZ. Also included in the this work is the
addition of the Calcium Aluminate oxide ion conductor Cai2Ali4033 to 8YSZ
(chapter 5).
1.5. References
[1] P.W. Atkins, Physical Chemistry 3rd edition, Oxford University Press (1988) [2] KJ. Laidler, J.H. Meiser, Physical Chemistry, Benjamin/Cummings Publishing
Co. Ltd. (1982)
[3] L.J.MJ. Blomen, J. Suklceland W. Lansinlc in 'Proc. 2nd European Solid Oxide Fuel Cell Forum', ed. B. Thorstensen, (1996)
[4] Handbook of Fuel Cell Technology, eds Carl Berger, Prentice-Hall, Inc/Engelwood Cliffs N.J. (1969)
[5] W.R. Groves, Philos. Mag. 14 (1839) 127-130 [6] W. Nemst, Z. Elektrochem 6 (1899) 41-43
[7] B.C.H. Steele, MRS Bull. 14[6] (1989) 19-23
[8] Proc. 1st. Intl. Symp. on Solid Oxide Fuel Cells, ed. S.C. Singhal (The
Electrochemical Society, Pennington, New Jersey 1989)
[9] Proc. 2nd. Intl. Symp. Solid Oxide Fuel Cells, eds. F. Grosz, P. Zegers, S.C. Singhal and O. Yamamoto (CEC Publ. EUR 13546 EN, Brussels, Belgium 1991)
[10] Proc. 3rd. Intl. Symp. on Solid Oxide Fuel Cells, 1993, 93-94
[11] K. Ledjeff, T. Rohrbach, G. Schaumburg in Proc. 2nd Int. Symp. On SOFC. eds F. Gross, P. Zegers, S.C. Singhal and O. Yamamoto. Commission of the European Communities, Luxemboui'g (1991) 324
[12] M. Mogensen in 14th Riso Int. Symp. On Materials Science, eds. F.W. Poulsen, J.J. Bentzen, T. Jacobson, E. Skou and M.J.L. Ostergard (1993) 117
[13] W.J. Dollard in Proc. Int. Symp. On SOFC, eds. O. Yamamoto, M. Dokiya and H. Tagawa, Nagoya, Japan, (1989) 1
[14] N.H. Minh, J. Am. Ceram. Soc. 76 (1993) 563 No. 3
[15] N.Q. Minh, High Temperature Fuel Cells Part II. The solid oxide fuel cell. CHEMTECH 21 (1991) 120
[16] Westinghouse Electric Corp. SOFC power generation system. The status of the cell technology. A topical report. Rept no. DOE/ET/17089-15, U.S. Dept, of energy, Washington D.C. 1984
[18] A.O. Isenburg in Fuel Cell seminar abstracts (Tuscon) AZ) Courtesy Associates, Washington D.C. (1985) 102
[19] B.C.H. Steele, in Int. Symp. On SOFC. eds. O. Yamamoto, M. Dokiya and H. Tagawa. Nagoya, Japan. (1989) 135
[20] Y.S. Lin, L.G.J. de Haart, K.J. Vries and A.J. Burggraaf in Pro. Int. Symp. on SOFC eds. O. Yamamoto, M. Dokiya and H, Tagawa, Nagoya, Japan (1981) 67. [21] K.J. de Vries, R.A. Kuipers and L.G.J. de Hart, in Proc. 2nd Int. Symp. on
SOFC. eds. F. Gross, P. Zegers, S.C. Singhal and O. Yamamoto. Commission of the European Communities Luxembourg (1991) 135
[22] L.W. Tai and P.A. Lessing, Plasma Spraying of porous electrodes for a planar solid oxide fuel cell, J.Am.Ceram.Soc. 74 (1991) 501
[23] H. Nagagawa, S. Kosuge, H, Tsuneizumi, E. Matsuda, H. Milhara and Y. Sato in Proc. Int. Symp. on SOFC eds. O. Yamamoto, M. Dokiya and H. Tagawa, Nagoya, Japan (1981) 207
[24] D.C. Fee, P.E. Blackburn, D.E. Busch, T.D. Claar, D.W. Dees, J. Dusek, T.E. Easier, W.A. Ellingson, B.K. Flandermeyer, R.J. Fousek, J.J. Piccaolo, R.B. Poeppel and S.A. Zwick, in: 1986 Fuel Cell Abstracts (Courtesy Associates, Washington DC 1986) 40-43
[25] W. Schafer, H. Geier, G. Lindemann and D. Stolten in 14th Riso Int. Symp. on Materials Science. Eds. F.W. Poulson, J.J. Bentzen, T. Jacobsen, E. Skou and M.J.L. Ostergard, Roskilde, Denmark (1993) 409-416
[26] McCullough, J.D. and Trueblood, K.N., Acta Crystallogr., 12 (1959) 507-511 [27] G. Teuffer, Acta Cryst. 15[11] (1962) 1187-1188
[28] D.K. Smith and C.F. Cline, J. Am. Ceram. Soc. 45[5] (1962) 249-250 [29] H.G. Scott, J. Mat. Sci. 10[9] (1975) 1527-1535
[30] M. Yoshimura, Ceram. Bull. 67[12] (1988) 1950-1955 [31] R.C. Garvie, J. Phys. Chem. 69[1] (1965) 1238-1243
[32] T. Okubo and H. Nagamoto, J. Mat. Sci., 30[3] (1995) 749-757 [33] F.A. Kroger and H.J. Vinlc, Sol. State Phys. 3 (1956) 307
[34] B.C.H. Steele in Proc. 1st European SOFC forum, Lucerne, Switzerland ed, U.Bossel. 1 (1994) 375
[38] Yahiro, H., Eguchi, Y., Eguchi, K. and Arai. H. J. Appl. Electrochem. 18 1988
527
[39] P. Kurek, J.R. Dygas, M.W. Breiter, J. Electroanalytical. Chem. 378, 1994, No.l-2,pp.77-83
[40] Ishihara T., Matsuda H., and Taldta Y., J. Am. Chem. Soc. 116,1994, 3801- 3803
[41] P. Slater, J.T.S. Irvine, T. Ishihara and Y. Takita, Solid State Ionics 107 (1998) 319-323
[42] P. Slater, J.T.S. Irvine, T. Ishihara and Y. Takita, J. Solid. State. Chem. 139[1] (1998)135-143
[43] N.Q. Minh, J. Am. Ceram. Soc. 76[3] (1993) 563-588
[44] D.W. Dees, T.D. Claar and B. Flandermeyer, J. Am. Ceram. Soc. 69[8] 628-633 (1986)
[45] S. Majumdar, T.D. Claar and B. Flandermeyer, J. Am. Ceram. Soc. 69[8] 628- 633 (1986)
[46] N.Q. Minh, in: Science and Technology of Zirconia V, eds. S.P.S. Badwal, M.J. Bannister and R.H.J. Hanninlc (Technomic Publishing Co. Inc., Lancaster USA
1993) 652-663
[47] N.Q. Minh, J. Am. Ceram. Soc. 76[3] (1993) 563-588
[48] N. S. Jacobson, W. L. Worrell, Proc. High Temp. Mater. 2 (1983) 217
[49] F. P. F. van Berkel, F. H. van Hueveln, J. P. P. Huijsmans, Solid State Ionics 72
(1993)636
[50] B. C. H. Steele, I. Kelly, H. Middleton, F. Rudkin, Solid State Ionics, 28-30
(1988) 1547
[51] S. H. Clarke, A. L. Dicks, K. Pointon, T. A. Smith and A. Swann, Catalysis Today 38 (1997) 411-423
[52] Catalysis Letters 49 (1997), 189-192
[53] M. Suzuki, H. Sasaki, S. Otoshi and M. Ippommatsu in Proc. 2nd Int. Symp. On SOFC. eds. F. Gross, P. Zegers, S.C. Singhal and O. Yamamoto. Commission of the European Communities Luxembourg (1991) 585
[54] T.L. Markin, R.J. Bones and R.M. Dell in conference on superionic conductors eds. G.D. Mahou and W.L. Roth, Plenum Press N.Y. (1976) 15
[56] M. Mogensen in 14th Riso Int. Symp. On Materials Science. Eds. F.W. Poulson, J.J. Bentzen, T. Jacobsen, E. Skou and M.J.L. Ostergard (1993) 117
[57] H. Naito and H. Arashi, Solid State Ionics 53-56 (1992) 436-441
[58] T. Lindegaard, C. Clausen and M. Mogensen, Proc. 14th Mater. Sci: High Temperature Behaviour of Fast Ion and Mixed Conductors, eds. F.W. Poulsen, J.J. Bentzen, T. Jacobsen, E. Skou and M.J. Ostergard, Riso Nat. Lab., Denmark,
1993
[59] C. Heremans and B.J. Wuensch, J. Sol. State Chem. 117 (1995) 108-121 [60] L.S.M. Traqueia, T. Pagnier and F.M.B. Marques, J. Eur. Cer. Soc. 17 (1997)
1019-1026
[61] K.E. Swider and W.L. Worrell, J. Electrochem. Soc. 143(11) (1996) 3706-3711 [62] W.L. Worell, Solid State Ionics 52 (1992) 147-151
[63] H. Arashi and H. Naito, Solid State Ionics 53-56 (1992) 431-435
[64] J.T.S Irvine, D P. Fagg, J. Labrincha and F.M.B. Marques; Catalysis Today, 38
(1997)467-472
[63] M. Kertesz, I. Reiss, D.S. Tannhauser, R. Langpape and F.J. Rohr, J. Sol. State Chem. 42 (1982) 125-129
[6 6] H. Lauret, E. Caignol and A. Hammou, in: Proc. 2nd. Intl. Symp. Solid Oxide
Fuel Cells, ed. S.C. Singhal (The Electrochemical Society, Pennington, New Jersey 1989) 242-253
[67] A. Hammouche, E.L. Schouler and M. Henault, Solid State Ionics 28-30 (1988) 1205-1207
[6 8] B. Goodenough, Phys. Rev. 100 (1955) 564-573].
[69] N.Q. Minh, in: Science and Technology of Zirconia V, eds. S.P.S. Badwal, M.J. Bannister and R.H.J. Hannink (Technomic Publishing Co. Inc., Lancaster USA 1993) 652-663
[70] S. Srilomask, D.P. Schilling and H.U. Anderson, in: Proc. 1st. Intl. Symp. on Solid Oxide Fuel Cells, ed. S.C. Singhal (The Electrochemical Society, Pennington, New Jersey 1989) 129-140
[71] O Yamamoto, Y. Talceda, R. Kanno and M. Noda, Solid State Ionics 22 (1987)
241-246
[73] H. Yokokawa, N. Salcai, T. Kawada and M, Dokiya, Solid State Ionics 40/41 (1990) 398-401
[74] H. Taimatsu, K. Wada and H. Kaneko, J. Am. Ceram. Soc. 75[2] (1992) 401- 405
[75] D, Stolten, M. Knrbjuhn and W. Wagner, Int. Conf. Ceramic Processing Science and Technology, (1994), Germany
[76] G.H. Jonlcer, PhysicaC (1954) 1118-1122
[77] R. Beqoan, C. Romand and J.P. Coutures, High Temp. Sci. 13 (1980) 173-188 [78] A.M. Anthony, G. Benezech, F. Cabannes, M. Faucher, M Foëx, V. Loc and D.
Yerouchahni, in: Proc. 3rd Intl. Symp. On High Temperature Technology (Butterworths, London, UK 1967) 215-233
[79] H.U. Anderson, in: Processing of Ciystalline Ceramics, eds. H. Palmour III, R.F. Davis and T.M. Hare (Plenum Press, New York 1978) 469-477
[80] L.A. Chick, J.L. Bates, L.R. Pederson and H.E. Kissinger, in; Proc. 1st Intl. Symp. on Solid Oxide Fuel Cells, ed. S.C. Singhal (The Electiochemical Society, Pennington, New Jersey 1989) 170-187
CHAPTER 2
Experimental
2.1. Sample Preparation 30
1. Powder Preparation 30
1. Solid State Synthesis 30
2. Ball Milling 30
3. Coated Yttria-stabilised Zirconia 30
4. Co-precipitated Yttria-stabilised Zirconia 31
2. Powder Compaction 31
3. Sintering 31
2.2. Phase Diagrams 36
2.3. Sample Characterisation 39
1. Density measurements 39
2. X-Ray Diffraction 39
3. Neutron Diffraction 41
4. AC Impedance Spectroscopy 42
1. Theory 43
2. Equivalent Circuits 44
3. Capacitance Values 50
4. Modulus 50
5. Conductivity and the Arrhenius Equation 53
6. AC Impedance Sample Preparation 57
7. Experimental Procedure 57
8. Jig Conection 57
5. 4-Probe D.C. Conductivity Measurements 58
1. Sample Preparation 59
6. Extended X-Ray Absorption Fine Structure 61
1. Synchrotron Radiation 61
3. Transmission EXAFS Experiments 62
4. Ion Chambers 63
5. Sample Preparation 63
64 65
66
Description of the EXAFS Experiment
The Advantages and Disadvantages of using EXAFS
Flexural Strength Testing
2.1. Sample Preparation
The properties of electroceramic materials such as YSZ are highly dependent on the nature of the starting materials e.g. particle size and impurity content. The processing of the starting materials is thus very important when producing high quality ceramics.
2.1.1. Powder Preparation
2.1.1.1. Solid State Synthesis
Binaiy and Ternary Zirconia based compositions were prepared by conventional solid state mixing. Stoichiometric amounts of the pre-dried oxide powders were ground together, under acetone, in an agate mortar and pestle for 2 0 minutes.
2.1.1.2. Ball Milling
For improved mixing, homogenisation and reducing particle size, a Fritsch planetary micro mill "pulverisette T was used. Powders were placed into Zirconia grinding bowls (25 ml volume) with seven Zirconia balls (12 mm diameter). Acetone was used as a suspension liquid for the powder, with a typical liquid to powder ratio of 1 mlg'\ Individual processing conditions will be discussed in more detail in the relevant results chapters.
2.1.1.3. Coated Yttria-stabilised Zirconia
Tioxide Specialities Ltd supplied 8 and 15 mol% Yttria-coated Zirconia powder.
process could be repeated until all of the Yttria coating had been applied to the Zirconia. The Yttria-coated Zirconia was then filtered and ball-milled to reduce particle size. The powder was used as received.
Co-precipitated Yttria-stabilised Zirconia (TZ-8Y)
A commercially available 8 mol% Yttria-stabilised Zirconia (TZ-8Y), produced
by the Tosoh Corporation (Japan), was used. Tosoh prepared the powder by the co precipitation of yttrium and zirconium salts. The process is summarised schematically in Figure 2.2. This powder is the material generally used in SOFC research and has been well characterised by other workers [1,2]. Typical properties are listed in Table 2.1. The powder was used as received.
Table 2.1. Typical properties of as-received Tosoh co-precipitated 8 mol% YSZ.
2.1.2.
Crystallite size 250 Â Surface area 16 m V ‘ Average particle size 0.06 |Lim BuUc density 5.90 gcm'^
Powder Compaction
Powders were uniaxially pressed using cylindrical steel dies of 13mm diameter. The dies were regulaiiy cleaned with a light oil in order to prevent lamination/cracking of the pellets when removed from the die. A typical pressing pressure was 2000 kgcm'^.
2.1.3. Sintering
occurs with time. 'Necks' form between grains which grow thicker and have the effect of pulling the crystals closer together, thereby increasing the density of the body. With increasing time or temperature, the body continues to shrinlc and the pores between the particles become smaller and lose their connectivity. If the pores can shrinlc to zero size or be 'swept out' to the surface of the body by grain growth, then the bulk density of the body approaches the true or theoretical crystal density. The presence of a small amount of liquid usually speeds up the sintering process greatly and the onset of sintering may occur at much lower temperatures than in the absence of a liquid. The presence of an excessive amount of liquid is obviously undesirable if the body is to maintain its shape and strength.
The possible paths for material transport which may occur during three stages of sintering are summarised in Table 2.2.
Table 2.2. Alternative pathways for material transfer during sintering [3].
Transport Path Sink of Material Source of Material
Surface Diffusion Surface Neck
Lattice Diffusion Surface Neck
Vapour Pressure Surface Neck
Boundary Diffusion Grain Boundary Neck Lattice Diffusion Grain Boundary Neck
In the case of the ZrOj-YjOj system, the melting point is well above 2500°C over the entire composition range. This means that reaction of these two oxides has to occur by purely solid state diffusion at high temperatures i.e. 1500-1700°C. The driving force for such ceramic powders with low vapour pressures is the difference in free energy between the neck region and the surface of the particles.
The process of solid state sintering involves densification by the reshaping of compacted powder through materials transfer by solid state diffusion of ions. The sintering process involves several stages [9, 10]:
(1) Neck formation between adjacent grains.
(2) Subsequent neck growth and densification producing a decrease in pore size. The microstructure consists of a 3D array of channel like pores. Some grain growth may be observed at this stage.
(3) A closed pore stage, where a small amount of porosity exists surrounded by grains. Grain growth can occur at this stage.
Linear shrinkage is approximately proportional to the inverse of the particle radius but is not greatly affected by sintering time so that small particles (~ 1pm) with
short diffusion distances are suitable for densification. The need for very fine particle sizes can be removed by using hot uniaxial pressing which utilises heat and pressure during sintering. This method produces higher density and smaller grain sizesat lower temperatures compared with uniaxial pressing and is particularly suited for the fabrication of thin plates.
In this study, the effect of TiOj additions and AI2O3 additions on the sintered
density of the YSZ system are studied in chapters 3 and 5 respectively. The effect of density on conductivity is also discussed in chapter 3.
Chlorine
Repeat if necessary
Oxygen
Mill Cool Plasma ZrCl^ Vaporiser
Dry
Filter and Wash Coat and Neutralise
Gas/Solid
Separation
Aqueous Dispersion
Final Yttria coated Zirconia product
NaOH
HCl
Base YCI3
solution
Mill for particle size reduction Na^ZrO g-Na^S i O'
ZrOCl'
Spray-dry oxide to free-flowing powder
Zircon Sand Z1O9 -SiOn
Yttria-stabilised Zirconia, TZ-8Y, obtained on calcination.
Mixed hydroxides are dried using azeotropic distillation. This involves mixtures of solvents which form an azeotrope, that is, a system that can be di^illed without change of composition.
2.2. Phase Diagrams
Phase diagrams summarise in graphical form the ranges of temperature and composition over which certain phases or mixtures of phases exist under conditions of thermodynamic equilibrium. The fundamental rule on which phase diagrams are based is the phase rule. The phase rule applies strictly only to conditions of thermodynamic equilibrium but in practice it also has great value in some non-equilibrium situations.
The phase rule is given by the equation P + F = C + 2, where P is the number of phases present in equilibrium, C is the number of components needed to describe the system and F is the number of degrees of freedom or independent variables taken from temperature, pressure and composition of the phases present.
The number of phases is the number of physically distinct and mechanically separ able (in principle) portions of a system, each phase itself being homogeneous. The distinction between different crystalline phases is usually clear. The distinction between different crystalline phases made from the same components but of different composition is usually clear . It is also possible to get different crystalline phases having the same chemical composition. This is known as polymorphism. For example, TiOg can exist as Anatase or Rutile, which have different crystal structures.
The number of components of a system is rather more difficult to visualise. It is the number of constituents of the system that can undergo independent variation in the different phases; alternatively it is the number of constituents needed in order to describe completely the compositions of the phases present in the particular system. For example all of the Yttria stabilised Zirconia compounds can be considered to be made from ZrOz aiid YjOj in varying proportions. ZrO^-YgOg is therefore a two-component system even though there are three elements present, Zr, Y and O.
In refractory systems with very high melting temperatures, such as YgO^ - ZrOg, the vapour pressure of the solid phases and even that of the liquid phase is negligible in comparison with atmospheric pressure. The vapour phase is effectively non-existent, and need not be regarded as a possible phase for work at atmospheric pressure. Such systems are called condensed systems and the phase rule is modified accordingly to give the condensed phase rule, P + F = C +1 (instead of +2). Ternary systems have four independent variables: pressure, temperature and the composition of two of the components. If the composition or concentration of two of the components in a phase is fixed, the third is automatically fixed by difference. As the systems described in this study are not volatile, the ternary system can be described by the condensed phase rule, i.e. P + F = C + i= 4 .
Ternary systems are represented by equilateral triangles and the three components form the three comers of the triangle. Temperature is represented by the vertical axis, perpendicular to the plane of the triangle. A three dimensional prism is needed to frilly display the effects of varying composition and temperature. In order to display ternary equilibria on paper it is normal practice either to project the melting relations on to the composition triangle, in much the same way that a geographical contour map is a projection of altitude, or to constmct isothermal sections.
50
40
2.3. Sample Characterisation
2.3.1. Density measurements
The conductivity of ceramic bodies is maximised when the density of the body is
100% of theoretical density, therefore it has been important to prepare samples which
have densities as close to the theoretical value as possible. The theoretical densities of compounds with the cubic fluorite crystal structure were calculated using the unit cell parameter, a in the equation below [11], in which FW is the formula weight in gmol'^ and Z is the unit cell content (formula units).
Theoretical Density, po = 1.66 x FW x Z = 6.64 x FW gcm'^
a^ a^
Sintered densities were obtained from the mass and geometric dimensions of the pellets. Sample mass was measured to ± 0.1 mg and sample radius (r) and thickness (t) to ± 0.001mm. The density (gcm'^) was calculated from the equation
mass
p = Txr^ t
The densities were expressed as a percentage of the theoretical density, which for 8 moI% YSZ (Hafhia free) was calculated to be 5.959 gcm'^ [12].
CoiTection of conductivity data for porous samples was achieved by multiplying
the measured conductivity by p/po- A more detailed study of correcting conductivity
for density is given in Chapter 3.
2.3.2. X-Ray Diffraction
Kai radiation and X-Rays of wavelength 1.54056 Â were used. Lattice parameters, and relative phase contents were determined using the associated software.
Measurement of the diffracted X-Rays was made using a small linear position sensitive detector (PSD) which had a range of approximately T 20. The detector could move through 10 - 140° 20 in small increments, the step width, which could be determined by the user.
Samples were prepared by lightly smearing an acetate foil with Vaseline, on to which approximately Img of powdered sample was applied. The acetate foil was held in a circular holder. The holder was placed into the diffractometer and rotated continuously to minimise preferred orientation.
For lattice parameter determination, X-Rays were collected over a range of 10- 110“ 20, typically with a step width of 0.5“ for the PSD. Data analysis was performed using the associated Stoe software. The collected raw data was stored in the file user.stoe. An output file listing peak positions (20 and d-spacing), the peak widths (full width at half maximum, FWHM) and relative peak intensity (I/IJ of all reflections were obtained from the raw data. This was done by using the pealc searching program PKS, and by selecting the average pealc width and the significant intensity to background ratio.
2.3.3. Neutron Diffraction
Powder neutron diffraction was carried out at the UK spallation neutron source ISIS at the Rutherford Appleton Laboratory. Spallation is the process of creating a continuous spectnmi of neutron energies by bombardment of a heavy metal target (depleted uranium or tantalum) by high energy protons. The protons are initially accelerated to 701ceV using a lineal* accelerator (LINAC). They are then injected into a synchrotron storage ring, where they are accelerated to approximately 600 GeV. At fixed intervals, these highly energetic protons are released from the storage ring and allowed to fall on the heavy metal target. The neutron beam is thus similar to a neutron beam from a reactor, the difference being that the neutrons produced by the synchrotron source have a well defined pulse structure. The number of neutrons diffracted can be analysed as a function of time to reach the detector. More energetic neutrons arrive quickly at the detectors and hence have shorter “times of flight” and vice versa. The time of flight can be converted to the equivalent d-spacing using the de Broglie’s wave/particie duality relationship and the Bragg diffraction law as follows:
= b/m^v^ = ht/m„l
(X;„ m,, and v„ aie the de Broglie wavelength, mass and velocity of the neutron, respectively; t is the time of flight and 1 is the distance between neutron chopper and
detector.)
== ht/m„l = 2dsin0
d =ht/2m„lsin0
(0 is the angle between beam and detector, d is the lattice plane spacing for the
diffraction condition). Bragg reflections aie measured at fixed scattering angles, by monitoring the 'time-of-flight' and so the wavelength (X) and d-spacing aie obtained.
furnace was used between 20 and 900°C. A thermocouple was attached next to the sample can, ensuring accurate temperature control of ± TC. The sample space was evacuated to 10'® Torr. The detector configuration consists of back scattering, 90° and low angle detector banks. Back scattering detectors produce the highest resolution, while low angle detectors allow very large d-spacings to be obtained. The 90° bank of detectors was used as this allows a broad range of d-spacings with good resolution. Data were collected over the time-of-flight range 2500-19500 microseconds. The obtained data were converted to a data file suitable for refinement using the program GENIE.
Data analysis was performed on the in-house software on the ISISE VAX mainframe situated at the Rutherford Appleton Laboratory. The peak shape was modelled using a Voigt function, with double exponential decay. Crystal structures were refined using the Reitveld method with the program TF14LS [13, 14]. Refinements were carried out in a similar approach to Argyriou [15] and were carried out in the space group Fm3m, with the occupancies and positions of Zr/Y and O fixed. Firstly, the scale factor, background and lattice parameters were refined. Finally, the isotropic temperature factors and a peak shape and peak centring function were refined. The quality of the refinement was determined by the value of the weighted profile R-factor,
^wp-2.3.4. 2-Probe AC Impedance Spectroscopy
AC impedance spectroscopy is a well-defined technique used to investigate and characterise the electrical properties and microstructure of a variety of ceramic materials
[16]. The technique has been extensively used to measure the ionic conductivity of Yttria-stabilised Zirconia [17], the effects of sintering [18], segregation of impurities
A comprehensive study of AC impedance spectroscopy and its applications has been made by MacDonald [23]. The technique involves applying an AC voltage (V) of varying frequency across the sample
V(t) = Vg sin mt
The resultant AC current (I) leads the voltage by (j), the phase shift of the transfer function, therefore
I(t) = sin (cot + (j))
The transfer function can be defined as H(co) = |H(co)| e’’*’ where
|H(co)l= Vyig and |H| is the modulus of the transfer fiinction.
H((o) is an impedance value and is denoted as Z((o) or
The complex impedance, Z*, of the electrochemical cell is a vector quantity and it is a complex number in which the magnitude and direction of the complex impedance can be represented either in polar or Cartesian co-ordinates:
Z(m) = |Z|e''*
Z((o) = Z'-jZ"
where Z’ is the real part of the impedance and Z" is the imaginary part.
The relationships between these quantities are :
(|) = Arctan(Z7Z') Z' = |Z| cos (|) Z" = |Z|sin<|)
The complex impedance can be plotted by Cartesian (Z" vs. Z’) or polar co-ordinates (|Zj vs. (j)), as shown in Figure 2.3.
Z"
Z'
Figure 2.3. The complex impedance plane, which may be plotted as Cartesian (Z" vs. Z') or polar co-ordinates (|Z|, c|)).
By measuring the amplitude and phase shift (<|)) of the current for any frequency (©), with a fixed applied voltage (V), the impedance Z is calculated and the real and imaginary components can be determined. By varying the frequency jfrom lOOmHz to
lOMHz, a complex impedance plot such as Figure 2,4. can be obtained.
Z"
Z'
2.3.4.2. Equivalent Circuits Analysis
Polycrystalline ceramic materials can obtain many components (e.g. bulk, grain boundary, pores) which can be identified by AC impedance spectroscopy. Each component can be considered as consisting of a combination of resistive and capacitive elements. This combination of resistive and capacitive elements is called an equivalent circuit and, depending on the properties of the material, different combinations will apply. The simplest equivalent circuit is obtained for either an individual ideal resistor or an individual ideal capacitor. For an ideal resistor, cunent and voltage are in phase, thus
R = v,/i„
where R is the resistance (O); thereforeZ = R
So, for a phase shift ({> = 0, Figure 2.5. is obtained.
Figure 2.5. Complex impedance plane plot for an ideal resistor.
Y* = R-'
For an ideal capacitor, the capacitance (F) is given by
C = q /V
where q is the charge stored (C) and V is the voltage (V) across the capacitor.
I - d q / d t = C(dV/dt)
For a capacitor, the current leads the voltage by 90° - out of phase -, therefore,
therefore
I - (oCVq sin (mt + Tt / 2)
lo =0)CV„
An ideal capacitor allows the flow of an AC current but blocks a D.C. current (i.e. Z -0), therefore
Z* = 1 / j(oC and
Y* =jmC
producing the complex plane in Figure 2.6.
Most components e.g. bulk, can be modelled by a resistive element and a capacitive element in parallel, the complex impedance of the parallel RC element is defined as
1 / Z * T = 1 / Z * , + 1/Z*2
or Y*T =Y*i + Y*2
and therefore Y*^ = 1 /R + jmC
i.e. Y = 1 / R and Y" = o)C
The total complex impedance is given by
Z \ = (Y \)-' = (l/R + jmC)'
= R (1 - imRO 1 +j(oRC (1 -jmRC)
= R(1 - icpRO
1 + (mRCy
= R - j R rcoRCl 1 + (coRCy 1 + (coRCy
= Z'-jZ"
i.e. Z'= R and Z" = RtcoRCl __
1 + (oRCy 1 + (coRCy
From this simple derivation, the resistance and capacitance of an unloiown component can be determined by obtaining the real and the imaginary impedances over a wide range of frequencies. From Figure 2.4. the resistance equals the real impedance when the frequency equals zero i.e. at the intercept on the x-axis. The capacitance is calculated from the equation
29xg)RC = 1
using the frequency (œ) when Z" is a maximum.
The equivalent circuit is described by parallel RC elements, connected in series. The impedance diagrams of such materials are thus generally composed of several capacitive arcs. The equivalent circuit for Yttria-stabilised Zirconia ceramics. Figure 2.7. typically can be modelled by three parallel RC elements and a diffusion element connected in series. The semicircle at high frequency is assigned to the bulk component and the adjacent semicircle at lower frequency is assigned to the grain boundary component. The low frequency semicircle is not associated purely with the YSZ ceramic but with the charge transfer reaction 20’ < - > 0 2 + 2e" and the low frequency
spike, or Warburg spike, is due to oxygen diffusion at the electrode surface. A typical impedance spectrum is shown in Figure 2.8.
BuUcR Oiain Boundary Charge Transfer
BuËcC Grain Boundaiy C Diffiision C