;2/ /00/-;9 60 ;/47/8,;<8/ ,5. 93>/ 65 9=344351 35 0392
9PCMFCK ." ,NAFCN
, ;FCOGO 9Q@JGPPCB DLN PFC .CENCC LD 7F. ?P PFC
<KGRCNOGPU LD 9P ,KBNCSO
%))$
0QII JCP?B?P? DLN PFGO GPCJ GO ?R?GI?@IC GK 8COC?NAF+9P,KBNCSO*0QII;CTP
?P*
FPPM*##NCOC?NAF!NCMLOGPLNU"OP!?KBNCSO"?A"QH#
7IC?OC QOC PFGO GBCKPGDGCN PL AGPC LN IGKH PL PFGO GPCJ*
FPPM*##FBI"F?KBIC"KCP#%$$&'#($)(
It:!g,,::~E:E~~I:8:,,~E,,··.I.~~B·t\:nm.~Ll\till:::§:.~:6~
ON
SWJMMIN.G. ... I N ... F..I.SH ..•
BY
STEPHEN D. ARCHER GATTY MARINE LABORATORY.
DEPARTMENT OF BIOLOGY AND PRECLINICAL MEDICINE, UNIVERSITY OF ST. ANDREWS.
1989.
IMAGING SERVICES NORTH
Boston Spa, WetherbyWest Yorkshire, LS23 7BQ www.bl.uk
BEST COpy AVAILABLE.
IMAGING SERVICES NORTH
Boston Spa, WetherbyWest Yorkshire, LS23 7BQ www.bl,uk
.
PAGE NUMBERING AS
P..E..C.LAR8T.IQN .•.
I hereby declare that the research reported in this thesis was carried out by me and t hat the thesis is my own composition. No part of this work has been previously
submitted for a higher degree.
The research was conducted in the Department of Biology and Preclinical Medicine, United College of st. Salvator and st. Leonard, University of st. Andrews, under the direction of Prof. I.A. Johnston .
.G..E.RT.lf.I.C.ATE. ...•..
I hereby certify that Stephen Archer has spent eleven terms engaged in research work under my direction, and that he has fulfilled the conditions of General Ordinance No. 2
"One of my good friend said, in a reggae rhythm,
don't jump in the water if you can't swim.
The power of philosophy floats thru my head
you're light like a feather,
light like a feather, heavy as lead."
This thesis is dedicated to my parents,
f1CKNQ.W.L.E..PG.EMI.;..NIS ..•.
I am indebted to Professor Ian Johnston for his constant help, guidance and enthusiasm throughout the production of this thesis.
Special thanks are also due to Dr. J. Dunn and Dr. J.D. Altringham. The work carried out during
a.B.p.
7 and recorded in Chapter 2 was a joint effort between Dr. J. Dunn and myself. Similarly, Dr. J.D. A1tringham provided constant help and advise, in particular with work included in Chapter 5.I would also like to thank the Captain and Crew of RRS. John Biscoe II and the British Antarctic Survey scientists involved in a.B.p. 7, especially Martin White and Tony North. The two months spent around South Georgia were the highlight of this studentship.
.c..ONTENfS.
SUMMARIES. i-vi
1. GENERAL INTRODUCTION. ... . . . . . . .. 1
2. MUSCLE FIBRE TYPES AND METABOLISM IN POST-LARVAL
AND ADULT STAGES OF NOTOTHENIOID FISH. . ... 27
3. KINEMATICS OF LABRIFORM AND SUBCARANGIFORM SWIMMING IN THE ANTARCTIC FISH,
NOTOTHENIA NEGLECTA .. . . 53
4. CRISTAE DENSITY AND DISTRIBUTION OF MITOCHONDRIA IN THE SLOW MUSCLE OF ANTARCTIC FISH . . . 80
5. SCALING EFFECTS ON THE NEUROMUSCULAR SYSTEM,
TWITCH KINETICS AND MORPHOMETRICS OF THE COD,
GADUS MORllUA . • • . • . • • • • • • • • • • • • • . • • • • • • • • • • • • •• 113
6. GENERAL DISCUSSION . . . 133
.$~RlES. ... . c.n~p.:t..er_._.l.. .•.. _ .. Qgn~r.: .. ~.l._l.n:t..r...Q.d.y..c..:t . .i . .Qn.-, ..
This study examines swimming in fish as a function of the performance of the locomotor musculature. Aspects of evolutionary adaptation and scaling relevant to swimming performance in fish are introduced. The concepts of
resistance and capacity adaptations are illustrated in
relation to the evolution of the suborder Notothenioidei to the antarctic environment. Alterations in hydrodynamics, swimming performance and efficiency with growth/scaling are
discussed .
. Cb~ pter ... 2...Mqs c..l e ... :fi.b..re.." .... :t.yp.e$".J~nd .. me.:t..f:;lb.Q ti.sm .... J n". post::: 1 a r val
9.nct."_ ..
~.ct.IJ.1.t ... $.t.gge..$ .... ,,.Qf._n..Q.t .. Q.t..h.e.n.iQ.i...~L.f.i .. $.h...! ..A histochemical study was carried out on muscle fibre types in the myotomes of post-larval and adult stages of
seven species of notothenioid fish. There was little
interspecific variation in the distribution of muscle fibre types in post-larvae. Slow fibres (diameter range 15-60prn) which stained darkly for succinic dehydrogenase activity
(SDHase) formed a superficial layer 1-2 fibres thick around the lateral surface of the trunk. In all species a narrow band of very small diameter fibres (diameter range 5-62~rn),
with only weak staining activity, occurred between the skin
and slow fibre layer. These have the characteristic of
9-75~m), which stain weakly for SDHase, a-glycerophosphate
dehydrogenase, glycogen and lipid.
Slow muscle fibres were only a minor component of the
trunk muscles of adult stages of the pelagic species
Champsocephalus gunnarl and Pseudochaenlchthys georglanus,
consistent with a reliance on pectoral swimming during
sustained activity. Of the other species examined only
Psilodraco breviceps and NototheniB gibberlfrons had more than a few percent of slow muscle in the trunk (20-30% in
posterior:. myotomes), suggesting a greater involvement of
subcarangiform swimming at cruising speeds. In contrast to
previous studies, no significant differences were found in
mean diameter between fibres from red-blooded and
haemoglobinless species.
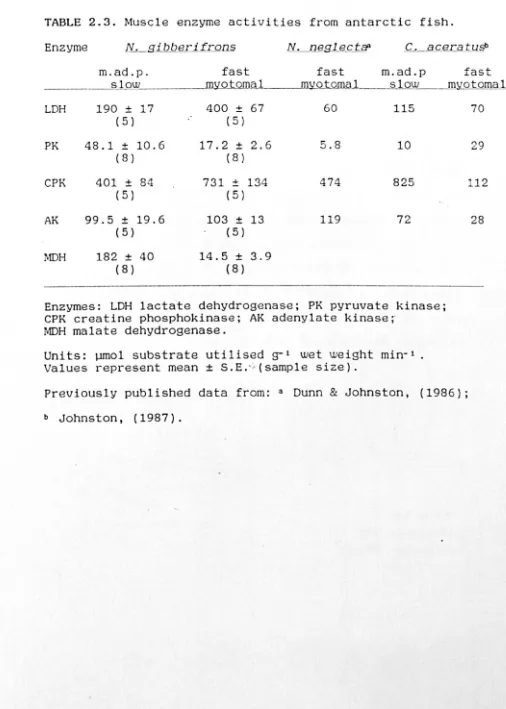
The activities of key enzymes of energy metabolism
were determined in the slow (pectoral) and fast (myotomal)
muscles of N. gibberifrons. In contrast to other demersal
antarctic fish examined, much higher glycolytic activities
were found in fast muscle fibres, probably reflecting a
greater endurance during burst swimming.
c..bJ::JP .. ~X'_:tJ.in..~ITIa tic s of 1 aJrr i fornLJ!.ruL!lUD.cJ;l...I:D.nsifm:m
~wi.mm.iDs-i..o_JJliu~nta rc tic f iRlL...Ji.Q.tJllhe.ni a negl.e£t.lL.
The kinematics of labriform and subcarangiform
swimming have been investigated for juvenile
(7-8
em)
andadult (27-30 cm) stages of the antarctic teleost,
speeds using the pectoral fins alone (labriformswimming)
were 0.8 LS-l in adult fish and 1.4 LS-l in juveniles,
where L is body length.
In adult fish, steady subcarangiform swimming is only
used at speeds of 3.6-5.4 LS-l (tail-beat frequencies of
5.0-8.3 Hz). Intermediate speeds involve unsteady swimming.
In contrast, juvenile fish employ subcarangiform swimming
at a range of intermediate velocities between the maximum
labriform and burst speeds (2.3-8.4 LS-l at tail-beat
frequencies of 4.0-12.5 Hz). These differences in swimming
behaviour a~e discussed in relation to changes in
life-style and muscle fibre type composition between juvenile
and adult fish.
Burst swimming speeds in N. neglecta have been
compared with equivalent data from temperate species. It
seems likely that low temperature limits swimming
performance in Antarctic fish. This is more noticeable in
juvenile stages, which have much higher tail-beat
frequencies than adult fish .
. C..h~p.t.e..['_4 .. ~_T.he __ c..Qmp.Qs.i.t.i.Qn_and_di.s..tr..i.t;).uUoIL.o.f._rnit.Q.c.b.Qud.d.a l.D-.l.b.~~.l.QYLJ.llY.~H;JJ;~.-2.Lant.a~$..&.
An ultrastructural study was carried out on the slow
muscle fibres of five species of antarctic fish. The
nlorphology of the capillary bed, muscle fibre
composition
and distribution and structure of mitochondria were
determined using stereological techniques.
Estimates of cristae surface density within
in haemoglobinless/myoglobinless channichthyid fish (25.2-28. 2Uffi2llIW 3) than in red-blooded species
(32.2-37. OUffi2 J..lI1T 3 ) . Lower values of Sv (cr tmi) in channichthyid species suggest lower enzyme concentrations, oxygen
consumption and ATP production capacity per unit volume of mitochondria than in red-blooded species.
Mitochondrial distribution was determined across the slow fibres of Chaenocephalu5 aceratu5, Notothenla
glbberlfrons and the temperate species, Call1onymus lyra. A lower decline in mitochondrial volume density towards the fibre centre was observed in the two antarctic species, especially C. aceratus. The homogeneous distribution and relatively high volume densities of mitochondria in
antarctic fish suggests that oxygen diffusion between capillaries and mitochondria is not a limitation. High
".
values of intermyofibrillar mitochondrial volume density
(0.51-0.25) may be related to reduced diffusion distances between mitochondria and myofibrils. Shorter diffusion pathlengths may compensate for limitations to diffusion induced by low temperatures •.
.t.w.i.tJ;lL..k..in~.tlc_~.illLmQI1LhQ..rne t ric s Q f the cod..--.!l.~~~..-mQrh.uJ:L. Twitch contraction time (time to 90% relaxation) in
cod was relatively independent
of total length, scaling in
proportion toLO.Z9. However. the extent to which
contraction time determines swimming perfornlance is not
Mean cross sectional area and weight of the myotomal
muscle scale geometrically with total length (a LZ'O' and
L3.08 respectively). The geometric scaling of myotomal
muscle mass is in accordance with previous estimates of the
scaling of muscle power output (aL3). However, there
appears to be a lack of correlation between scaling of
myotomal muscle cross sectional area and force generation
(a >LZ). This result might be explained by changes in the intrinsic properties of the contractile proteins during
growth.
The number of endplates per fibre increased with
increasing fibre length, from around 10 on fibres 2mm in
length (- lOem fish) to 20 on lOmm fibres (-40cm fish).
However, mean spacing between endplates increased from
around 0.25mm to 0.50mm. These results are discussed in
relation to the functional significance of multiple
innervation in teleost fast muscle fibres. In the light of
studies that demonstrate that teleost fast muscle fibres
are able to generate propagated action potentials, the
functional significance of polyneuronal innervation remains
obscure •
.c..b..~pJ;,_eL6.A-G~ne..rn.l._..D.~~i.QIL..
The discussion focuses on the merits and disadvantages
realised during this research, of examining
adaptation in
reduetionist or holistic terms. This involves an
examination of the relevance of muscle metabolism,
A summary of the Antarctic fish mentioned in this study. Species.
Order Perciformes
Sub-Order Notothenioidei Family Nototheniidae Pagothenia borchgrevinki
(Boulenger) .
Pagothenia (aTrematomus) hansoni (Boulenger)
Notothenia gibberifrons (Boulenger) Notothenia neglecta
(Nybelin) Notothenia rossii
(Fischer) Family Channichthyidae Chaenocephalus aceratus
(L6nnberg) Chamsocephalus gunnari
(L6nnberg)
Pseudochaenichthys georgianus (Norman)
Family Bathydraconidae Psilodraco breviceps
(Norman) Family Harpagiferidae Artedidraco mirus
(LOnnberg)
vii
Habitat of adult.
.cHAPTlili 1 ...
Swimming in fish has been studied for a wide variety of reasons. Many studies have concentrated on the metabolic costs of swimming, particularly migratory movements, in relation to the energy budgets of fish (Brett
&
Glass, 1973; Priede&
Holliday, 1980; Weatherley et al. 1982). Problems of flow obstruction due to the entrapment of fish in water intakes for electric generating stations, have also led to studies of fish swimming performance (Dorn etal. 1979; Turnpenny, 1983). Knowledge of the prolonged swimming speeds and endurance of fish allows prediction of their behaviour in the path of trawls. This may lead to more precise fishing techniques (Wardle, 1986). Locomotion
in fish has also been of intense interest to
hydrodynamicists. For instance, specialised body shapes of fast swimming scombroids have been extensively studied in relation to drag reduction mechanisms (Magnuson,1978). The
effects of prolonged exercise (Davison & Goldspink, 1977 ';
Davison, 1983) and sprint training (Gamperi et al. 1988) on growth is of relevance to fish handling and aquaculture.
This study examines fish swimming as a function of the structure and performan'ce of the locomotor mu'sculature. Of particular interest is the plasticity of muscle systems in relation to evolutionary adaptation and growth.
Of all environmental parameters which limit life,
temperature is the most pervasive; hence adaptations with
respect to
temperature are multiple and affect everyfish in relation to the low environmental temperatures at
which they live.
The way animals move and how these movements vary with·
size have long been of interest to biologists (see Pedley,
1977). This study will examine some of the consequences of
fish growth to swimming performance and muscle function.
Variations in the effects of temperature with growth will
also be considered .
. 1..,_.l .... _.AD.Ap-T.AIIQrLAND_TEMP.ERA TIJHE ....
The temperature range within which life occurs is
wide. For instance, methanogenic bacteria live at high
pressure in oceanic thermal vents, at temperatures in
excess of 25~C (Baross
&
Deming, 1984). At the oppositeend of the temperature scale, many invertebrates survive
antarctic winters at temperatures as low as -6~C (Clarke,
pers. comrn.). Amongst fish, Oreochromis B1CBlicus grBhami
live in the highly alkaline geothermal springs around the
shore of Lake Magadi, Kenya. Temperatures within these
springs are in the region of 25-4~C (Reite et al. 1974).
In contrast, antarctic fish inhabit the world's coldest
marine environment. In McMurdo Sound (780 5) fish live year
round at temperatures at which the seawater is in
equilibrium with ice, at about -1.9°C (Littlepage, 1965).
The species of fish used in this study were collected from
either South Georgia
(54
05) or 5igny Island (61
oS),
wheretemperatures are slightly higher but fall below ~C for a
large part of the year (Everson, 1977; North
&
White,Ih(L.~.v.,Ql,u..t.iQn_Q,L,Ant,a,r.:.c.,t.i~-fj,,~.b.L
During the Paleozoic and Mesozoic Eras Antartctica was
joined with Australia, Africa, India and South America. in
the super continent of Godwana1and. The break up of
Godwana1and and the continental drift of Antarctica .to it's
present polar position began about 60 million years ago, at
the beginning of the Cenozoic Era (Kennet, 1977). As
Antarctica migrated south it~carried with it the ancestors
"
of most of today's antarctic ichthyofauna.
The establishment of the circum-antarctic currents and
a steep temperature gradient at the Antarctic Convergence,
effectively isolated the aboriginal antarctic fish
population. This isolation has resulted in a high degree of
endemism in modern antarctic fish (Kennet, 1978). Of the
203 species (including some sub-species) recorded from the
Antarctic region, 88% are endemic (Andriashev, 1987).
,
Members of the suborber Notothenioidei constitute the basis
of the antarctic fish fauna and make up 53% of the species.
,
Within the Notothenioidei 97% of species are endemic to
Antarctica (Andriashev, 1987).
I\dllPla t.lon ... ,.and ,Compensat ion ...
Biological changes in response to altered environment
can occur over three different time courses. They can
involve immediate responses, acclimation or acclimatization
occurring during days or weeks
or
geneticadaptations which
may persist during many generations. This study will
concentrate on long term adaptations in antarctic fish.
Adaptations can be categorised as either resistance or capacity adaptations (Prosser, 1987).
Re..s..i.st..a..n.c.e_a._dap..t.a.U.Qns •
Resistance adaptations.occur at environmental extremes and may allow an organism to live in conditions that are not optimal in terms of rate functions. There are numerous examples of resistance or tolerance adaptations that allow antarctic fish to withstan~'very low temperatures (Clarke, 1983; Macdonald et al. 1987). The presence of glycoprotein antifreezes in the body fluids of antarctic fish prevents the growth of ice crystals in the blood plasma at
temperatures down to -2.7°C (DeVries
&
Lin, 1977). Membranes and proteins have structures which arespecialized for function at around O°C (Cossins
&
Bowler, 1987). For example, brain tubulin subunits from antarctic fish assemble in vitro and remain stable at the low ambient·temperatures experienced by these fish, whereas homologous
,proteins from homeotherms depolymerize at similar temperatures (Dietrich
&
Overton, 1986) •.c..ap.a~iY-.adp.Rt.allQD.s .
Capacity adaptaions involve the compensation of rate processes. Compensatory adaptations show similar patterns to those defined by Precht (1958) and Prosser (1973) for
acc1imatory responses (Fig. 1). The activities of a large
number of critical
metabolic enzymes exhibit complete orFeeney
&
Osuga, 1976; Johnston et al. 1975, 1977; Johnston&
Walesby, 1977, 1979; MCArdle&
Johnston, 1980). Theactivities of non-equilibrium enzymes provide information about potential carbon flux through metabolic pathways
(Newsholme
&
Paul, 1983). Slow muscle activities of the non-equilibrium enzymes hexokinase (glucose oxidation) and carnitine palmitoyltransferase (fatty acid oxidation), are similar in notothenioids at,~C to those in temperate fish at 15o C, exhibiting almost complete temperaturecompensation (Johnston
&
Harrison, 1985) •. A.dl;lpt.Qt.iQJ.L..tQ._ter:np.e.x:..~lt.uce __ Qf_rnusc.Le_c.Qntr.Qc_til(LPr.QP.e.I:.U~lS_ .. Cold-water fish exhibit many examples of resistance adaptations in proteins that are involved in the
contractile process. An increased susceptibility to heat denaturation has been reported in parvalbumins (tlamoir
&
Gerardin-othiers, 1979). myosin (Johnston et al. 1975;Persnowska
&
Smialowski, 1981), myofibrillar ATPase (Walesby&
Johnston, 1979) and whole muscle fibres(Johnston. 1987). Sensitivity to heat may be a consequence of alterations in molecular structure, in order to improve
low-temperature function. This section will briefly summarise capacity adaptations of the musculature of ectotherms (see Bennett. 1985; Johnston
&
Altringham,1988a; for reviews). Particular emphasis will be placed on
the
specialised contractile properties of skinned musclefibres from aritarctic notothenioids.
However, they do provide an indication of the capacity of
muscle systems to alter under environmental pressures.
Skinned muscle fibres from antarctic fish, when fully
activated, generate higher isometric tension (Po) at ~C
than similar fibres from temperate and tropical species at
their preferred body temperatures (Johnston
&
Brill, 1984;Johnston
&
Altringham, 1985;~Altringham&
Johnston, 1986).Below the normal physiological range of each species
tension generation is temperature dependent. At -5°C,
fibres from Notothenia neglecta developed 2.4x the tension
generated by the temperate Platichthys flesus and 14x that
of the tropical Oreochromis niloticus (Altringham
&
Johnston, 1986). Skinned (demembranated) fibres are
essentially a" system of isolated myofibri1s, with an energy
supply under the control of the experimenter. ATP
utilisation by fibres can be measured as an increase in the
total ADP content of the post-contraction activating
solution, by use of high performance liquid chromatography
(Altringham
&
Johnston, 1985). This provides an indicationof the • economy· (maximum isometric tension"divided by ATP
moles hydrolysed myosin head-1 S - I ) intrinsic to the force
generating system. At -5°C the relative cost of isometric
contraction is in the ratio 1 : 2 :10 in N. neglecta, P.
flesus and
o.
niloticus, respectively.Higher economy in the muscle fibres
of
antarcticfish
may be due to an increase in the force produced during the
cross-bridge cycle. This could be achieved by an increase
1986). An increase in time spent in the bound state would
raise the number of cross bridges attached at anyone time
and therefore the force. Alternatively, the bound time may
remain constant, instead more force could be generated by
each cross bridge (Altringham
&
Johnston, 1986).In contrast, the maximum cross bridge cycle times
during shortening do not appear to have compensated to
different temperatures. The~~'appears to be no correlation
between maximum isotonic contraction velocity and
environmental temperature, even between antarctic and
tropical species (Johnston
&
Brill, 1984; Johnston&
Altringham, 1985). An alteration of the proportion of time
in each state during the cross bridge cycle, may have
evolved to compensate for differences in the temperature
dependence of force generation, contraction velocity and
-economy of contraction- (Altringham
&
Johnston, 1986).The relationship between force and velocity, as
defined by the force-velocity (P-V) curve, affects maximum
mechanical output and the efficiency of work output
(Woledge, 1968). The curvature of the P-V relationship can
be defined by the constant -a- in Hill's hyperbolic (1938)
equation. Alternatively, the contractile properties of
certain live (electrically excitable) fibre preparations,
are better described by a hyperbolic-linear curve (Marsh
&
Bennett, 1986). From this equation the ratio ,Wmax/Vmax.Po,
where
Wmax is maximum power output; is inv~rsely related to~
the curvature of the P-V relationship. The less curvature
in the relationship, the higher the velocity and therefore
The shape of the force velocity curve is independent of temperature in the majority of live amphibian and
reptilian muscle preparations (Lannergren, 1978; Marsh
&
Bennett, 1985; John-Alder&
Bennett, 1987). For example, there is little variation in the power ratio used to describe the P-V relationship, in the fast glycolyticfibres of Dipsosaurus dorsalis at temperatures from 15-40o
e
(Marsh&
Bennett, 1985). The:e is limited evidence that the P-V relationship may alter between fish from differingenvironmental temperatures. In skinned muscle fibre preparations the degree of curvature of the P-V
relationship is higher in a tropical (MakBira nigricBns) than an antarctic species (Chaenocephalus BcerBtus)
(A1tringham
&
Johnston, 1985).However, more recent studies using live fibre preparations from fish, indicate that force-velocity relationships cannot be accurately defined from the
contractile properties of skinned fibres (Curtin
&
Wo1edge, 1989; Altringham&
Johnston, 1988a). Intraspecificvariation in the P-V relationship with temperature, has been demonstrated in live preparations from the temperate Myoxocephalus scorpius (Langfeld et al. 1989). The
curvature of the P-V relation decreases with a reduction in temperature from 80 C (Wmax/Vmax.Po - 0.126) to
l°e
(Wmax/Vmax.Po - 0.136) in M. scorpius. This change in
curvature between
BoC
andloC
represents an increase in
relative maximum power output by about
15%
(Langfeldet
81.
Evidence from both live and skinned fibre'
preparations, would therefore suggest that some capacity exists in fish to alter muscle power output by changing the curvature of the P-V relation. However, the greatest
contribution to increased power output at low temperatures is derived from capacity adaptations of maximum tension generation (Altringham
&
Johnston, 1985).EIDJ2rjlQn.i_c_d~_v_e lQOOlen.t_and-.llf.es.lY .. le~ntarcti~h... At a more integrated level, temperature has a
considerable influence on development, growth, metabolism and reproduction of fish. One measure of resistance
adaptations in an organism is it's capacity to reproduce (Prosser, 1987). This section details several specialised aspects of the reproductive strategy of notothenioid fish.
In the light of specialised lifestyle strategies, the
controversy'over the existence of metabolic cold adaptation
will be discussed.
The rate of embryonic development within and between fish species is closely correlated to environmental
temperature (Herzig
&
Winkler, 1986, Blaxter, 1988). Studies on ovary development in Notothenlaneglecta,suggest that oogenisis in notothenioids generally may take 2 years (Everson, 1970). Prolonged oogenisis is linked to
the production of large eggs and low fecundity in
comparison to temperate water fish (Fig. 2) (North & White,
1987).
The small eggs of many temperate marine specieslarvae hatch months after spawning and are large, although
not especially advanced (Fig. 2) (Twelves, 1970; Burchett,
1983; Efremenko, 1983; North
&
White, 1987). Initially, itwould appear that the particularly slow development of
notothenioids is a consequence of low environmental
temperature.
Alternatively, relatively low fecundity, large egg
size and slow development in antarctic species has been
attributed to the evolution of K-strategy lifestyles rather
than low temperatures (Clarke, 1980, 1983). The concept of
the r-K continuum describes strategies in terms of the
relative energetic investment in different phases of the ,
lifestyle (Pianka, 1970). In contrast to r-selected
species, K-selected species exhibit large size, delayed
development and reproduction, higher adult survival and
production of few young (Pianka, 1970). K-se1ected species
are normally evolved to exploit limited environmental
resource supplies.
The evolution of K-strategy lifestyles in antarctic
marine poiki10therms is thought to be linked to the marked
seasonality of primary production (Clarke, 1983, 1988). Of
the few studies of year round growth or condition index
carried out on antarctic fish, both N. rossii (Burchett,
1983) and N. neglecta (Everson, 1970) appear to restrict
growth to a few
summer months,
when
primary production isat a peak. It is argued (Clarke
1983)
thatan
importantconsequence of the evolution of k-strategies is that it
and low basal metabolic rates may be common amongst antarctic invertebrates, there is some controversy regarding the metabolism of polar fish.
Met_abQ_l..i_~Qls;L.A.d.ap_t.aiW.D .
The concept of metabolic cold adaptation implies that the resting metabolic rate of a polar fish would be higher than that of a warmer water fish acclimated to the same low temperature (Krogh, 1916). Early measurements of metabolic rate in polar fish advanced the theory of metabolic cold adaptation (Scholander, 1953; Wohlshlag, 1960, 1964).
The appreciation of the effects of stress, hypoxia and nutritional status have led to some doubt in early
measurements of elevated basal metabolic rate and therefore metabolic cold adaptation (Holeton, 1970; Clarke, 1980,
1983). In addition, difficulties arise in directly
comparing metabolic rates between temperate and antarctic species. Antarctic fish are highly stenothermic (Somero
&
DeVries, 1967) and eurythermal temperate fish cannot be acclimated to freezing temperatures. Therefore, comparison of metabolic rates requires extrapolation of values for temperate fish to antarctic temperatures.studies taking account of these problems have
demonstrated' large interspecific variations but continue to
indicate that some degree of
metabolic cold adaptationexists (He~ningsen
&
Douglas,1977;
Wellset a1, 1984;
rates) to those of mesopelagic fish caught off the coast of California at 50 C (Torres
&
Somero, 1988).There are several suggestions for the possible
functional significance of metabolic cold adaptation. The maintenance of high concentrations of antifreeze
glycoprotein may require elevated resting metabolic rates (Macdonald et a1. 1987). There is evidence that increased scope for activity is coupled to high resting metabolic rates in trout, Sa1mo gairdneri (Weiser, 1985). Elevated basal metabolic rates in antarctic fish may also permit higher scopes for activity. In addition, there are
suggestions that low temperatures affect the balance
between the passive diffusion of ions through transmembrane channels and the active transport of ions against
concentration gradients. Antarctic fish may require high resting metabolic rates to maintain the balance between ion
diffusion and active transport (Hochachka, 1988) •
.l ... 2..~-.AS.e.E.c..I.S ... _QLSC.AL.I.NGJN.J..lSILLQC.Of..DIlQN. ...
In addition to environmental temperature, growth in fish has a profound effect on the muscular system,· swinming performance and behaviour of fish (for reviews see Wardle, 1977; Webb, 1977; Weihs, 1977). In order to discuss the relationship between swimming performance and size and/or
temperature, a brief description of various relevant
Fish swim in a variety of modes, involving both the action of undulatory body waves and/or the use of median or paired fins. The propulsive movements of fish were first classified by Breder (1926) and have been recently reviewed by Webb (1975) and Blake (1983). Swimming modes involving the action of body waves range from anguilliform (as seen in eels) to thunniform (as,seen in scombroids).
Classification is dependant on the specific body wavelength and the proportion of the body that undulates. This study
is largely concerned with fish that swim in a
subcarangiform mode, with less than one and more than one half a wavelength on the body at anyone time.
Subcarangiform motion is typical of pelagic, fusiform teleosts such as salmonids, gadoids and cyprinids.
Common to many subcarangiform swimmers, especially at
low speeds (Brett ;
&
Sutherland, 1965; Webb, 1973; Videler,1981), is the use of labriform motion. Labriform motion is powered by oscillatory movements of the pectoral fins. The detailed kinematics and speeds at which labriform motion is employed differ between species; as described in the
angelfish, Pterophyl1um eimekei (Blake, 1980) and in the shiner seaperch, Cymatogaster BggregBtB (Webb, 1973).
Three levels of swimming have been extensively used in
the discussion of locomotion in fish (Brett, 1965; Webb,
velocity-time curves (fatigue curves) described for sockeye
salmon, Oncorhynchus nerka (Fig. 3) (Brett, 1964, 1965;
Brett
&
Glass, 1973). These activity levels are thought torepresent physiologically relevant speeds. Sustained motion
could be defined as swimming powered purely by aerobic
metabolism, prolonged activity by both aerobic and
anaerobic contributions and burst activity is powered
anaerobically (Blake, 1983). In practise, distinction
between activity levels is not clear and large variations
exist between the endurance of different species (Fig 4).
Interspecific variations between species. requires that in
order to simplify matters, sustained motion will be used to
describe all steady swimming speeds other than short
duration bursts.
S.CJ,tlW.9.-aD5Lf.iJ?lLtoo.rnbo 1 ogy •
Many morphological and physiological variables (y) can
be scaled relative to body size (X), according to
allometric equations of the general form
y - a·){b
logy - 10ga + b· logX
i.e. when the two variables are plotted on logarithmic
co-ordinates, the result is a straight line. Body weight
(Mb) is commonly employed as a measure of animal size in
scaling problems. Total body length
(L)
is more relevant tothe hydrodynamics of swimming and is therefore generally
used to discuss scaling and fish locomotion. The exponent·
describing a scaling relationship (for reviews see
Schmidt-Nielsen, 1984; McMahon, 1973).
Almost by definition growth of fish larvae is allometric. Highest growth rates occur in caudal and
rostral regions (Fulman, 1983). Fast growth in the caudal region increases the surface area available for propulsion and the amount of musculature. Beyond the larval stage, as fish grow morphometric parameters appear to scale
geometrically. For exnmple, the surface areas of sockeye salmon, (Oncorhynchus nerka) and rainbow trout (Salmo SBirdneri) , scale in proportion to LZ.14 and L Z . l l ,
respectively (Webb, 1977). Body weight in fish also scales geometrically with L3; a fact made use of by fisheries
biologists in the von Bertalannfy equation (Cushing, 1975).
~ .. i.zJ~.J!n.U_b.e_by.dJ.:Qd-xnruni cs
ouw.inmiruL.iIL.f.ish ....
Due to the difficulties involved in directly measuring fish swimming movements, dimensional and hydrodynamic
models have been widely used to estimate the effects'of size on performance (Wardle, 1977; Webb, 1977; Weihs, 1977; Blake, 1983).
To swim at a steady forward velocity a fish must produce thrust equal to the drag resistance. The drag
experienced by a swimming fish can be written as
drag -
%
0.S.U2.CD.K
(cos
¢)
direction of motion (Lighthi11, 1977; Webb, 1975; Johnsrude
&
Webb, 1985). The geometric scaling of surface area (S aLZ). has often led to the conclusion that drag is also proportional to LZ and that the drag coefficient is a constant. However, the drag coefficient alters with size and is proportional to Reynolds Number (Re). which is directly dependant on fish total length (L) and swimming speed (U)
Re - L.U/v
where v - kinematic viscosity (Webb. 1975).
Boundary layer flow characteristics are dependant on the Reynolds Number. When Reynolds Number is low, viscous forces dominate and flow is laminar. At high Reynolds Number, viscous forces become less important as pressure changes associated with inertial forces create turbulence.
Amongst fish. Reynolds Number can vary from in the region of 10-200 for larval fish (Blake, 1983) to >107 for
large, fast swimming scombroids (Magnuson, 1978). Changes in drag associated with increased Reynolds Numbers are thought to become critical at certain sizes and swimming speeds. For instance. using theoretical models Weihs (1980) has suggested that larval fish would alter their swimming style as they grow. In smaller larvae with lower Reynolds Numbers, it is more efficient to swim continuously due to the predominance of viscous forces. As size increases.
inertial effects become more important and intermittent
swimming, involving burst-coast type behaviour becomes more
from angui11iform to subcarangiform in herring larvae, is
po~sib1y associated with the change in drag components
(Batty, 1984).
Wardle (1977) has suggested that critical Reynolds
Numbers limit maximum sustained swimming speeds. The high
sustainable speeds observed in scombroids are due to their
streamlined shape, which maintains laminar flow at higher
speeds and higher Reynolds Numbers than on typical te1eosts
(Wardle, 1977).
~.c.D..l.ing. __ $.y..stai.na_l!l_e.~.w.iJIl)}ing_Wl.~JlnSRQ.r.L..c_QS ..
t.s ...
Critical levels of performance have often been used to
discuss scaling problems; as they are believed to represent
physiologically similar speeds for all sizes (Heglund et
al. 1974; Hegland et al. 1982; Brett, 1965; Brett
&
Glass,1973; Webb et al. 1984). For instance, Brett (1965) chose
the maximum swimming speed that could be sustained for 60
min (60.1DUcrlt), as a representative critical performance
level for sockeye salmon, Onchorhynchus nerka. Reduction of
length specific critical swimming speed is scaled to Lo .• a,
in
o.
nerka (Brett&
Glass, 1973). In addition, themetabolic scope for activity (oxygen consumption at
60.1DUcrlt-standard oxygen consumption) alters with length
to the factor L3.02 (Brett
&
Glass, 1973). If the rate ofoxygen consumption is divided by swimming speed the
metabolic cost of transport can be estimated
(Schm!dt-Nielsen, 1984). The cost of swimnins for
o.
narka, at 3/460.1nUcrlt is proportional to Mb-O.2B, suggesting that the
cost of transport per 19 is cheaper in larger fish (Schmidt-Nielsen, 1984).
An alternative estimate of the cost of transport involves both hydrodynamic models and measurements of
metabolism (Webb. 1977). The ratio of thrust power output, estimated from detailed kinematics and hydrodynamic models (Lighthill, 1970) and aerobic power output, estimated from metabolic scope, gives an indication of aerobic efficiency
(Webb et al. 1984). Aerobic efficiency in S. 8airdneri, increases with length (Webb et al. 1984). In contrast, Froude efficiency (or the propeller efficiency), the ratio of thrust power to the mean rate of working, is independent of size. The increase in aerobic efficiency with length, whilst Froude efficiency remains scale independent,
suggests an increase in muscle efficiency with size in fish (Webb et al. 1984).
Muscular efficiency in terrestrial locomotion has also been demonstrated to increase with size (Heglund et al. 1982). Slower stride frequency at critical reference
speeds, decreases the cross-bridge cycling rate for larger animals, possibly allowing greater efficiency (Heglund et
al. 1982). Smaller animals move proportionally faster at critical speeds, requiring faster frequency strides and therefore may have to recruit faster, less efficient muscle
fibre types. A higher
proportion of fastfibres have been
found in the muscles of smaller birds and mammals (Close. 1972).
smaller fish (Greer-Walker, 1970; Greer-Walker
&
Pull, 1975; Johnston&
Camm, 1986; Dunn et a1. 1989). Variations in swimming behaviour and activity alter fibre typeproportions, possibly masking any scaling effect. However, analysis of the myofibrillar ATPase activity of fast muscle samples from a number of marine teleosts, showed a decline with length (Witthames
&
Greer-Walker, 1982). This would suggests that muscle fibres in smaller fish are faster, due to the relationship between myosin ATPase and maximum speed of contraction of muscle (Barany, 1967).M&~JmunLs\1!.i.{IIl)lng_p(;tr.i.QJ:.maok.e_ao<Lfti.z!h
Reported burst swimming speeds range from 6 cms-1 in larvae of Engraulis mordax (Webb
&
Corolla, 1981), to 2134 cms-1 in Acanthocybium solandri (Walters&
Fierstein,1964). However, the lack of a conceptual framework"and
technical difficulties involved in measuring maximum
performance, result in a limited amount of comparable data. In consequence, attempts have been made to estimate burst swimming speeds from theoretical models (Bainbridge, 1961; Wardle,. 1977) and from muscle preparations (Wardle, 1975; Brill, 1978; Johnsrude
&
Webb, 1985; McVean&
Montgomery, 1985; Webb&
Johnsrude, 1988).Slower twitch contraction times of isolated muscle
blocks in larger fish, suggest decreased tail-beat
frequency and maximum length specific speed with size
chapters.--Difficulties arise in part, because of the complex fibre geometry within myotomes (Alexander, 1969; Wainwright, 1983) .
Wardle
&
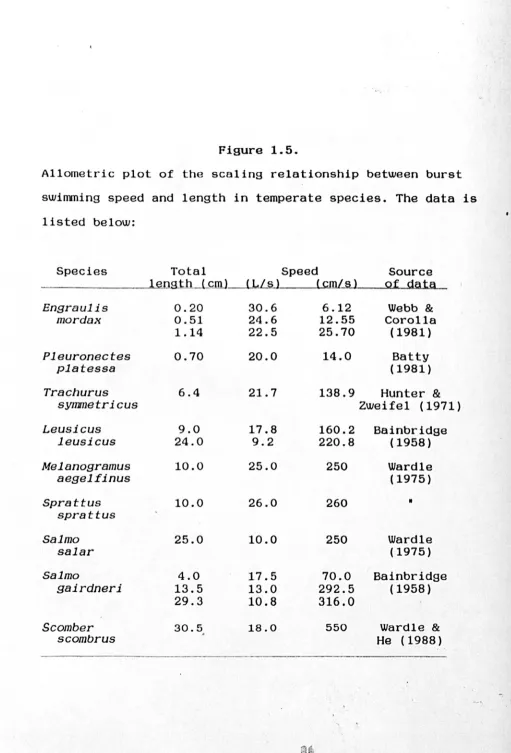
He (1988) have pooled data on swimmingperformance of many species from the literature. They have shown maximum burst swimming speeds to be proportional to
Lo.ao. When only temperate species are included, and data is restricted to measurements that are acceptable estimates of maximum speeds; maximum swimming speed is proportional to Lo.alS (Fig 5).
Escape reactions have been studied in detail in
different sized S. gairdneri (Webb, 1984). The duration of the three stages that make up the fast-start reaction,
I increased with length of fish. In contrast, actual
acceleration rates, velocity attained and distance covered in a given time, were length independent. The independence of acceleration on size, suggests that the outcome of
predator-prey interactions would be determined primarily on
Figure 1.1.
Diagram of the possible patterns of compensation via
capacity adaptation, of a biological rate process. Derived
from Pretch (1958).
1. Over compensation. 2. Complete compensation.
3. Partial compensation.
4. No compensation, a Ql0 effect.
[image:38.530.20.525.49.790.2]1
2
3
4
5
RATE PROCESS
Antarctic Temperate
Figure 1.2.
Graph illustrating the range of egg diameter and larval
length in temperate (solid lines) and antarctic (dashed
lines) marine teleosts.
Temperate species: 1. Engraulis mordax; 2.
Scopthalamus maximus; 3. Gadus morhua; 4. Scomber scombrus;
5. Clupea harengus; 6. Pleuronectes platessa; 7.
Hippoglosus hippoglossus (for original data see Blaxter
1988).
Antarctic species: 1. NototheniB nudifrons;
2. HBrpagifer bispinis; 3. Notothenia neglecta;
4. Pagothenia hansoni; 5. Parachaenichthys georgianus;
6. Pseudochaenichthys georgianus; 7. Chaenocephalus
aceratus; 8. Notothenia rossii (for original data see North
[image:40.532.33.527.35.769.2]Larval length (mm).
20
15
8
10
5/ / / " "1 .... ,,. 2 , / '
/
/
//
~
75
~
1 ~ 3
2
04---~---~---~---~---~
o
1 2 3 4 5Figure 1.3.
Fatigue time curves for juvenile sockeye salmon
(Oncorhynchus nerka) and rainbow trout (Salmo yairdneri) as
1000 Time to fatigue (min).
I
Sustained activity100
\
Oncorhynchus nerka10
Prolonged activity
1
0.1 Sa/mo gairdneri
0.01 ~---'---'---r---~---,
o
24
6
8 10Figure 1.4.
Critical swimming speeds of various species of fish 'of
20-30cm in length. Source of data: Oncorhynchus nerka (Brett,
1964); Lepomis gibbosus (Brett
&
Sutherland, 1969);Cymatogas'ter aggregata (Webb, 1973); Pleuronectes platessa
(Priede
&
Holliday, 1980); Acipenser fulvescens (Webb,1986); Clupea harengus, Gadus virens, Scomber scombrus (He
&
Wardle, 1988); • Pagothenia borchgrevinki (antarcticnotothenioid, sWimming at O~C) (Forster et al. 1987).
~ . .:.
Fatigue time (min). 1000
G. v. S.s. o.n. C.h.
100
10
P.p. P.b.
+
•
A.f.+
1 +---~---.---~---.---~---~
o
1 2 3 4Velocity (LIs).
Figure 1.5.
Allometric plot of the scaling relationship between burst swimming speed and length in temperate species. The data is
listed below:
Species Total Speed Source
lsmst . .D._LcIJlJ-LL / s ) (cmL~ Qf g.ai~ ,
_
..._
-
_
.. _--Engraulis 0.20 30.6 6.12 Webb &
mordax 0.51 24.6 12.55 Corolla
1.14 22.5 25.70 (1981)
Pleuronectes 0.70 20.0 14.0 Batty
platessa (1981)
Trachurus 6.4 21.7 138.9 Hunter &
symmetricus Zweifel (1971)
Leusicus 9.0 17.8 160.2 Bainbridge
leusicus 24.0 9.2 220.8 (1958)
Melanogramus 10.0 25.0 250 Wardle
aegelfinus (1975)
Sprattus 10.0 26.0 260
•
sprattus
Salmo 25.0 10.0 250 Wardle
salar (1975)
Salmo 4.0 17.5 70.0 Bainbridge
gairdneri 13.5 13.0 292.5 (1958)
29.3 10.8 316.0
Scomber 30.5 18.0 550 Wardle &
scombrus , He (1988)
[image:46.538.22.533.31.784.2]Velocity (cm/s).
1000
100
10
1 10
Length (mm).
o
o
r§J0.85
Y = 3.37 X
2
(r = 0.96)
_IrrrSQOOc.I.I.QN. ..• _
In the segmental muscles of fish two fibre types are
commonly distinguished. Red fibres with an oxidative
metabolism occur in the periphery, whilst the bulk of the myotome consists of white fibres with a glycolytic type of metabolism (Johnston et a1. 1977; Newsholme et a1. 1978; Zammit
& Newsholme,
1979; Johnston& Moon,
1981; Johnston,1981). In contrast to white fibres, red fibres are
generally small in diameter, well vascularised and contain
large numbers of mitochondria (Johnston, 1981). Detailed ultrastructural studies reveal differences in the extent of
contact between the T-system and the sarcoplasmic reticulum
(SR) in red and white fibres (Akster et 81 1985). This variation in T-system/SR contact has been correlated with
measured differences in tension development between fibre
types (Akster et a1. 1985)
Myofibrillar adenosine triphoshatase activities
parallel the speed of contraction of muscle fibres (B~rany,
1967). Histochemical studies have shown that white and red fibres correspond to fast and slow types, respectively
(Johnston et 81. 1974). In addition, the contractile
properties of slow twitch and fast twitch myotomal fibres
have been confirmed by both skinned (Altringham
& Johnston,
1982) and live (Curtin
& Woledge,
1987; Altringham&
Johnston, 1988a) isolated fibre preparations.The composition of fish
myotomes is seldom limited to
enzymes and an aerobic capacity and myofibrillar ATPase
activity that is intermediate between slow and -fast types
(Johnston et al. 1974; Kryvi et al. 1981). In the dogfish
Scylorhinus canicula, a superficial layer of myotomal
fibres, which stain weakly for myofibrillar ATPase (Bone
&
Chubb, 1978), appear to have tonic contractile properties
(Bone et al. 1986). Although their contractile properties
have not been studied, similar fibers have been observed In
I I
several teleosts (Davison, 1983; Kilarski
&
Koslowska,1983; te Kronnie et al. 1983).
The role of fast and slow myotomal fibres varies
between species. Electromyographica1 studies demonstrate
that in Scylorhinus canicula (Bone, 1966), Clupea harengus
(Bone et al. 1978), Morone saxatilis (Sisson
&
Sidell,1987) and Katsuwonus pelamis (Rayner
&
Keenan, 1967) only slow fibres are employed at sustainable swimming speeds. Inother teleosts studied, fast fibre recruitment occurs at
lower than maximum sustainable speeds (Hudson, 1973;
Johnston et al. 1977; Bone et al. 1978, Rome et al. 1984).
The correlation between contractile properties of fast and
slow fibre types and their function at different SWimming
speeds, is discussed by Rome et al. (1988). The role of
intermediate fibres has only been studied in Cyprinus
carpio; the order of recruitment with increasing swinming
speeds is slow> intermediate> fast (Johnston et al.
1977) .
Information on swimming muscles in notothenioid fish
is biased towards the adult stages of inshore demersal and
Kilarski, 1981; Davison
&
Macdonald, 1985; Dunn&
Johnston,1986; Harrison et a1. 1987; Johnston
&
Camm, 1987). In bothcases there is a distinct division between sustainable and
burst swimming speeds reflecting the recruitment of
pectoral fin and myotomal muscle respectively (Montgomery
&
Macdonald, 1984; Davison et a1. 1988; Archer
&
Johnston,1989). The well developed pectoral fin muscles are
predominantly composed of slow twitch fibres, containing
numerous mitochondria (Johnston
&
Harrison, 1985; Harrisonet a1. 1987; Johnston 1987). The myotoma1 muscles on the
other hand are specialised for sprinting and are almost
exclusively very large diameter fast twitch fibres, which
rely on phosphocreatine (PCr) hydrolysis as an anaerobic
energy supply pathway, limiting burst endurance (Dunn
&
Johnston, 1986). Sustained swimming speeds using the
pectoral fins are relatively modest, s2 bodylengths/s
(Montgomery
&
Macdonald, 1984; Forster et a1. 1988; Archer&
Johnston, 1989). Measurements of active metabolismsuggest an aerobic scope of only 4-6 compared to 10-12 for
athletic species such as trout or salmon (Bennett, 1978;
Forster et a1. 1988, Davison et a1. 1988).
These studies have now been extended to a range of
demersal-pelagic and pelagic fish, showing a wider range of
activity patterns. All the species studied were collected
during OBP Cruise 7 of the British Antarctic Survey to
South Georgia during austral summer 1986-1987. Part icular
emphasis was given to the poorly studied post-larval stages
Sampling was carried out from the RRS John Biscoe II
in the waters east of South Georgia (approximately 540 S,
360 151 W) and within Cumberland East Bay.
Post-larval specimens were captured near the surface
or in midwater using 1m2 or Sm2 rectangular midwater
trawls . Demersal and demersal-pelagic species were caught
at or near the bottom using an Agassis trawl.
Post-larval specimens sampled and their standard lengths
(S.L.) included:
Artedidraco mirus L6nnberg (19-22mm S.L.),
Chamsocephalus gunnari L6nnberg (27-51mm S.L.),
Notothenia gibberifrons Boulenger (23-25mm S.L.),
Pagothenia (=Trematomus) hansoni (Boulenger)
(30-35mm S.L.)
Pseudochaenichthys geOrgianus Norman (29-6Smm S.L.).
Adult and juvenile fish sampled included:
Artedidraco mirus L6nnberrg (73-S2mm S.L.),
Chamsocephalus gunnari L6nnberg (250-270mm S.L.),
Notothenia gibbe~ifrons Boulenger (250-400mm S.L.),
Pagothenia (=Trematomus) hansoni Boulenger
(344-376mm S.L.),
Pseudochaenichthys georgianus Norman (2S0-547mm
S. L. ) ,
T.i.s.s.y.e. .. _ .. samp..l.lns_.an~L.p-Le.p.$.lu;tt_iQ.r.h
Whole cross-sections of post-larvae were cut from a
point immediately posterior to the anus. Samples of
myotomal muscle from adults were dissected from a position
approximately 2/3rd of the distance along the trunk
(measured from the operculum). The pectoral fin adductor
profundis muscle (m.ad.p) of .adult fish was removed whole.
Muscle blocks were mounted 'on cryostat chucks in an
artificial embedding medium (OCT compound. Lab-Tek Products
INC. t USA). Tissue was rapidly frozen in 2-methylbutane
cooled to near its freezing point (-16~C) by immersion in
liquid nitrogen. Serial frozen sections were cut on a
cryostat at -20oC and mounted on dry coverslips.
Hlsl.o.c.b.e.mi_s_trY_
,-.s..w;;'.G.inic.._JJe.JJYJ;lCQge.JV;t$J~ ... _LSDJ::l~;t~HtL.f_ Se c t ion s we res t a i ned for
SDHase activity in a medium containing: sodium succinate,
80mM; phosphate buffer, 50mM; pH 7.4 (at 4oC), to which
nitroblue tetrazoliwn was added to a concentration of
1mg/ml just prior to use (Nachlas et 81. 1957).
~=_G.ly_c._e..CQp.hQ.$.p_h.a.t.e ___ . .d.eruLd.t:Q.s.ena.s.SL1.~.=_G..P-.D.l:la_s_e .. L.. Se c t ion s we r e incubated in the medium containing: D.L.
~-glycerophosphate, 13.9 mM; Tris-HCl, 50mM; pH 7.6 (at
4o C) to which nitrob!ue tetrazolium was added to a
concentration of lmg/m! just prior to use (Wattenberg and
Leong. 1960). (Incubation times in excess of 3 hours were
required to develop significant staining for both SDHase
G..l.Y.G . .Q.8.~.n..!.. Sections were incubated for 20mins in 1% periodic
acid and stained with Schiffs reagent (PAS reaction).
L.i.p. .. i .. cL .. Staining was carried out using a Sudan Black B
saturated solution in propyleneglycol for 30mins. Control
sections were rinsed in acetone prior to staining.
M~LQ.:f.iJ:u:j._1.1.Q.r_(';LcLe.no ~tiJle.j_d..P.h.Q.s.p.b.a.t.!;Ule_lA.T.E.a.s.e..L. Se c t ions
were stained with or without. preincubation at acid
(1-10mins; pH 4.8 at 4o C) or alkaline pH's (0.5-1min; pH 10.4
at 4oC) using the buffers and methods described by Johnston
etal. (1974).
P..~.t..~.r.:mi. .. ml:t.i. .. Q.n._ . .Q .. f_p.r_QPQctj.Q.u_o.Ld..i.f..f.e.r.JillLmu.S.cl1L...f.i.b..nl
.t.YP.~.$ ..•..
The proportion of different muscle fibre types was
determined from whole frozen cross-sections of post-larvae.
For adult stages, frozen tissue was sectioned into steaks
2mm thick and stained for succinate dehydrogenase activity
at 4o C. In both cases, the relative proportions of fibre
types was determined using a camera lucida and digital
planimetry.
M~.~.$.u.r.~me.n.t .. _ . .Q..f. ... mQS.C . .lJL .. f. .. LbI:..e_(ti_~_t.e.I:.. .•.
Stained sections were used to identify fibre types.
Once identified, fibres were drawn using the drawing arm of
a microscope (Labophoto, Nikon, Japan) and their
cross-sectional areas measured using a digital planimeter
interfaced to a microcomputer (Hewlett Packard 86B). Muscle
fibre diameters are derived from the diameters of a circle
each fibre type for each fish examined. In some cases fewer
than 50 oxidative or small diameter fibres were present in
each section, if so all fibres present were counted.
!1~;t~taLQf_~.n.~ymg_a.c..tJ'y~JL_
Muscle was dissected in the cold from freshly caught
Notothenia gibberifrons and ~omogenised immediately. Fast
muscle was dissected from approximately one third of the
distance along the trunk, measuring from the operculum.
Care was taken to ensure that the sample was deep enough to
remove all traces of slow fibres. The m.ad.p. was removed
intact and the deeper more pigmented layers were removed
and stored on ice.
Tissues were minced with a scalpel, and homogenised in
approximately 5 vols. of ice-cold buffer using a hand held
sintered glass homogeniser. Homogenates were filtered
through glass wool prior to assay of enzyme activities. The
extraction buffer had the following composition: Tris HCL,
50rnM; EDTA, 5mM; MgCh, 2rnM; dithiothreitol, 1mM; pH 7.5.
All enzymes were assayed spectrophotometrically at 2-3°C
using a thermostat controlled cell holder. Substrate
concentrations, co-factor concentrations and pH were set to
yield optimal activities. The solutions and methods
described in Dunn
&
Johnston (1986), were used to measurethe following enzymes; adenylate kinase, creatine
phosphokinase, pyruvate kinase, lactate dehydrogenase and
malate dehydrogenase. The optimal pH for each enzyme was
Accurate tissue weights could not be obtained aboard
ship. Approximate weights were obtained using a spring
balance in order to standardise the dilutions. After
homogenisation, 3ml aliquots of homogenate were removed,
frozen (at -60oC) and returned to st. Andrews for
subsequent analysis. The dry weight of tissue in 3ml of
aliquot (the sample dilution factor) was obtained by
subtracting the vial weight. -Samples of rapidly frozen
tissue were returned in liquid nitrogen and used for wet
weight/dry weight analysis. This conversion factor was used
to obtain enzyme activities expressed in terms of ~oles
substrate utilised per g wet weight mi~l .
M.y_~tc._l_~L __ hiJ;ttQG_be.mi._~_.t.XJ'-~_
Although a wide range of preincubation and incubation
times were attempted, i t was not possible to identify
different fibre types on the basis of their staining for
myofibrillar ATPase activity. This confirms the findings
reported for other antarctic fish species (Davison
&
Macdonald, 1985; Harrison et al. 1987). Instead slow fibres
were identified on the basis of their intense staining
reaction for SDHase and a-GPDHase (Fig. 5-13). Fast muscle
fibres generally had larger diameters and stained more
weakly for SDHase,
a-GPDHase, PAS and Sudan Black B
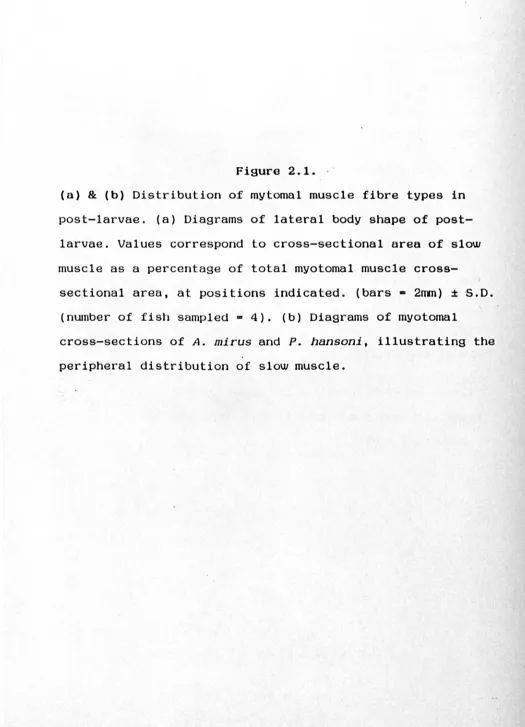
.P..Q$..t=l~.ry'Jt~L. ..
The distribution of muscle fibre types in the
myotomes of post-larvae were similar in all the species
examined (Fig. 1). Slow fibres form a superficial layer one
fibre or two fibres thick (A. mirus) , around the entire
lateral surface of the trunk. A thicker layer of slow
fibres occurs at the level of the lateral line nerve and at
the major horizontal septa (Figs. 5
&
6). The remainder ofthe myotomal muscle is composed of fibres that stain weakly
for SDHase, a-GPDHase, PAS and Sudan Black B. These fibres
are highly variable in diameter and in all the species
examined, the fibres bordering the myosepta stain somewhat
more darkly for SDHase and a-GPDHase than does the bulk of
the myotoma1 muscle. A population of very weakly staining
fibres were found peripheral to the slow muscle at the
lateral line (Figs. 1, 5
&
6).A.d.J.t1.t __ JitJ~gf;U;t .•..
The distribution of fast and slow muscles in the
myotomes of adult stages is shown in Fig. 2. There is
greater interspecific variation in the relative proportion
of fibre types than in the post-larval stages. The
proportion of slow muscle ranges, in posterior segments,
from 6%-9% in C. gunnari to 11%-22% in P. breviceps.
The pectoral fin adductor muscle of adult stages is
largely composed of highly aerobic slow muscle fibres which
stain intensely for SDHase, a-GPDHase and lipid (Figs.
aerobic fibres in all the species examined. Much larger
fibres are found in the deep part of the muscle and these
probably correspond to the fast fibre types identified in the myotomes (Harrison et al. 1987). Generally the slow pectoral fibres stained more darkly for SDHase, a-GPDHase and Sudan Black B (lipid) than do slow fibres in the
myotomes (Figs. 7, 8
&
10). Staining for glycogen (PAS) was more variable; highest intensity staining for PAS wasobserved in the slow myotomal muscle of P. brevlceps (Fig.
9) and in the pectoral muscle of P. hansonl. Weak PAS reactions occurred in the slow muscle of the two
haemoglobinless species, P. georgianus and C. gunnBri.
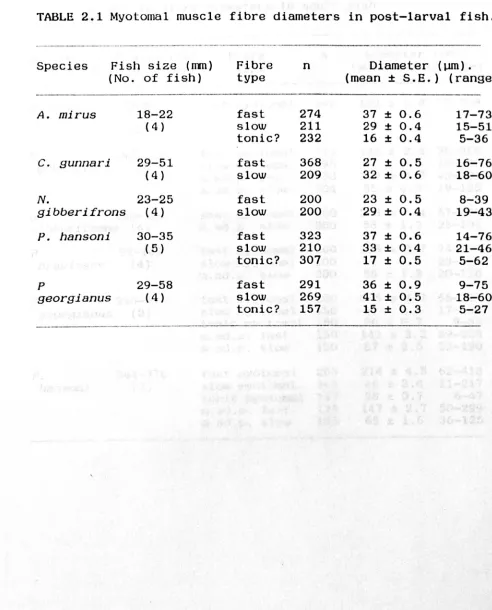
MY.~G..1..!t .. _.f..1Q.r.:~._ .. JU .. ~.t~s_~-,,_
The mean values and ranges of fibre diameters at
post-larval and adult stages are shown in Tables 1 and 2
respectively. Frequencies of distribution of fibre size are
shown in Figs. 3 and 4.
The mean diameter of the fibre types show no
consistent differences in post-larval stages, in fact fast
fibres have smaller mean diameters than slow fibres in C.
gunnari, N. gibberifrons and P. georgianus. This contrasts with the situation in adults in which the diameter of fast
fibres is substantially greater than that for slow fibres.
The mean diameters of fast muscle fibres in the