1
Alien honeybees increase pollination risks for
range-1
restricted plants
2Running heading: Range size and pollinator specialisation
3Olivia Norfolk*
a, Francis Gilbert
b, Markus P. Eichhorn
b 4a
Department of Biology, Anglia Ruskin University, Cambridge Campus, East Road,
5Cambridge, CB1 1PT, United Kingdom
6b
School of Life Sciences, University of Nottingham, University Park, Nottingham
7NG7 2RD, United Kingdom
8*Corresponding author: Olivia Norfolk, Department of Biology, Anglia Ruskin
9University, Cambridge Campus, East Road, Cambridge, CB1 1PT, United Kingdom
10olivia_norfolk@hotmail.com
1112
13
14
15
ACKNOWLEDGEMENTS
16This work was funded by The Leverhulme Trust. We would like to thank the Egyptian 17
Environmental Affairs Agency for permission to work in the Park; our local guide N. Mansour 18
for assistance in the field; and our team of taxonomists who kindly donated their time and 19
expertise, C. O’Toole (Apidae), M. Kuhlmann and H. Dathe (Colletidae), A. Pauly 20
2
ABSTRACT
1
Aim 2
Range-restricted species are of high conservation concern and the way in which they 3
interact with more widespread species has implications for their persistence. Here we 4
determine how the specialisation of mutualistic interactions varies with respect to the 5
geographic range size of plants and pollinators and assess how they respond to the 6
introduction of the alien honeybee. We also compare network characteristics (connectance, 7
specialisation, nestedness) between an invaded low mountain and non-invaded high 8
mountain network. 9
Location 10
St Katherine Protectorate, South Sinai, Egypt. 11
Methods 12
We quantified bee-plant interactions in 42 plots between April-July 2013 and created 13
visitation networks for the low mountains (beehives present) and the high mountains 14
(beehives absent). We then compared visitation network metrics between range-restricted, 15
regionally-distributed and widespread plants and pollinators and assessed topological 16
differences between the low and high mountain networks. 17
Results 18
Range-restricted bees were involved in a significantly higher number of total interactions 19
than regional and widespread native bees, but showed no evidence of increased 20
generalisation. In contrast, range-restricted plants were involved in fewer interactions and 21
exhibited significantly higher specialisation and a high dependency on range-restricted 22
pollinators. The introduced honeybee acted as a super-generalist and was associated with 23
3 levels of resource overlap with range-restricted bees and made few visits to range-restricted 1
plant species. 2
Main conclusions 3
Range-restricted plants are more specialised in their interactions than range-restricted 4
pollinators, suggesting that the forces shaping the structure of interaction network can vary 5
between partners. Alien honeybees made few visits to range-restricted plants, but exhibited 6
disproportionately high levels of floral competition with range-restricted bees. If high levels of 7
competition lead to population declines then specialised range-restricted plants will be at 8
higher risk of pollen deficits than more widespread species. 9
Key words: pollination; mutualism; endemism; range size; honeybee; invasive 10
11
1. INTRODUCTION
12Endemic species are highly valued from a conservation perspective, but their restricted 13
distributions leave them particularly threatened by habitat destruction and vulnerable to 14
extinction (Dirzo and Raven 2003). Previous studies have established which habitat 15
characteristics are associated with endemism (Boulangeat et al. 2012; Markham 2014), 16
quantified genetic differences between endemic and non-endemic species (Cole 2003) and 17
demonstrated that endemic species exhibit distinct ecological traits (Kunin and Gaston 18
1997). There have been fewer studies investigating the functional consequences of 19
endemism (Gorman et al. 2014; Lavergne et al. 2004) and less is known about how 20
ecological interactions differ between range-restricted and widespread species. Since the 21
preservation of mutualistic interactions is essential for the long-term persistence of both plant 22
and animal communities (Bascompte and Jordano 2007; Kearns et al. 1998; Memmott et al. 23
2004), it is useful to consider the manner in which range-restricted species interact with their 24
4 Recent studies addressing geographical range in the context of plant-pollinator 1
interactions have tended to focus on the impacts that exotic plant species have on visitation 2
networks outside their native range. Exotic plants easily integrate into novel visitation 3
networks and tend to form species-hubs, interacting with a higher abundance and diversity 4
of pollinators than native plants (Bartomeus et al. 2008; Vilà et al. 2009, Russo et al. 2014, 5
Stouffer et al. 2014). Network roles vary consistently between plant species across both their 6
native and alien ranges (Emer et al. 2016), suggesting that the tendency to be a generalist 7
or specialist is intrinsic to each species. Though super-generalism has been established as a 8
trait associated with range expansion in exotic plants, it has not been established whether 9
network roles vary consistently been native plants of varying geographic extents. 10
The invasion of pollination networks has also been well studied in oceanic islands 11
where species are easily categorised as endemic, non-endemic native or introduced. In 12
these systems, endemic plants and pollinators consistently exhibit higher levels of 13
generalisation than non-endemic and introduced species, with endemic super-generalists 14
incorporating new invaders into their pollination niche (Olesen et al. 2002; Travaset et al. 15
2013). This phenomenon of island super-generalists is thought to be a consequence of the 16
lower species densities on islands, which allows ecological release and an expansion of 17
endemic niche breadth (Olesen et al. 2002). Less is known about how range size influences 18
plant-pollinator dynamics in mainland systems, but comparative studies have found that 19
range-restricted species of both Astralagus and Ipomoea receive lower levels of visitation 20
than those with wider ranges (Karon 1987; Astegiano et al. 2010), suggesting that wide-21
ranging plants are more able to attract pollinators. Being able to interact with a range of 22
partners has clear advantages in terms of range expansion, so in mainland systems we may 23
expect widespread species to have higher generalisation than range-restricted species. 24
We investigated how geographic range size influences the network dynamics of a 25
mountain visitation network in South Sinai, Egypt. Like islands, mountain ecosystems are 26
5 richness at high altitudes (McCain and Grytnes 2010). Mountains generally have low rates of 1
ecological invasion, but invasion rates are increasing in response to climate change 2
(Pauchard et al. 2009; McDougall et al. 2011), leading to growing concerns about future 3
impacts of invasive species on isolated mountain ecosystems (Kueffer et al. 2014). Our 4
study site is characterised by high levels of endemism with over half of Egypt’s endemic flora 5
restricted to the mountains of South Sinai (Ayyad et al. 2000; Moustafa et al. 2001). 6
Honeybees (Apis mellifera) were introduced to the region approximately 20 years ago, and 7
are now widely managed in the town and lower mountains, but hives are absent in the less 8
accessible high mountains. Initial research in the region suggests that honeybees can 9
displace native bees from shared floral resources (Semida and El Banna 2006), but it is not 10
clear how their introduction has affected visitation network structure. 11
Here we characterise the bee-plant interactions within the low and high mountains of 12
St Katherine in order to address whether species-roles vary consistently in accordance to 13
the geographic range size of plants and pollinators. Specifically we assess (a) whether there 14
is evidence of super-generalism in range-restricted species (akin to the island phenomenon) 15
or (b) whether range-restricted species exhibit higher specialisation than their widespread 16
counterparts. We also investigate the network role of the introduced honeybee and compare 17
network topology (connectance, nestedness and specialisation) between the low mountain 18
and the high mountain networks. The study provides insight into how mountain visitation 19
networks respond to introduced species, and the relative vulnerability of range-restricted 20
species in comparison to those with wider ranges. 21
2. METHODS
222.1 Study Site 23
The St Katherine Protectorate (28°33′N, 33°56′E) encompasses the South Sinai massif, an 24
isolated mountain range where altitudes range from 1200--2624 m. The region is hyper-arid 25
6 of 36°C (August) to an average monthly minimum of -7°C (February; Grainger and Gilbert 1
2008). The Sinai Peninsula forms a land-bridge between Africa and Asia and as such the 2
region supports a mixture of plants with distributions extending into North Africa, the 3
Mediterranean and Asia (Grainger and Gilbert 2008). The mountain range has been 4
recognised as a centre of Middle Eastern plant diversity, with over half of Egypt’s endemic 5
flora occurring within the St Katherine Protectorate (35 species; Avyad et al., 1999, Moustafa 6
et al., 2001). The region is also extremely important for insect life with over two-thirds of 7
Egyptian butterflies occurring in the Protectorate, including two endemics (Larsen, 1990) and 8
high levels of endemism documented within the Bombylidae (El-Hawagry and Gilbert 2014) 9
and the Apoidea (Norfolk et al, 2017). 10
The mountains are characterised by the presence of distinctive Bedouin orchard 11
gardens which line the bases of the valleys and have been shown to act as hotspots for 12
pollinators in the region (Norfolk et al. 2014). These agricultural gardens form the basis of 13
traditional Bedouin livelihoods, but recently managed honeybee hives have been introduced 14
in order to supplement Bedouin income. Hives are now common in the low mountains near 15
to human settlements, but remain absent in the high mountains. The high mountains have a 16
cooler and wetter climate associated with high natural floral diversity, but their accessibility 17
means that hives are yet to be introduced at high altitudes (Norfolk et al. 2014). Here we 18
quantify the visitation networks both in the low mountains where hives are present, and in 19
the less accessible high mountains where hives remain absent. 20
2.2 Plant-pollinator surveys 21
Plant-pollinator interactions were surveyed in total of 42 plots between April and July 2013. 22
The total survey area spanned an area of 25 km2 with half of the plots in the low mountains
23
(1300–1550 m a.s.l.) in St Katherine Town and Wadi Itlah (12 in gardens, 9 in natural 24
habitat) and half in the high mountains (1800–1850 m a.s.l) in Wadi Gebel and Wadi Tinya 25
7 orchard gardens was constant between the high and low mountain sites (7 gardens/ km2)
1
but external conditions did vary, with low mountains experiencing higher levels of 2
urbanisation and associated disturbance. For each plot, five 10 x 10-m quadrats were 3
measured out for repeated surveys (one per month) across the four-month field season, 4
giving a total survey area of 1050 m2 in the low mountains and high mountains respectively.
5
Surveys were carried out during sunny, non-windy days between 9 am and 4 pm. A 6
single collector walked at a steady pace around each 10 x 10-m quadrat, searching each 7
flowering plant in turn and recording all bees observed feeding on a flower. If there were no 8
bees visiting flowers, the surveyor moved on to the next plant. All observed bees were net-9
collected directly from the plants, apart from honeybees which could confidently be identified 10
in the field. A visit was determined if contact with the stamen or stigma of a flower was 11
observed; resting upon the petal was not sufficient. The identity of each visited plant species 12
was also recorded in order to establish the plant-pollinator interaction. When multiple bees 13
were observed simultaneously on one plant, no more than five minutes (excluding handling 14
time) was spent catching bees from that particular plant. 15
Plants were identified in the field where possible, or collected for identification using 16
Boulos (2002). Floral trait data were collated for each plant species based on measurements 17
taken in the field (average from 3 specimens). These included Corolla depth (mm), Floral 18
radius (mm), Symmetry (actinomorphic or zygomorphic) and Shape (Bilabiate, Campanulate, 19
Carinate, Connate, Cruciform, Ligulate, Papilionaceous, Rotate, Salverform, Tubular). All 20
captured insects were pinned and identified to species level by taxonomists (see 21
Acknowledgements). 22
The global distribution of each bee species was assessed using the Atlas 23
Hymenoptera database (Rasmont et al. 2016) and the Discover Life database (Schuh et al. 24
2010). Plant distributions were assessed using Boulos (2002) and the Euro+Med PlantBase 25
8 only from the Middle East, 2) Regional: also known from Northern Africa or the
1
Mediterranean, 3) Widespread: known from other areas (Europe, Africa and Asia). We did 2
not distinguish between naturally occurring and historically introduced plant species, so crop 3
species such as Allium, Curcubita, Eruca, Solanum, Nicotiana were classified as 4
widespread. 5
2.3 Network analysis 6
We pooled data from the repeated surveys to build three quantitative plant-pollinator 7
interaction matrices, for the low and high mountains and a combined network of all sampled 8
plots. Network topology descriptors were calculated using R package bipartite (Dormann et 9
al. 2009). We calculated three species-level metrics: (1) Interaction number (I), the number 10
of interactions each species has within the network; (2) Linkage level (L), the number of 11
partner species (links) for each species within the network; (3) Species specialisation (d’), 12
measures how strongly a species deviates from a random sampling of interacting partners, 13
ranging from 0 (no specialisation) to 1 (perfect specialisation) (Blüthgen et al, 2006). And 14
four network-level metrics: (4) Connectance (C): the proportion of realised interactions out of 15
those possible in the network; (5) Interaction Eveness (IE); Shannon’s eveness of 16
interactions within the network, measures the uniformity of species; (6) Network
17
Specialisation (H’2), measures the extent to which observed interactions deviate from those 18
that would be expected given the species marginal totals, ranges from 0 (no specialisation) 19
and 1 (complete specialisation); (7) Weighted-Interaction Nestedness Estimator (WINE), 20
ranges from 0 (no nestedness) to 1 (maximal nestedness), to test whether the matrix differed 21
significantly from random we compared WINE to those calculated from 1000 randomly 22
simulated matrices with equal dimensions (Ulrich and Gotelli 2007). Species were defined as 23
a super-generalist if they interacted with more than 20% of the available partner species 24
9 Generalised linear models were used to compare species-level metrics (1) between species 1
with varying geographic range sizes (for the combined network) (2) between the low 2
mountain network (full), low mountain network (excluding honeybees) and high the mountain 3
networks. Models of interaction number and linkage level were fitted with Poisson error 4
distribution and models of specialisation (d’) with a normal effort distribution. Tukey’s post-5
hoc tests were used to test for variation between categories. 6
The overlap of species in the high and low mountain networks was assessed using the 7
Sørensen similarity index, which ranges from 0 (no species shared) through to 1 (all species 8
shared). Detrended correspondence analysis was used to assess whether floral morphology 9
(corolla depth, floral radius, symmetry and shape) differed in accordance to plant species 10
geographic range size. Categorical traits were converted into binary and numerical data for 11
analysis. Analyses were all performed in R version 3.3.1 (R Core Team 2017) using the 12
vegan package (Oksanen et al. 2016). 13
14
3. RESULTS
15The combined mountain network consisted of 190 links between 44 bee species and 60 16
plant species, resulting in a network connectance of 7.92 per cent. A higher number of links 17
were realised in the low mountain network (140 between 84 species) as compared to the 18
high mountain network (78 links between 63 species). Just under half of all plant species 19
were shared between the high and low mountain networks (Sørensen similarity = 0.46), 20
whilst the pollinator showed slightly higher levels of overlap (Sørensen similarity= 0.67). Full 21
visualisation of the combined mountain network is shown in Figure S2. 22
3.1 Range-size and generalisation 23
Approximately thirty percent of species within the combined network were restricted to the 24
10 Tables S1 and S2). Twenty-nine percent of species had regional distributions but the
1
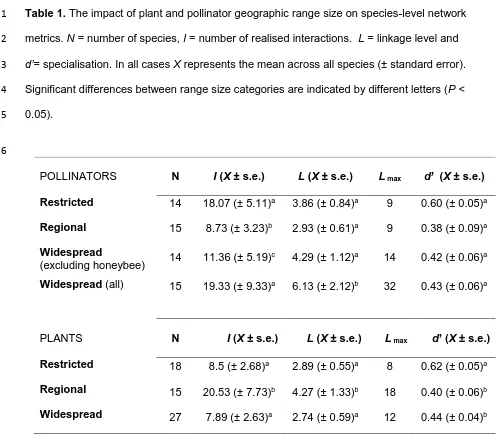
majority were widespread (40%; Table 1). Range-restricted and widespread bee species 2
were involved in a significantly higher number of interactions than regionally distributed 3
species (glm: Δ AIC= 67.44, χ2=71.44, df=2, P<0.001), but when the introduced honeybee
4
(A. mellifera) was excluded, range-restricted bees exhibited the highest mean number of 5
interactions per species (Table 1). The honeybee stood out as a super-generalist within the 6
network, accounting for 20% of observed interactions in the combined network and visiting a 7
total of 33 plant species. On average, widespread pollinators visited the highest number of 8
plant species (Δ AIC=14.34, χ2=18.34, df=2, P=0.001), although when the honeybee was
9
excluded mean linkage levels did not differ by pollinator range (Table 1). Despite being 10
involved in the highest number of interactions, range-restricted pollinators showed the 11
highest levels of specialisation (d’; Table 1), although the effect was marginally non-12
significant (Δ AIC= 1.72, χ2=0.40, df=2, P=0.058).
13
Regionally distributed plants received twice as many visits, from twice as many 14
pollinator species, than restricted and widespread plants (Ints: Δ AIC=131.67, χ2=135.67,
15
df=2, P<0.001, links: Δ AIC= 3.27, χ2=7.24, df=2, P=0.027). Mean plant specialisation d’ did
16
not differ between regional and widespread plants, but was significantly higher for range-17
restricted plants (d’: Δ AIC=5.02, χ2=0.50, df=2, P=0.010; Table 1). Despite these differences
18
in specialisation, the ordination analysis of floral traits revealed no significant difference 19
between the floral morphology of range-restricted, regional and widespread plants (R2 =0.08,
20
P=0.125; Fig S3). Three plant species stood out as super-generalists within the network: the 21
regionally distributed Achillea santolina, involved in 16% of all interactions and visited by 18 22
bee species; the regionally distributed Caylusea hexagyna, involved in 9% of interactions 23
and visited by 15 species; and the widespread cultivated Foeniculum vulgare, involved in 7% 24
of interactions and visited by 12 species. 25
11 The combined network had a WINE value of 0.65 and was characterised by a significantly 1
nested structure (mean of 1000 random simulations = 0.33, max=0.53; Z=15.72, P<0.001). 2
The nested structure meant that a subset of rarer pollinators tended to interact with common 3
super-generalist plants such as A. santolina, F. vulgare and C. hexagyna (Fig. 1; bottom left 4
of network) and that common, generalist pollinators such as A. mellifera and Haltictus
5
gemmellus tended to visit a subset of rarer, specialist plants, many of which had restricted 6
distributions (Fig. 1: top right of network). 7
3.3 Impact of honeybees on network structure 8
Honeybees were largely absent from the high mountain network (<5% of all interactions) but 9
accounted for 27% of all interactions within the low mountain network where hives are widely 10
managed (Fig 2a). Although honeybees visited over half of the available plant species within 11
the low mountain network, they almost exclusively interacted with regional and widespread 12
plants, with just 7% of interactions involving range-restricted plants (Fig 2b). Range-13
restricted bees showed the highest dependency on plants utilised by honeybees in the low 14
mountain network (Restricted, 13 shared plant species, 47% visits overlapping; regional, 8 15
plant species, 15% visits; widespread, 19 plant species, 37% visits). 16
The low-mountain network was larger than the high-mountain network, but supported 17
an equal number of pollinator species and had equal connectance (Table 2). Network 18
specialisation was higher in the high-mountain network (Table 2), with pollinators showing 19
significantly lower linkage levels (links: Δ AIC=17.59, χ2=21.59, df=2, P<0.001) and plants
20
showing significantly higher specialisation (d’: Δ AIC=25.20, χ2=1.90, df=2, P< 0.001).
21
Simulated removal of the honeybee from the low-mountain network also led to a decrease in 22
pollinator generalisation and increase in plant specialisation (Table 2). The low-mountain 23
network had significantly higher nestedness than the high-mountain network (comparison of 24
maximal nestedness matrices: P=0.031), and removal of the honeybee from the low-25
12
4. DISCUSSION
1
The introduced honeybee acted as a super-generalist increasing overall network 2
generalisation, but made very few visits to range-restricted plants and exhibited 3
disproportionately high levels of resource overlap range-restricted bees. This suggests that 4
introduction of honeybees can have differential impacts on native species in accordance to 5
their geographic range size and that range-restricted species may be more vulnerable to 6
visitation deficits or increased floral competition. Range-restricted plants show a greater 7
degree of specialisation in this system than pollinators with comparably limited ranges. In the 8
case of plants, this may reflect both cause and consequence; plants with few pollinators may 9
struggle to expand their ranges due to pollen limitation, while widespread pollinators might 10
favour commonly-encountered plants. Range-restricted pollinators, in contrast, might be less 11
discriminatory in their interactions out of necessity, though this implies that some other 12
factor(s) prevents them from expanding their range. Each side of the interaction must 13
therefore be responding to a different balance of forces shaping their overall degree of 14
specialisation. 15
Previous studies investigating the relationship between pollinator range size and 16
generalisation have tended to focus on oceanic islands, where endemic bees have been 17
shown to visit a higher diversity of plants than non-endemic and exotic bees (Olesen et al. 18
2002; Travaset et al. 2013). In this mountain system, range-restricted bees were abundant 19
and involved in a large proportion of interactions, but showed no evidence of the super-20
generalism associated with oceanic islands. Islands and mainland systems inevitably differ 21
in the causal forces leading to range restriction, and these shaping forces may exert 22
contrasting pressures on how species form their interactions. On islands, endemic species 23
are forced to become generalised because they have limited partner choice and nowhere 24
else to go. This extreme isolation rarely occurs in mainland systems (other than for strict 25
habitat specialists), so species are able to move and seek preferred interactions rather than 26
13 4.1 Geographic range size and species roles
1
Range-restricted bees may not have exhibited island-like super-generalism, but they were 2
involved in significantly more interactions than more widely distributed natives, and visited a 3
range of plants with restricted, regional and widespread distributions. Trends were very 4
different for range-restricted plants that received significantly fewer interactions than 5
regionally distributed plants. Not only were range-restricted plants significantly more 6
specialised than wider-ranged counterparts, they also showed a much higher dependence 7
on range-restricted pollinators and received very few visits from the introduced honeybee. 8
We found no evidence of range-restricted plants being more morphologically specialised 9
than their widespread counterparts in terms of floral traits, suggesting that it is not simply a 10
morphological constraint (such as corolla tube length) that is limiting the diversity of their 11
floral visitors. Other studies have shown that endemic plants are at greater risk of pollination 12
failure than non-endemics plants (e.g. Alonso 2010), suggesting that endemic specialisation 13
is not simply a co-evolutionary artefact, but that competition for pollinators may actively 14
impose constraints on plant range-expansion. 15
Evidence of whether pollination can actively limit range-expansion is mixed. Although 16
some research has shown pollen limitation towards the edge of the range (Moeller et al. 17
2012), other studies have shown no change in visitation rate (Hargreaves et al. 2015) and no 18
consistent decrease in pollen limitation towards the (altitudinal) range limits (Theobald et al. 19
2016). Our study does not assess whether plant generalisation is cause or a response to 20
range size, but the results do provide novel insight into the potential vulnerability of 21
specialised range-restricted plants within visitation networks. 22
Despite being the most species-rich group, widespread plants received fewer visits 23
and exhibited lower linkage levels than those with regional distributions. Some of these 24
widespread plants are historically introduced crop species (Allium, Curcubita, Eruca,
25
14 plants often exhibit high levels of generalisation and frequently act as species-hubs in their 1
non-native range (Bartomeus et al. 2008; Vilà et al. 2009; Traveset et al. 2013), but super-2
generalism in plants is associated with a tendency to become invasive (Emer et al. 2016) 3
and community-level studies have shown that alien plants have lower linkage levels than 4
native plants (Memmott & Waser 2002). The fact that many widespread plants in this study 5
are cultivated, rather than invasive, may contribute towards the lower linkage levels 6
observed. 7
4.2 Impact of the introduced honeybee on network structure 8
Unlike widespread plants, the honeybee stood out as a super-generalist interacting with half 9
of all available plant species. The low mountain network was dominated by honeybee 10
interactions (27% of all interactions) and exhibited significantly lower specialisation and 11
higher nestedness than the high mountain network. The observed difference in network-level 12
specialisation is likely to be influenced by the presence/absence of the super-generalist 13
honeybee, but may also reflect underlying variation in the environmental conditions of the 14
low and high mountains. The characteristics of visitation networks are known to be 15
influenced by altitudinal and environmental variation, with higher altitude networks typically 16
containing fewer interactions and partners (Olesen and Jordano 2002), so the higher 17
specialisation of the high mountain network may simply be a consequence of altitudinal 18
isolation. However the simulated removal of honeybees from the network led to equivalent 19
changes in network structure, suggesting that the higher nestedness observed in the low 20
mountain network is at least partially attributable to the introduction of the super-generalist 21
honeybee. 22
Similar trends have been observed in Spain, where competition with managed 23
honeybees has been shown to decrease wild pollinator niche breadth and increase overall 24
network specialisation (Magrach et al. 2017), and in Brazil where the presence of the 25
15 Comparative studies in Brazil have shown that native super-generalist bees are not
1
associated with the same increases in nestedness, suggesting that exotic generalists do not 2
integrate into networks in the same way as native generalists (Giannini et al. 2015). 3
Increased nestedness could be considered positive, because nestedness is associated with 4
higher levels of robustness in scenarios when the least-linked species go extinct first 5
(Burgos et al. 2007). However, since honeybees tended to link with regional and widespread 6
plants, the least-connected endemic plants become those with the highest extinction risk and 7
so do not benefit from any increase in nestedness in this system. 8
There was strong evidence of resource overlap between honeybees and native bees, 9
with range-restricted bees showing the highest dependency on the plants utilised by 10
honeybees. In California, high numbers of feral honeybees have been shown actively to 11
reduce bumblebee populations through intensified competition over floral resources 12
(Thomson 2016), and earlier research in St Katherine has suggested that honeybees are 13
able to displace native bees from shared floral resources (Semida and El Banna 2006). In 14
this arid resource-limited environment, the presence of such high numbers of the super-15
generalist honeybee may pose a competitive threat to native bees, particularly in the dry 16
season or in periods of prolonged drought. 17
Plants could also suffer as a result of such floral competition, if honeybees out 18
compete more efficient native pollinators. This has been documented following the 19
introduction of beehives in Tenerife, where plants that received high honeybee visitation 20
exhibited a drop in native-bee visitation and a subsequent decrease in their reproductive 21
success (Valido et al. 2014) and in Spain where high rates of honeybee visitation have been 22
shown to limit pollen tube growth in a common wild plant following spill over from an 23
adjacent mass-flowering crops (Magrach et al. 2017). 24
16 In this mountain network, range-restricted plants exhibit much higher levels of specialisation 1
than their pollinators, suggesting that they may be more vulnerable to extinction. Range-2
restricted pollinators were abundant and visited a variety of plant species with wider 3
distributions; however they exhibited high resource overlap with the super-abundant 4
honeybee, which could lead to resource competition. Even a small reduction in the 5
population size of range-restricted bees could be detrimental for the reproductive success of 6
range-restricted plants, which depend on low numbers of specialised interactions. At a local 7
level this study highlights the potential vulnerability of local range-restricted species in 8
response to an introduced super-generalist. More generally, this system provides evidence 9
that range-restricted plants are more specialised in their interactions than range-restricted 10
pollinators, and that the forces shaping the structure of interaction networks vary between 11
partners. 12
DATA ACCESSIBILITY
13Data to be deposited in the Dryad Repository following manuscript acceptance. 14
AUTHOR CONTRIBUTIONS
15O.N., F.G. and M.E. conceived the ideas; O.N. analysed the data 16
and led the writing of the manuscript; all authors contributed to revision of the text. 17
REFERENCES
18Alonso, C., Vamosi, J. C., Knight, T. M., Steets, J. A. & Ashman, T. L. (2010). Is 19
reproduction of endemic plant species particularly pollen limited in biodiversity 20
hotspots? Oikos,119, 1192-1200. 21
Astegiano, J., Funes, G. & Galetto, L. (2010). Comparative studies on plant range size: 22
linking reproductive and regenerative traits in two Ipomoea species, Acta Oecologica,
23
17 Ayyad, M. A., Fakhry, A. M. & Moustafa, A. R. A. (2000). Plant biodiversity in the St.
1
Catherine area of the Sinai Peninsula, Egypt, Biodiversity Conservation, 9, 265-281. 2
Bartomeus, I., Vilà, M. & Santamaría, L. (2008). Contrasting effects of invasive plants in 3
plant–pollinator networks, Oecologia,155, 761-770. 4
Bascompte, J. & Jordano, P. (2007).Plant-animal mutualistic networks: the architecture of 5
biodiversity, Annual Review of Ecology, Evolution, and Systematics, 38, 567-593. 6
Blüthgen, N., Menzel, F. & Blüthgen, N. (2006). Measuring specialization in species 7
interaction networks. BMC Ecology, 6, 9. 8
Boulangeat, I., Lavergne, S., Van Es, J., Garraud, L. & Thuiller, W. (2012). Niche breadth, 9
rarity and ecological characteristics within a regional flora spanning large 10
environmental gradients, Journal of Biogeography, 39, 204-214. 11
Boulos, L. (2002).Flora of Egypt. Al Hadara Publishing, Cairo. 12
Burgos, E., Ceva, H., Perazzo, R. P. J., Devoto, M., Medan, D., Zimmermann, M. & Delbue, 13
A. M. (2007). Why nestedness in mutualistic networks?, Journal of Theoretical
14
Biology,249, 307-313. 15
Cole, C. T. (2003). Genetic variation in rare and common plants, Annual Review of Ecology,
16
Evolution, and Systematics, 34, 213-237. 17
Dirzo, R. & Raven, P. H. (2003). Global state of biodiversity and loss, Annual Review of
18
Environment and Resources,28, 137-167. 19
Dormann, C. F., J, F., Bluethgen, N. & Gruber, B. (2009). Indices, graphs and null models: 20
analyzing bipartite ecological networks, The Open Ecology Journal,2, 7-24. 21
El- Hawagry, M. & Gilbert, F. (2014). Zoogeographical affinities and faunal relationships of 22
bee flies (Diptera: Bombyliidae) in Egypt. Zoology in the Middle East, 60, 50-56. 23
Emer, C., Memmott, J., Vaughan, I. P., Montoya, D. & Tylianakis, J. M. (2016). Species roles 24
in plant–pollinator communities are conserved across native and alien ranges, 25
Diversity and Distributions,22, 841-852. 26
Euro+Med (2006). Euro+Med PlantBase - the information resource for Euro-Mediterranean 27
18 Giannini, T. C., Garibaldi, L. A., Acosta, A. L., Silva, J. S., Maia, K. P., Saraiva, A. M.,
1
Guimarães Jr, P. R. & Kleinert, A. M. P. (2015). Native and non-native 2
supergeneralist bee species have different effects on plant-bee networks, PloS one,
3
10, e0137198. 4
Gorman, C. E., Potts, B. M., Schweitzer, J. A. & Bailey, J. K. (2014). Shifts in Species 5
Interactions Due to the Evolution of Functional Differences between Endemics and 6
Non-Endemics: An Endemic Syndrome Hypothesis , PLoS ONE,9, e111190. 7
Grainger, G. & Gilbert, F. (2008). Around the Sacred Mountain. The St Katherin Protectorate 8
in South Sinai, Egypt., in Mallarach, J.M. (ed.).Protected Landscapes and Cultural
9
and Spiritual Values. Heidelberg: Kasparen Verlag (IUCN). 10
Hargreaves, A. L., Weiner, J. L. & Eckert, C. G. (2015). High‐elevation range limit of an 11
annual herb is neither caused nor reinforced by declining pollinator service, Journal
12
of Ecology,103, 572-584. 13
Karron, J. D. (1987). The pollination ecology of co-occuring geographically restricted and 14
widespread species of Astragalus (Fabaceae), Biological Conservation,39, 179-193. 15
Kearns, C. A., Inouye, D. W. & Waser, N. M. (1998). Endangered Mutualisms: The 16
Conservation of Plant-Pollinator Interactions, Annual Review of Ecology and
17
Systematics,29, 83-112. 18
Kueffer, C., Daehler, C., Dietz, H., McDougall, K., Parks, C., Pauchard, A. & Rew, L. (2014). 19
The mountain invasion research network (MIREN). Linking local and global scales for 20
addressing an ecological consequence of global change , GAIA-Ecological
21
Perspectives for Science and Society,23, 263-265. 22
Kunin, W. E. & Gaston, K. (1997).The biology of rarity: causes and consequences of
rare-23
common differences. Springer Science & Business Media. 24
Larsen, T.B. (1990). The butterflies of Egypt. Apollo Books. The American University in Cairo 25
19 Lavergne, S., Thompson, J. D., Garnier, E. & Debussche, M. (2004). The biology and
1
ecology of narrow endemic and widespread plants: a comparative study of trait 2
variation in 20 congeneric pairs, Oikos,107, 505-518. 3
Magrach, A., González-Varo, J.P., Boiffier, M., Vilà, M. and Bartomeus, I. (2017). Honeybee 4
spillover reshuffles pollinator diets and affects plant reproductive success. Nature
5
Ecology & Evolution,1.DOI: 10.1038/s41559-017-0249-9. 6
Markham, J. (2014). Rare species occupy uncommon niches , Scientific Reports,4, 6012. 7
McCain, C. M. & Grytnes, J. A. (2010). Elevational gradients in species richness , eLS. 8
McDougall, K. L., Alexander, J. M., Haider, S., Pauchard, A., Walsh, N. G. & Kueffer, C. 9
(2011). Alien flora of mountains: global comparisons for the development of local 10
preventive measures against plant invasions, Diversity and Distributions,17, 103-11
111. 12
Memmott, J. & Waser, N. M. (2002). Integration of alien plants into a native flower–pollinator 13
visitation web, Proceedings of the Royal Society of London B: Biological Sciences,
14
269, 2395-2399. 15
Memmott, J., Waser, N. M. & Price, M. V. (2004). Tolerance of pollination networks to 16
species extinctions, Proceedings of the Royal Society of London. Series B: Biological
17
Sciences,271, 2605-2611. 18
Moeller, D. A., Geber, M. A., Eckhart, V. M. & Tiffin, P. (2012). Reduced pollinator service 19
and elevated pollen limitation at the geographic range limit of an annual plant, 20
Ecology,93, 1036-1048. 21
Moustafa, A. A., Zaghloul, M. S., El-Wahab, R. H. A. & Shaker, M. (2001). Evaluation of 22
plant diversity and endemism in Saint Catherine Protectorate, South Sinai, Egypt, 23
Egyptian Journal of Botany,41, 121-139. 24
Norfolk, O., Eichhorn, M. & Gilbert, F. (2014). Culturally valuable minority crops provide a 25
succession of floral resources for flower visitors in traditional orchard gardens, 26
20 Norfolk, O., Dathe, H.H., O'Toole, C. & Gilbert, F. (2017). Filling the knowledge gap
1
surrounding Egyptian pollinators: flower-visiting insects of the St Katherine 2
Protectorate in South Sinai. Zoology in the Middle East. In Review. 3
Olesen, J. M., Eskildsen, L. I. & Venkatasamy, S. (2002). Invasion of pollination networks on 4
oceanic islands: importance of invader complexes and endemic super generalists, 5
Diversity and Distributions,8, 181-192. 6
Oksanen, J., Blanchet, G., Friendly, M., Kindt, K., Legendre, P., McGlinn, D., Minchin, P. R., 7
O'Hara, R. B., Simpson, G.L., Solymos, P., Stevens, M. H. H., Szoecs, E. & 8
Wagner, H. (2016). vegan: Community Ecology Package. R package version 2.4-0. 9
https://CRAN.R-project.org/package=vegan. Accessed: 25/10/2017. 10
Pauchard, A., Kueffer, C., Dietz, H., Daehler, C. C., Alexander, J., Edwards, P. J., Arévalo, 11
J. R., Cavieres, L. A., Guisan, A. & Haider, S. (2009). Ain t no mountain high enough: 12
plant invasions reaching new elevations, Frontiers in Ecology and the Environment,
13
7, 479-486. 14
Rasmont, P., Barbier, Y., Genoud, D., Iserbyt, S., Mahe, G., Michez, D., Patiny, S., Pauly, 15
A., Rasmont, P., Terzo, M., Vereecken, N., Wahis, R. & Haubruge, E. (2016). Atlas 16
Hymenoptera. http://www.atlashymenoptera.net/equipe.asp. Accessed 11/10/2016. 17
R Core Team (2017). R: A language and environment for statistical computing. R 18
Foundation for Statistical Computing, Vienna, Austria. https://www.R-project.org/. 19
Russo, L., Memmott, J., Montoya, D., Shea, K. & Buckley, Y. M. (2014). Patterns of 20
introduced species interactions affect multiple aspects of network structure in plant– 21
pollinator communities, Ecology,95, 2953-2963. 22
Santos, G. M., Aguiar, C. M. L., Genini, J., Martins, C. F., Zanella, F. C. V. & Mello, M. A. R. 23
(2012). Invasive Africanized honeybees change the structure of native pollination 24
networks in Brazil, Biological Invasions, 14, 1-10. 25
Schuh, R.T., Hewson-Smith, S. & Ascher, J.S. (2010). Specimen databases: A case study in 26
21 Semida, F. & El Banna, S. (2006). Impact of Introduced Honey Bees on Native Bees at St. 1
Katherine Protectorate, South Sinai, Egypt , International Journal of Agriculture and
2
Biology, 8(2), 191-194. 3
Stouffer, D. B., Cirtwill, A. R. & Bascompte, J. (2014). How exotic plants integrate into 4
pollination networks, Journal of Ecology,102, 1442-1450. 5
Thomson, D. M. (2016). Local bumble bee decline linked to recovery of honey bees, drought 6
effects on floral resources, Ecology Letters,19, 1247-1255. 7
Traveset, A., Heleno, R., Chamorro, S., Vargas, P., McMullen, C. K., Castro-Urgal, R., 8
Nogales, M., Herrera, H. W. & Olesen, J. M. (2013). Invaders of pollination networks 9
in the Galápagos Islands: emergence of novel communities, Proceedings of the
10
Royal Society of London B: Biological Sciences,280, 20123040. 11
Ulrich, W. & Gotelli, N. J. (2007). Null model analysis of species nestedness patterns , 12
Ecology, 88(7), 1824-1831. 13
Valido, A., Rodríguez-Rodríguez, M. C. & Jordano, P. (2014). Impact of the introduced 14
honeybees (Apis mellifera, Apidae).on Teide National Park (Tenerife, Canary 15
Islands), Ecosistemas,23, 58-66. 16
Vilà, M., Bartomeus, I., Dietzsch, A. C., Petanidou, T., Steffan-Dewenter, I., Stout, J. C. & 17
Tscheulin, T. (2009). Invasive plant integration into native plant–pollinator networks 18
across Europe, Proceedings of the Royal Society B: Biological Sciences,276, 3887-19
3893. 20
21
22 Table 1. The impact of plant and pollinator geographic range size on species-level network 1
metrics. N = number of species, I = number of realised interactions. L = linkage level and 2
d’= specialisation. In all cases X represents the mean across all species (± standard error). 3
Significant differences between range size categories are indicated by different letters (P < 4
0.05). 5
6
POLLINATORS N I (X ± s.e.) L (X ± s.e.) L max d’ (X ± s.e.)
Restricted 14 18.07 (± 5.11)a 3.86 (± 0.84)a 9 0.60 (± 0.05)a
Regional 15 8.73 (± 3.23)b 2.93 (± 0.61)a 9 0.38 (± 0.09)a
Widespread
(excluding honeybee) 14 11.36 (± 5.19)
c 4.29 (± 1.12)a 14 0.42 (± 0.06)a
Widespread (all) 15 19.33 (± 9.33)a 6.13 (± 2.12)b 32 0.43 (± 0.06)a
PLANTS N I (X ± s.e.) L (X ± s.e.) L max d’ (X ± s.e.)
Restricted 18 8.5 (± 2.68)a 2.89 (± 0.55)a 8 0.62 (± 0.05)a
Regional 15 20.53 (± 7.73)b 4.27 (± 1.33)b 18 0.40 (± 0.06)b
23
Table 2.
Topology descriptors of the visitation networks in the low and high mountains of the St Katherine region.
P
and
A
, the
number of plant and animal species respectively;
I
, the number of realised interactions;
C
, connectance (
I
/
AP*100
);
L
, linkage
level, IE, interaction evenness;
H
2, index of network specialization; WINE, weighted integrated nested estimator value (0 random,
1 perfectly nested). For plants (p) and animals (a), the number of links (
L
), generality (
G
), and index of species specialization (
d′
)
are also given. In the
L
and
d
columns significant differences between networks are indicated by different letters (
p
<0.05).
P
A
I
C
L
p(X ± s.d.)
L
a(X ± s.d.)
G
pG
aIE
H
2d
p(X ± s.d.)
d
a(X ± s.d.)
WINE
Whole network
60
44
190
7.92
3.17 ± 3.53
a4.36 ± 5.60
a5.08
7.06
0.58
0.47
0.34 ±0.20
a0.38 ± 0.20
a0.65
Low mountain
(full)
51
33
145
8.62
2.84 ± 2.71
a
4.39 ± 0.95
a4.22
7.70
0.60
0.47
0.33 ± 0.03
a0.43 ± 0.03
a0.60
Low mountain
(excluding honeybee)
42
32
116
8.63
2.76 ± 0.40
a
3.63 ± 0.58
ab4.14
4.81
0.59
0.51
0.40 ± 0.03
ab0.47 ± 0.04
a0.47
24 Figure 1. The maximally packed plant-pollinator visitor matrix. Bee species are shown on
the vertical axis and plants on the horizontal. Species are ranked according to linkage level,
with the strength of interactions represented by the level of shading (darker = more
interactions). Range-restricted species are highlighted with an asterisk. For simplicity this
figure excludes rare interactions that were observed fewer than 3 times.
Figure 2. Comparison of the (a) low and (b) high mountain visitation networks in St
Katherine, with the integration of the introduced honeybee shown in red. White nodes (left)
represent pollinators, black nodes (right) represent plants and the width of the linking lines
represents the number of pollinator-plant interactions. Colour of interaction describes
geographic range of pollinators: Light grey = Restricted, Medium grey = Regional, Dark
25 Fig 1 A c h ill e a s a n to lin a F o e n ic u lu m v u lg a re C a y lu s e a h e x a g y n a Z ill a s p in o s a S ta c h y s a e g y p ti a c a * A n c h u s a m ill e ri * D ip lo ta x is h a rr a P e g a n u m h a rm a la A lk a n n a o ri e n ta lis T a n a c e tu m s a n to lin o id e s * E ru c a s a ti v a P u n ic a g ra n a tu m A lli u m c e p a A lc e a r o s e a B a llo ta u n d u la ta * M e s e m b ry a n th e m u m s p 1 M e n th a l o n g if o lia O ri g a n u m s y ri a c u m * M e d ic a g o s a ti v a Launaea nudi c aul is E c h in o p s g la b e rr im u s * C a rd u u s g e tu lu s A ra b id o p s is k n e u c k e ri * A n a rr h in u m p u b e s c e n s * F a g o n ia m o lli s * G y p s o p h ila c a p ill a ri s * L a p p u la s in a ic a * N ic o ti a n a r u s ti c a M o n s o n ia n iv e a C e n ta u re a s c o p a ri a * A rn eb ia h is pi di ss im a H yo sc ya m us b ov ea nu s Megachile concinna Colletes tuberculatus Lassioglossum collopiense Colletes nanus Anthophora hermanni* Hoplitis africana Osmia laticella* Nomioides squamiger Anthophora alternans Amegilla savignyi Hylaeus xanthopoda Amegilla cognata Megachile insignis* Hylaeus oliviae* Colletes perezi Anthophora concinna * Halictus falx Xylocopa sulcatipes Anthophora crassipes Halictus tibalis * Amegilla mucorea Nomioides turanicus Hoplitis hofferi * Megachile walkeri * Hylaeus sinaiticus* Anthophora pauperata* Anthophora Sinai sp1* Halictus gemmellus Apis mellifera
Nestedness = 0.65
Number of interactions:
[image:25.595.223.556.93.571.2]