Supplemental Figures
Lung function associated gene Integrator Complex subunit 12
regulates protein synthesis pathways
Figure S1: Qualitative comparison of biological replicates of INTS12 protein knockdown. Representative images from the first experiment are shown in the first column and are compared to the images from the independent experiment shown in the second column. Based on these observations it is possible to say that D-siRNA treatment resulted in INTS12 protein depletion and indicates the specificity of used antibody as there is a notable decrease of staining among cells in which RNAi was initiated. In agreement with previous reports, INTS12 appears to have a nuclear sub-cellular localization.
Condition INTS12 staining
Biological replicate 1 Biological replicate 2 Un-transfected cells
D-siRNA INTS12 knockdown
Figure S2: qPCR expression profiling of LEP expression in additional donor cells.
LEP is significantly upregulated in validation donor HBECs depleted of INTS12. Statistical tests were performed comparing to scrambled D-siRNA control: *P<0.05, ****P<0.0001. Individual ∆∆Ct gene expressions are GAPDH normalized and relative to the mean of the scrambled D-siRNA condition. No significant difference was observed between un-transfected and scrambled D-siRNA transfected cells.
LEP
Un-t
ransf
ect
ed
Scra
mbled
D-siRNA
D-siRNA
A
D-siRNA
C
0
2
4
6
8
10
12
14
16
18
Figure S3: Box plots representing log10 of RNAseq FPKM expression values of genes belonging to the top dysregulated pathways.
[image:5.595.69.524.129.547.2]Figure S4: Enrichment plots of pathways upregulated by INTS12 knockdown.
Enrichment plots of reproducibly upregulated pathways in D-siRNA A and C analyses are shown with indicated statistical significance and normalized enrichment scores of their respective upregulations. The FDR and normalized enrichment score values were rounded up to one and three significant figures respectively.
D-siRNA A analysis D-siRNA C analysis
FDR = 0.01
Normalized enrichment score = 1.87
FDR < 0.00001
Normalized enrichment score = 2.42
FDR = 0.03
Normalized enrichment score = 1.78
FDR < 0.00001
FDR = 0.04
Normalized enrichment score = 1.74
FDR = 0.05
Figure S5: Gene expression heatmaps of genes belonging to reproducibly upregulated pathways.
Green and red colours on the Z-scale indicate lower and higher expression respectively. Samples were clustered by unsupervised hierarchical clustering and resulted in clustering of three biological replicate samples of each of the four conditions: un-transfected cells (UT), cells transfected with scrambled D-siRNA control (NC), cells transfected with anti-INTS12 D-siRNA A (A) and cells transfected with anti-INTS12 D-siRNA C (C).
Extracellular matrix organization (REACTOME)
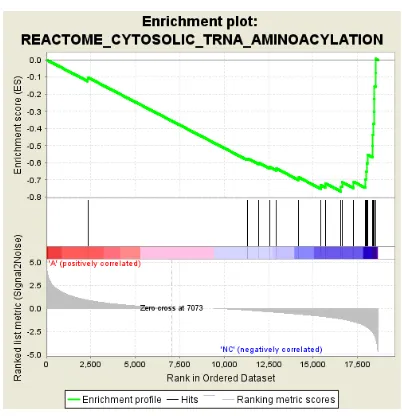
[image:8.595.186.415.218.459.2]Figure S6: Enrichment plots of pathways downregulated by INTS12 knockdown.
Enrichment plots of reproducibly downregulated pathways in D-siRNA A and C analyses, except cytosolic tRNA aminoacetylation (REACTOME) and PERK regulated gene expression (REACTOME), are shown with indicated statistical significance and normalized enrichment score of their respective downregulations. The FDR and normalized enrichment score values were rounded up to one and three significant figures respectively.
D-siRNA A analysis D-siRNA C analysis
FDR = 0.0004
Normalized enrichment score = -2.05
FDR = 0.00009
Normalized enrichment score = -2.10
FDR = 0.002
Normalized enrichment score = -1.95
FDR = 0.00006
FDR = 0.003
Normalized enrichment score = -1.90
FDR = 0.004
Normalized enrichment score = -1.92
FDR = 0.004
Normalized enrichment score = -1.89
FDR = 0.003
FDR = 0.003
Normalized enrichment score = -1.91
FDR = 0.03
Normalized enrichment score = -1.72
FDR = 0.006
Normalized enrichment score = -1.86
FDR = 0.0001
FDR = 0.03
Normalized enrichment score = -1.72
FDR = 0.02
Normalized enrichment score = -1.79
FDR = 0.01
Normalized enrichment score = -1.80
FDR = 0.03
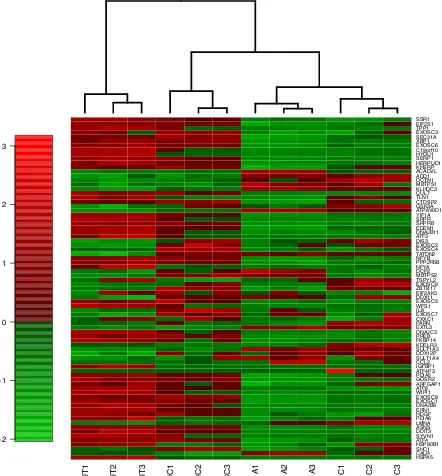
Figure S7 Gene expression heatmaps of genes belonging to reproducibly downregulated pathways.
Green and red colours on the Z-scale indicate lower and higher expression respectively. Samples were clustered by unsupervised hierarchical clustering and resulted in clustering of three biological replicate samples of each of the four conditions: un-transfected cells (UT), cells transfected with scrambled D-siRNA control (NC), cells transfected with anti-INTS12 D-siRNA A (A) and cells transfected with anti-anti-INTS12 D-siRNA C (C).
Unfolded protein response (REACTOME)
Activation of genes by ATF4 (REACTOME)
HSPA5 CALR SHC1 HSP90B1 ATF4 SYVN1 DDIT3 ASNS LMNA PDIA6 HDGF ERN1 DNAJB9 EXOSC1 EXOSC8 WIPI1 ATF6 ARFGAP1 GOSR2 PDIA5 ATF4P3 IGFBP1 CCL2 SULT1A4 DDX12P SULT1A3 KDELR3 FKBP14 PREB DNAJC3 EXTL3 PARN CXXC1 EXOSC7 IL8 WFS1 EXOSC5 DDX11 EIF2AK3 ZBTB17 EXOSC9 TSPYL2 MBTPS2 DCP2 NFYA PPP2R5B NFYB TATDN2 EXOSC4 EXOSC2 DIS3 ATF3 DNAJB11 EDEM1 SRPRB SRPR YIF1A ATP6V0D1 GSK3A CTDSP2 TLN1 CUL7 KLHDC3 MBTPS1 DCTN1 ADD1 ACADVL KHSRP HERPUD1 SERP1 HYOU1 C19orf10 EXOSC6 XBP1 SEC31A EXOSC3 TPP1 EIF2S1 SSR1
UT1 UT2 UT3 NC1 NC2 NC3 A1 A2 A3 C1 C2 C3
[image:14.595.191.412.216.454.2]Glycine, serine and threonine metabolism (KEGG)
Figure S8: Biological reproducibility of INTS12 knockdown.
Figure S9: ChIP-PCR validation of ChIPseq findings.
Three ChIPseq positive binding sites (POR, ACTB, NBPF1) shown in green boxes and one negative binding site (Untr12) shown in blue box were selected for ChIP-PCR testing to determine the number of binding events detected per thousand donor 1 (D1) and donor 2 (D2) cells. ChIP-PCR results corresponded well with ChIPseq data as seen on the genome browser.
Figure S11: The distance between the average of distribution of intersection in random shuffling of target sites and the observed number of overlaps with INTS12 binding.
Random walk represents the frequency distribution of overlaps between INTS12 and test regions generated by shuffling H3K4me3, H3K36me3, H3K27me3, DNaseI and CTCF sites in thousand times permutation test. The larger the Z-score distance between the observed and permuted distribution of intersection, the less likely it is to have occurred by chance. Negative Z-score indicates that the observed connection is less than expected by chance.
[image:20.595.104.479.232.494.2]INTS12 vs H3K36me3
INTS12 vs DNaseI
Figure S12: Correlation of INTScom members at 48h and 120h. Numbers and colours are indicative of Pearson’s correlation coefficients. INTS12 column is highlighted in red box next to the average of coefficients.
INTS12 appears to have poor correlation with other INTScom members in HBECs suggesting its functional independence from the rest of the complex.
Supplemental Tables
Lung function associated gene Integrator Complex subunit 12 regulates protein synthesis pathways
Table S1: Hits of the INTS12 BLASTP search against a database of human proteins.
BLASTP search identified significant sequence similarity between canonical full length human INTS12 protein (NP_001135943.1) and PHD finger family.
BLASTP SEARCH HITS
Description Max score Total score Query cover E value Ident Accession
PHD finger protein 1 isoform b
50.8 50.8 11% 3.00E-06 39% NP_077084.1
PHD finger protein 1 isoform a
50.4 50.4 11% 4.00E-06 39% NP_002627.1
PHD finger protein 21A isoform a
45.4 45.4 11% 2.00E-04 40% NP_001095272.1
PHD finger protein 21A isoform b
44.7 44.7 14% 3.00E-04 37% NP_057705.3
sp110 nuclear body protein isoform a
42.7 42.7 12% 0.001 40% NP_004500.3
histone-lysine
N-methyltransferase 2A isoform 1 precursor
43.1 43.1 11% 0.001 38% NP_001184033.1
histone-lysine
N-methyltransferase 2A isoform 2 precursor
43.1 43.1 11% 0.001 38% NP_005924.2
sp110 nuclear body protein isoform c
42.7 42.7 12% 0.001 40% NP_536349.2
metal-response element-binding transcription factor 2
isoform a
metal-response element-binding transcription factor 2 isoform c
40.8 40.8 11% 0.004 30% NP_001157863.1
metal-response element-binding transcription factor 2 isoform b
40.8 40.8 11% 0.005 30% NP_001157864.1
bromodomain
adjacent to zinc
finger domain protein 2B isoform a
38.1 38.1 27% 0.034 25% NP_038478.2
bromodomain
adjacent to zinc
finger domain protein 2B isoform b
Table S2: Summary of proteins with sequence similarity to INTS12.
Summary of proteins showing sequence similarity to human INTS12 provide evidence for putative chromatin and gene regulation roles.
INTS12-SIMILAR PROTEIN SUMMARIES
PHD finger protein 1 isoform a and b This gene encodes a Polycomb group protein. The protein is a component of a histone H3 lysine-27 (H3K27)-specific methyltransferase complex, and functions in transcriptional repression of homeotic genes. The protein is also recruited to double-strand breaks, and reduced protein levels results in X-ray sensitivity and increased homologous recombination. Multiple transcript variants encoding different isoforms have been found for this gene. [provided by RefSeq, May 2009]
PHD finger protein 21A isoform a and b The PHF21A gene encodes BHC80, a component of a BRAF35 (MIM 605535)/histone deacetylase (HDAC; see MIM 601241) complex (BHC) that mediates repression of neuron-specific genes through the cis-regulatory element known as repressor element-1 (RE1) or neural restrictive silencer (NRS) (Hakimi et al., 2002 [PubMed 12032298]).[supplied by OMIM, Nov 2010].
sp110 nuclear body protein isoform a and c The nuclear body is a multiprotein complex that may have a role in the regulation of gene transcription. This gene is a member of the SP100/SP140 family of nuclear body proteins and encodes a leukocyte-specific nuclear body component. The protein can function as an activator of gene transcription and may serve as a nuclear hormone receptor coactivator. In addition, it has been suggested that the protein may play a role in ribosome biogenesis and in the induction of myeloid cell differentiation. Alternative splicing has been observed for this gene and three transcript variants, encoding distinct isoforms, have been identified. [provided by RefSeq, Jul 2008]
histone-lysine N-methyltransferase 2A isoform 1 and 2 precursor
metal-response element-binding transcription factor 2 isoform a, b and c
No description available
bromodomain adjacent to zinc finger domain protein 2B isoform a
Table S3: Sequences of D-siRNAs used for INTS12 knockdown.
Oligo Sequence
D-siRNA #A 5’-GGAAUGGAAAUAGUGGAACAUCAGG-3’
D-siRNA #B 5’-GGCAAUCAAUUAGUAGAAUGUCAGG-3’
Table S4: Sequences of forward and reverse primers/probes used in snRNA processing and gene expression qPCR assays.
SYBR Green
Target Oligo Sequence
Immature U1 Forward primer 5’-GATGTGCTGACCCCTGCGATTTC-3’
Reverse primer 5’-GTCTGTTTTTGAAACTCCAGAAAGTC-3’
Immature U2 Forward primer 5’-TTGCAGTACCTCCAGGAACGG-3’
Reverse primer 5’-CAGGGAAGCAGTTAAGTCAAGCC-3’
Immature U4 Forward primer 5’-AGCTTTGCGCAGTGGCAGTATCG-3’
Reverse primer 5’-AGCTTTGCGCAGTGGCAGTATCG-3’
Immature U5 Forward primer 5’-TACTCTGGTTTCTCTTCAGATCGC-3’
Reverse primer 5’-TTCTATTGTTGGATTACCAC-3’
MARS Forward primer 5’-TACCCATTACTGCAAGATCC-3’
Reverse primer 5’-CTTGCTGTTTCAGTACAGTC-3’
GARS Forward primer 5’-GTGTTAGTGGTCTGTATGAC-3’
Reverse primer 5’-GTCTTTAAAACTGGCTCAGG-3’
ASNS Forward primer 5’-GATTGGCTGCCTTTTATCAG-3’
Reverse primer 5’-AATTGCAAATGTCTGGAGAG-3’
ATF4 Forward primer 5’-CCTAGGTCTCTTAGATGATTACC-3’
Reverse primer 5’-CAAGTCGAACTCCTTCAAATC-3’
LEP Forward primer 5’-TCAATGACATTTCACACACG-3’
Reverse primer 5’-TCCATCTTGGATAAGGTCAG-3’
TaqMan
INTS12 Forward primer 5’-CTCCAGCTGTCAAAGATCCATT-3’
Reverse primer 5’-GAGAGCTGCTGGATTCTGAAGT-3’
Table S5: Sequences of forward and reverse primers used in ChIP-PCR assays of INTS12 binding to the indicated sites.
Target gene/primer Primer sequence Site (hg19) Type of
binding
POR forward 5’-CAGGGTCCGAGCTGTAGAAG-3’ TSS-145 Positive
POR reverse 5’-CCGGCAGAGAAATGAAAGTG-3’
NBPF1 forward 5’-CACCTACGCCTCCCAGTACC-3’ TSS+108 Positive
NBPF1 reverse 5’-GCCTTGGGTTATCCTGACAC-3’
ACTB forward 5’-AACTCTCCCTCCTCCTCTTCC-3’ TSS-154 Positive
ACTB reverse 5’-CCTCTCCCCTCCTTTTGC-3’
Untr12 forward 5’-TGAGCATTCCAGTGATTTATTG-3’ Chr12:61667747–61667824 Negative
Table S6: A summary of the survey of scientific literature that investigated the effect of INTScom members on snRNA processing. Ezzedine et al. 2011, Chen et al. 2012 and Chen et al. 2013 studies were undertaken on fly S2 cells while Baillat et al. 2005 study was undertaken on human HeLa cells.
Study INTScom protein targeted Effect on snRNA processing
Ezzedine et al. 2011 INTS1 Moderate
Ezzedine et al. 2011 INTS2 Strong
Ezzedine et al. 2011 INTS3 Very weak
Ezzedine et al. 2011 INTS4 Very strong
Ezzedine et al. 2011 INTS5 Moderate
Ezzedine et al. 2011 INTS6 Weak
Ezzedine et al. 2011 INTS7 Weak
Ezzedine et al. 2011 INTS8 Moderate
Ezzedine et al. 2011 INTS9 Very strong (two experiments)
Ezzedine et al. 2011 INTS10 Very weak
Ezzedine et al. 2011 INTS11 Strong
Ezzedine et al. 2011 INTS12 Very weak (one experiment) and weak
(another experiment)
Ezzedine et al. 2011 INTS1 Above 30 and below 100 fold relative
[image:33.595.71.523.124.772.2]Ezzedine et al. 2011 INTS2 Below 3 fold relative to control
Ezzedine et al. 2011 INTS3 Less than 1 fold relative to control
Ezzedine et al. 2011 INTS4 300 fold relative to control
Ezzedine et al. 2011 INTS5 Below 3 fold relative to control
Ezzedine et al. 2011 INTS6 Below 3 fold relative to control
Ezzedine et al. 2011 INTS7 10 fold relative to control
Ezzedine et al. 2011 INTS8 Below 3 fold relative to control
Ezzedine et al. 2011 INTS9 Above 100 but below 300 fold relative
to control
Ezzedine et al. 2011 INTS10 Below 3 fold relative to control
Ezzedine et al. 2011 INTS11 Above 3 but below 10 fold relative to
control
Ezzedine et al. 2011 INTS12 Below 3 fold relative to control
Ezzedine et al. 2011 INTS1 Above 30 and below 100 fold relative
to control
Ezzedine et al. 2011 INTS2 Above 3 but below 10 fold relative to
control
Ezzedine et al. 2011 INTS3 Less than 1 fold relative to control
Ezzedine et al. 2011 INTS4 Above 300 and below 1000 fold relative
to control
Ezzedine et al. 2011 INTS5 Above 10 fold relative to control
Ezzedine et al. 2011 INTS6 Above 3 but below 10 fold relative to
control
Ezzedine et al. 2011 INTS7 10 fold relative to control
Ezzedine et al. 2011 INTS8 Above 3 but below 10 fold relative to
control
Ezzedine et al. 2011 INTS9 Above 100 but below 300 fold relative
to control
Ezzedine et al. 2011 INTS10 Below 3 fold relative to control
Ezzedine et al. 2011 INTS11 Above 10 but below 30 fold relative to
control
Ezzedine et al. 2011 INTS12 Above 3 but below 10 fold relative to
control
Ezzedine et al. 2011 INTS2 Below 3 fold relative to control
Ezzedine et al. 2011 INTS3 Less than 1 fold relative to control
Ezzedine et al. 2011 INTS4 Above 30 and below 100 fold relative
to control
Ezzedine et al. 2011 INTS5 3 fold relative to control
Ezzedine et al. 2011 INTS6 Below 3 fold relative to control
Ezzedine et al. 2011 INTS7 10 fold relative to control
Ezzedine et al. 2011 INTS8 Below 3 fold relative to control
Ezzedine et al. 2011 INTS9 30 fold relative to control
Ezzedine et al. 2011 INTS10 Below 3 fold relative to control
Ezzedine et al. 2011 INTS11 3 fold relative to control
Ezzedine et al. 2011 INTS12 Below 3 fold relative to control
Ezzedine et al. 2011 INTS1 Above 30 and below 100 fold relative
to control
Ezzedine et al. 2011 INTS2 Above 3 but below 10 fold relative to
control
Ezzedine et al. 2011 INTS3 Below 3 fold relative to control
Ezzedine et al. 2011 INTS4 300 fold relative to control
Ezzedine et al. 2011 INTS5 Above 10 fold relative to control
Ezzedine et al. 2011 INTS6 Above 3 but below 10 fold relative to
control
Ezzedine et al. 2011 INTS7 Above 10 but below 30 fold relative to
control
Ezzedine et al. 2011 INTS8 Above 3 but below 10 fold relative to
control
Ezzedine et al. 2011 INTS9 100 fold relative to control
Ezzedine et al. 2011 INTS10 Below 3 fold relative to control
Ezzedine et al. 2011 INTS11 Above 3 but below 10 fold relative to
control
Ezzedine et al. 2011 INTS12 3 fold relative to control
Chen et al 2012 INTS12 Moderate
Chen et al 2012 INTS12 Moderate
control
Chen et al 2012 INTS9 Above 10 but below 30 fold relative to
control
Chen et al 2012 INTS12 Above 1 but below 3 fold relative to
control
Chen et al 2012 INTS12 Above 1 but below 3 fold relative to
control
Chen et al 2013 INTS12 Moderate
Chen et al 2013 INTS12 Moderate
Chen et al 2013 INTS12 Between 5 to 7 fold relative to control
Chen et al 2013 INTS12 Between 1 to 3 fold relative to control
Chen et al 2013 INTS12 Between 3 to 5 fold relative to control
Chen et al 2013 INTS12 Between 3 to 5 fold relative to control
Chen et al 2013 INTS12 No effect
Baillat et al. 2005 INTS11 3 fold relative to control
Baillat et al. 2005 INTS11 4 fold relative to control
Baillat et al. 2005 INTS1 2 fold relative to control
1
Supplemental Methods1
Lung function associated gene Integrator Complex subunit 12
2
regulates protein synthesis pathways
3
Kheirallah et al.
2
Cell Culture5
Human bronchial epithelial cells (HBEC) were purchased from Clonetics-Biowhittaker (MD, USA).
6
Cells were cultured in HBEC basal medium (BEGM) from Lonza (Berkshire, UK; Product code
CC-7
2540) prepared by addition of all the recommended supplements per manufacturer specifications
8
excluding gentamicin. All laboratory experiments were performed using passage 3 cells. Prior to
9
experiments cells were grown at 37oC with 5% CO
2 until ~95% confluent with BEGM media change
10
every ~48h.
11
RNAi
12
Interferin (Polyplus Transfection) was used for gene knockdown optimizations. INTS12 silencing
13
efficiency was tested using D-siRNAs A, B and C (OriGene, Table S3). Subsequently D-siRNAs A
14
and C were tested at 0.1nM, 1nM and 10nM concentrations and a concentration of 1nM was chosen
15
for optimal silencing efficiency. Two D-siRNAs were used in the experiments to account for
off-16
target effects and thus to internally validate our observations. For main RNAseq and functional
17
experiments the effects of INTS12 depletion were assessed 120h after initiation of interference. To
18
ensure appropriate knockdown D-siRNA transfections were administered on two occasions at days
19
zero and three of the experiment. To compare the acute and chronic transcriptomic responses to
20
knockdown, RNAseq profiling was also performed 48h after the initiation of interference. In all
21
experiments there were four experimental conditions: un-transfected cells, cells transfected with
22
scrambled D-siRNA control, and cells transfected with D-siRNAs A and C. Each experimental
23
condition was performed in three independent biological replicates.
24
RNAseq
25
Total RNA was extracted using a mammalian total RNA prep kit with on-column DNaseI digestion
26
(Sigma-Aldrich). Sequencing samples were ensured to have RNA integrity number scores greater
27
or equal to 8 (Agilent Technologies). The sequencing libraries were prepared with Illumina TruSeq
28
RNA Sample Prep Kit v2. mRNA was poly-A selected by capturing total RNA samples with oligo-dT
29
coated magnetic beads. The mRNA was then fragmented and randomly primed. cDNA was
30
synthesised using random primers. Finally, a ready-for-sequencing library was prepared by
end-31
repair, phosphorylation, A-tailing, adapter ligation and PCR amplification. Paired-end sequencing
32
was performed on the HiSeq2000 platform (Illumina) using TruSeq v3 chemistry over 100 cycles
33
3
qPCR35
Cultured cells were lysed and RNA was extracted using silica-membrane columns (Sigma-Aldrich).
36
1µg of total RNA was converted to cDNA using the SuperScript synthesis system leveraging
37
random hexamer priming (Invitrogen). Prior to reverse transcription, RNA was treated with DNaseI
38
for a second time to ensure complete removal of any remaining traces of genomic DNA (gDNA).
39
Each reverse transcriptase positive sample had equivalent reverse transcriptase negative control
40
sample. For TaqMan assays (Applied Biosystems) the final volume of qPCR mix per single well was
41
20µl consisting of 2µl of cDNA template, 6.4µl of DNase and RNase free water, 0.3µM of forward
42
primer, 0.3µM of reverse primer, 0.1µM of probe, and 10µl of x2 TaqMan master mix (Applied
43
Biosystems). For SYBR Green assays the final volume of qPCR mix per single well was 25µl
44
consisting of 5µl of cDNA template, 6.4µl of DNase and RNase free water, 0.25µM of forward
45
primer, 0.25µM of reverse primer, and 12.5µl of x2 Brilliant III Ultra-Fast SYBR Green master mix
46
(Agilent). Reverse transcriptase positive samples were run in triplicate while reverse transcriptase
47
negative samples were run in duplicates. Every qPCR ran had a water only control. qPCR oligo
48
sequences are shown in the Table S4. Housekeeping GAPDH expression was run using
pre-49
developed assay reagents (Life Technologies). QPCR-derived relative to GAPDH and control gene
50
expression was analysed using ΔΔCt method [62]. QPCR technical validation of RNAseq findings
51
was performed using at least three biological cDNA replicates derived from total RNA used in
52
sequencing thus were upon the same donor cells. QPCR biological validation of target genes was
53
performed upon different donor cells with at least three biological cDNA replicates.
54
RNAseq and Pathway Data Analysis
55
The quality of raw fastq files was assessed on fastqc. Tuxedo analysis pipeline was used for
56
RNAseq analysis [63]: (1) TopHat read alignment was performed upon hg19 build, (2) Cufflinks
57
transcriptome assembly was performed on individual sample basis and merged by Cuffmerge using
58
reference-based assembly, (3) Cuffdiff differential gene expression was performed using
59
Cuffmerge-predicted annotation. Loci with Benjamin-Hochberg corrected P value [60] below 0.05
60
were considered significant. Transcriptomic comparisons were performed comparing scrambled
D-61
siRNA to each anti-INTS12 D-siRNA and comparing un-transfected cells with scrambled D-siRNA
62
4
In order to perform pathway analyses, fragments per kilobase per million reads (FPKM) expression
64
values were obtained for each gene per individual RNAseq sample using Cuffnorm. Loci containing
65
multiple amalgamated genes were separated into individual genes and had assigned the equivalent
66
expression values, while genes occurring multiple times on the dataset had their expression values
67
summated using in-house written python script. Scripts can be accessed on GitHub repository
68
(https://github.com/msxakk89/dataset_preperation_scripts). Gene set enrichment analysis using
69
4722 curated gene sets including 1320 canonical pathway definitions from the Molecular
70
Signatures Database [35] was used, comparing scrambled D-siRNA to each anti-INTS12 D-siRNA
71
and comparing un-transfected cells with scrambled D-siRNA transfected cells. Pathways with
72
Benjamin-Hochberg corrected P value below 0.05 were considered significant. Pathways
73
reproducibly dysregulated by the two different D-siRNA treatments were considered further. Top
74
candidate pathways with the highest enrichment score in both D-siRNAs were chosen for further
75
functional analysis. Results of the pathway analysis were displayed in a Cleveland’s plot using
76
ggplot2 R package while pathway heatmaps were drawn using heatplus R package. Boxplots were
77
drawn using build-in R function. Pearson’s correlations of gene expression were calculated using
78
hmisc R package and drawn using ggplot2.
79
Comparison of acute and chronic transcriptomic responses to INTS12 knockdown aimed at
80
identifying core subset genes significantly differentially expressed in 48h and 120h time points
81
respectively. The rational of the analysis was similar to pathway analysis, i.e. genes were
82
shortlisted if were reproducibly dysregulated in both anti-INTS12 siRNAs but not in scrambled
D-83
siRNA. Genes that were dysregulated in both anti-INTS12 D-siRNAs in a given direction while in
84
the opposite direction in the scrambled D-siRNA sample were also included.
85
Core subset of genes was identified by determining the common genes between the 48h and 120h
86
significant gene lists. Enrichment of lung biology relevant gene set was performed via Fisher’s
87
exact over-representation analysis using the background of protein coding genes. Correlation of
88
5
Protein synthesis by 35S-Methionine incorporation assay
94
Rates of protein synthesis were measured using EasyTag 35S protein labelling for 10 minutes in
95
labelling medium, followed by lysis of cells in passive lysis buffer (Promega) and TCA precipitation
96
on filter paper as described previously for NIH3T3 cells [64]. Three biological replicates with four
97
technical replicates each were performed. In parallel, the same samples were assayed for total
98
protein using 200µl Coomassie Protein Assay Reagent (Thermo) with 10µl of lysate in microtitre
99
plates and a Synergy HT plate reader (Biotek) at 595 nm. Background for lysis buffer alone was
100
subtracted. For each replicate, the radioactive incorporation was divided by the protein assay
101
measurements thus yielding a measure of incorporation per amount of total protein. Statistical
102
significance of difference in protein synthesis in INTS12 depleted cells was determined by one-way
103
ANOVA analysis of variance followed by Fisher’s Least Significant Difference test.
104
Assessment of proliferative capacity by cell counts
105
Proliferative capacity was assessed by comparing total cell counts at the beginning and at end of
106
the knockdown, i.e. at the beginning of experiment cells were seeded at the same density in all
107
the conditions. At the end HBECs were washed with PBS, treated with trypsin/EDTA at 37oC for
108
10min to allow all the cells to detach and were re-suspended in 1ml of culture media. Samples
109
were coded and mixed to perform counting without knowledge of the condition and conditions
110
were decoded later. Cell counts were performed on haemocytometer in technical triplicate per each
111
condition, averaged and total cell count estimates derived accordingly. Experiment was performed
112
6
ChIPseq121
HBECs from two different donors were fixed with formaldehyde solution for 15 min. Formaldehyde
122
solution contained 11% formaldehyde (Sigma), 0.1M sodium chloride (Sigma), 1mM EDTA
123
(Sigma), 50mM 4-(2-hydroxyethyl)-1-piperazineethanesulfonic acid (Applichem). Fixation was
124
quenched with 0.125 M glycine (Sigma). Chromatin was isolated by the addition of lysis buffer
125
(Active Motif), followed by disruption with a Dounce homogenizer (Active Motif) to allow for
126
efficient chromatin preparation. Lysates were sonicated and the DNA sheared to an average length
127
of 300-500bp. Genomic DNA for each replicate sample was prepared by treating aliquots of
128
chromatin with RNase, proteinase K and heat for de-crosslinking, followed by ethanol precipitation
129
(Active Motif). Pellets were re-suspended and the resulting DNA was quantified on a NanoDrop
130
spectrophotometer. Extrapolation to the original chromatin volume allowed quantitation of the
131
total chromatin yield. 30µg chromatin of each sample was precleared with protein A agarose beads
132
(Invitrogen). Unprecipitated genomic DNA (i.e. input control) was prepared from a pool of equal
133
aliquots of the two donor samples. Genomic DNA regions of interest were isolated using 4µg of
134
antibody against INTS12 (Sigma cat. num. HPA03577) following manufacturer’s specifications
135
(Active Motif). Complexes were washed, eluted from the beads with SDS buffer, and subjected to
136
RNase and proteinase K treatment. Crosslinks were reversed by incubation overnight at 65oC, and
137
ChIP DNA was purified by phenol-chloroform extraction and ethanol precipitation. Initially a pilot
138
experiment was conducted where DNA libraries obtained from single donor were sequenced on
139
NextSeq 500 sequencing machine (Illumina) yielding ~8 million single-ended 75bp reads in order
140
to assess the success of ChIPseq. For the definite experiment, sequencing libraries (Illumina) were
141
prepared from the both ChIP and input DNAs and the resulting libraries were sequenced yielding
142
~40 million reads per two ChIP samples from each donor cells and one input control of both
143
donors.
144
ChIP-PCR
145
INTS12 peak regions used for qPCR validation were prioritized based on ChIPseq signals observed
146
on the genome browser. Three positive regions and one negative region were chosen for ChIP-PCR
147
validation. PCR primers were designed to span these regions (Table S5). qPCR reactions were
148
carried out in triplicate upon 12.5ng of gDNA from each donor and input control using SYBR Green
149
assay (Bio-Rad). Ct values were converted into the number of binding events detected per 1000
150
7
ChIPseq Data Analysis152
Reads were BWA aligned [65] to hg19 using default settings. Artefactual read duplicates were
153
removed using samtool prior to further analyses. MACS INTS12 peak calling was run on each
154
donor separately comparing ChIPseq samples to input control [66]. Calling was performed with a
155
multiple comparisons corrected P value of less than 0.05 considered as significant. Generated
156
fragment pileup signal was normalized to library size. Fragment pileup was converted to wig files
157
based on fold enrichment above input background for each donor. To compare peak metrics
158
between two donor samples, overlapping intervals were grouped into active regions, which were
159
defined by the start coordinate of the most upstream interval and the end coordinate of the most
160
downstream interval. In locations where only one sample had an interval, this interval defined the
161
active region. ChIP signal at these active regions was compared between the two donor samples
162
and correlation drawn and calculated by ggplot2 and rcmdr R packages respectively. Intervals
163
were annotated, percentage of total INTS12 binding sites falling on the fixed annotated genomic
164
features and enrichment over meta-gene body determined using CEAS package [67]. The
165
proportion of binding proximal to TSS was calculated by dividing the number of significant peaks
166
close the TSS (TSS±1000bp) by the number of significant peaks falling within the broader region
167
surrounding the TSS (TSS±3000). Enrichment over various gene classes, expressed/not
168
expressed, or differentially expressed genes was drawn using ngs.plot [68]. Gene classes were
169
retrieved using Ensembl’s BioMart tool. HOMER and MEME were used for de novo identification of
170
enriched DNA motif at INTS12 binding sites [51, 52]. TomTom was used to compare de novo
171
identified motif to a set of currently known motifs [53]. BETA was used to predict INTS12
172
regulatory function [49].
173
ENCODE data retrieval and analysis
174
Airway epithelial cells specific epigenetic and CTCF ChIPseq datasets were obtained from ENCODE
175
data repository (ENCBS417ENC; www.encodeproject.org) and analysed as INTS12 ChIPseq
176
datasets with the only difference that broad region calling was used for the epigenetic marks.
177
Percent of overlap between INTS12 intervals and ENCODE intervals and its statistical significance
178
was determined using regioneR R package with random permutation test. Correlation of ChIPseq
179
signals and conservation of binding analyses were performed using cistrome [69].
180
8
Immunofluorescence182
Cells were grown on 8-chamber glass slides seeding 8000 cells onto each chamber and were left
183
un-treated or were transfected with anti-INTS12 and scrambled D-siRNAs as described previously.
184
Cells were fixed using 4% formaldehyde and blocked/permeabilized with PBS, 10% goat serum,
185
1% BSA, and 0.15% Triton-X. Cells were incubated with antibody against INTS12 (Sigma cat.
186
num. HPA03577) at 4°C overnight and rhodamine-TRITC labelled secondary for 1 hour at room
187
temperature. Controls were incubated with primary isotype control (Abcam) antibody followed by
188
secondary antibody. Cells were visualized epifluorescently and exposures were kept constant
189
across the conditions to avoid artefactual differences in the observed fluorescence intensity.