1
Enhancing natural product extraction and mass transfer using selective microwave
heating
Lee Chai Siah, Eleanor Binner, Charles Winkworth-Smith, Rebecca John, Rachel Gomes, John Robinson*
*Faculty of Engineering, University of Nottingham, NG7 2RD. UK.
John.robinson@nottingham.ac.uk
Abstract
This study uses a combination of empirical observations and an analysis of mass transfer behaviour to yield new insights into the mechanism of microwave assisted extraction. Enhancements in extraction rate and yield were observed experimentally compared with conventional extraction at temperatures in excess of 50°C, however at lower temperatures there was no observable difference between the two processes. A step-change in extract yield between microwave and conventional processes was shown to be caused by selective heating. A temperature gradient of the order of 1oC is
sufficient to reduce the water chemical potential within the cell structure, which changes the osmotic potential such that internal cell pressures can increase to the point where disruption occurs. This paper demonstrates the need to operate microwave extraction processes at a temperature that enables selective heating, and a newly-proposed mass transfer phenomenon that could have wider positive implications for extraction and leaching processes.
2 Keywords
Microwave; Extraction; Chemical Potential; Osmotic Pressure; Selective Heating
1. Introduction
There is an increasing interest in the use of extraction processes to produce natural compounds from plant materials as a sustainable alternative to direct chemical
synthesis. Extraction is carried out using a wide range of solvents and processing methods, and a significant number of studies have focussed on the use of microwave assisted extraction (MAE) instead of conventional hydrothermal processes.
3
hydrocolloid has been extracted using MAE at a yield of 14 %, but extensive
pretreatment (conventional heating, air drying, grinding and refluxing in 80 % ethanol for 5 hours) was carried out and results were not compared with yields from
conventional solvent extraction [7]. The main component of okra extracts are
polysaccharides [8]. MAE of polysaccharides such as pectin is of particular interest due to the inherent difficulty in extraction leading to the requirement for conventional extraction techniques to use extremes in pH, and high temperatures and pressures. Numerous workers have investigated the use of MAE to extract polysaccharides from plant materials. The yield of pectins from orange peel using MAE is reported to be up to 250% higher compared with that of conventional solvent extraction [9]. Several papers cite vapour formation in the capillary-porous structure resulting in large pressure build-up and swelling of the cells as the primary reason for the increase in extraction yield [9-13], and scanning Electron Microscope images are often used to support this theory. However, it is often difficult on close examination to see any definite difference in the images obtained from microwave and conventionally treated samples. Fishman et al. [14] carried out microwave extraction of lime flavedo, albedo and pulp under
pressure (up to 50 psi) and concluded that MAE occurs via conventional acid extraction, albeit accelerated by the unique heating profiles induced by microwave heating.
4
within the system [18]. To date, there has been no attempt to determine quantitatively how microwave heating can lead to enhanced cell rupture, and this paper makes a significant contribution to the field by addressing this question.
The aim of this study is to investigate and understand the extraction mechanisms by comparing microwave and conventional extraction methods, analysing the empirical observations against the dielectric properties of the system components, and
understanding the fundamental mass transfer properties of the system by analysing the effect of thermal gradients on chemical potential.
2. Material and methods
2.1Materials
Okra, sourced from UK food importers, was used as a model feedstock for this study, and the yield of extractable compounds was used as an indicator of process performance and for comparison between microwave and conventional extraction methods. Before processing the okra was washed with deionised water, the upper crown head and the seeds were removed and the pods sliced into uniform sizes.
2.2Extraction
5
After the predetermined extraction time the flasks were kept aside at room
temperature for 1 hour for cooling and complete release of the extractable solutes into water [19]. Aqueous extract was recovered from the processed mixture by
centrifugation at 4000 rpm for 30 minutes. A sample of aqueous extract was dried at 105˚C until a constant solid mass was attained, and extract yield on dry basis (DB) was calculated based on the solid extract mass relative to the dry mass of feedstock. A sample of the feedstock was dried at 105˚C until a constant mass was obtained to calculate the moisture content in the fresh okra, which was 90.93%. Conventional hydrothermal extraction of aqueous extract from sliced okra conducted in a water bath shaker was reported in a previous study [8] and the extraction data was used for comparison with the MAE results.
2.3 Dielectric property measurement
A resonant cavity perturbation method was used to measure the dielectric properties of okra from 20 to 100oC. It consists of a cylindrical copper cavity connected to a vector network analyser, which measures the frequency shift and change in quality factor relative to the empty resonating cavity when a sample is introduced. Samples were loaded into a quartz tube, and held in a furnace above the cavity until the temperature set-point was reached. The tube was then moved into the cavity, and the properties determined at 2470 MHz, which is within 20 MHz of the microwave heating equipment used in this study. The dielectric properties of deionised water were measured using an Agilent 8753 ES Vector Network Analyser and Coaxial Probe.
6
3.1 Extraction time
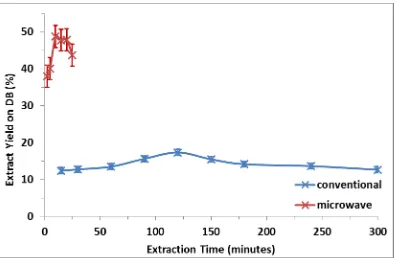
The effect of processing time on the yield and quality of the extract was studied at 70°C for microwave and conventional extraction. Conventional extraction was carried out for up to 5 hours, whereas microwave extraction was studied for up to 25 minutes. The effect of time on extract yield is shown in Figure 1.
The yield obtained during conventional extraction peaks at 18% after 120 minutes, and declines to 13% after 5 hours of processing. Microwave extraction exhibits a much higher yield than conventional, peaking at 48% after just 10 minutes. The decline in yield is thought to be due to degradation of the extracted compounds when they are sustained in the processing environment at 70°C [20,21]. The key observation from Figure 1 is that both the peak yield and extraction kinetics are significantly higher for microwave heating, and indicates that a fundamentally different extraction mechanism takes place as a result. Further insight was sought by studying the effect of temperature, whilst maintaining the processing time consistent with the peak values identified in Figure 1.
3.2 Extraction temperature
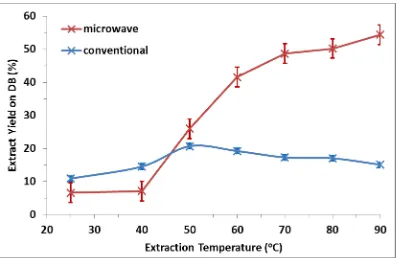
The effect of temperature on extract yield was studied with microwave and conventional heating from 25-90°C, with the results shown in Figure 2.
7
temperatures above 50°C, which is consistent with Figure 1 and the degradation of extracted compounds, whereas the yield from microwave heating continuous to increase with increasing temperature. There is a defined transition at 50°C, at which the yield is comparable between the two techniques.
Figure 2 shows that the increase in yield observed in Figure 1 occurs throughout the 60-90°C temperature range, but is not apparent at temperatures below 50°C. The inference from both Figure 1 and Figure 2 is that a different mechanism occurs with microwave extraction at temperatures above 50°C, but the mechanisms appear to be similar at lower temperatures. The reasons for this behaviour can be understood by studying the dielectric properties of okra and water across this temperature range.
3.3 Dielectric Properties
When a component is selectively heated, it gets hotter than other components in a heterogeneous system. Dielectric properties quantify the interaction between microwave energy and process materials, and can be used to identify and understand selective heating within heterogeneous mixtures. The loss tangent (tan) is the ratio of the
dielectric loss factor (") to dielectric constant ('), and defines the relative ability of a
substance to be heated at a particular frequency. Substances with high tan values will
heat more than those with low tan values, and thus tan can be used to identify
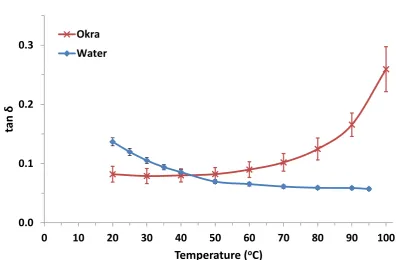
whether selective heating will occur within a given system. Figure 3 shows the variation of loss tangent with temperature for okra and the deionised water used in this study.
The dielectric property data shows the same transition at around 40-50°C that was
observed in Figure 1. Below 45°C water has a higher tan value than okra. In this case
8
is higher than water, which implies that okra will be heated preferentially over water within this temperature range.
The findings from Figure 3 suggest that at temperatures below 45°C the microwave extraction process will behave in the same manner as a conventional extraction process, the only difference being the technique used to heat the water. For conventional and microwave processes below 45°C the okra will be heated primarily due to heat transfer from the surrounding water, with little direct heating of the okra taking place due to interactions with the electric field component of the microwave. On this basis it would be expected that the extraction mechanisms would be the same, and this is supported by the data shown in Figure 2 at temperatures below 50°C. Above 45°C the okra will be heated selectively, meaning that it will be at a higher temperature than the surrounding water and heat transfer taking place in the opposite direction than the case below 45°C. It is highly likely that the enhancements in yield with microwave heating at 50°C and above are due to selective heating, and that a different extraction mechanism
subsequently occurs due to this phenomenon.
4. Extraction mechanism due to selective heating
9
difference between the images obtained from microwave and conventionally treated samples. To date, there has been no attempt to determine quantitatively how microwave heating can lead to enhanced cell rupture. It is possible to estimate the pressures
required to cause cell rupture, and consequently the temperatures needed to raise steam at this pressure. From a theoretical standpoint it is known that the elastic modulus of epidermal cells can be as high as 240 bar [26]. The yield stress, i.e. the pressure at which cell rupture occurs, can be estimated as the point at which 30% strain
deformation of the cell wall occurs due to the increase in pressure [27]. For epidermal cells this equates to a pressure of around 70 bar for cell rupture to occur. If physical disruption was to occur then the vapour pressure of water within the cell would need to approach 70 bar, which would require an internal cell temperature of 286°C [28]. A similar analysis applied to subsidiary and mesophyll cells gives temperatures of 275°C and 145°C respectively. It is highly unlikely that these temperatures could be achieved by selective heating, as heat transfer from the cell to the surrounding solvent would limit the temperature that could be achieved.
The analysis of physical cell disruption suggests that cell rupture due to vapour pressure elevation is highly unlikely to occur given the large temperature difference needed. An alternative mechanism must therefore exist, which will result in pressures high enough to cause cell disruption but at much lower temperatures.
4.1 Mass transfer characteristics during selective heating
Mass transfer occurs due to a difference in chemical potential (), and in the case of
10
conventional conditions where temperatures are equal between the plant cell and surrounding water, however the thermodynamic basis of osmosis is not valid when a temperature gradient exists, as is the case during selective heating. In this case chemical potential, from which osmotic pressure calculations are derived, is the fundamental parameter that governs water and solute equilibria as it can be applied for variable pressure, temperature and water activity (i.e. composition). There are numerous studies that present mass transfer models for pressure-driven transport through cellular
structures using chemical potential as a basis [15-17], however the effect of a temperature gradient on mass transfer has not been reported.
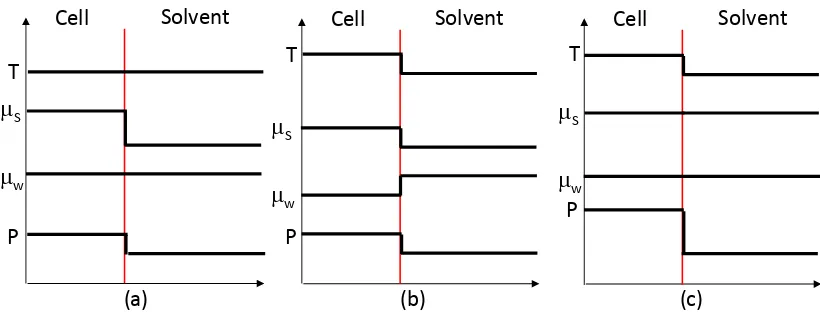
When selective heating takes place the plant material is hotter than the surrounding solvent phase. In this case the water and solute within the plant structure are at a higher temperature than the water and solute in the solvent phase. Chemical potential decreases with increasing temperature [29], so a temperature difference between the plant material and surrounding water will impact on the chemical potential gradient and hence water and solute transfer. A qualitative illustration of this principle is shown in Figure 4.
In case (a) the temperature is constant between the plant material and surrounding solvent. A chemical potential gradient exists for the solute due to a difference in
concentration between the cell and solvent phase, which leads to diffusion of the solute into the solvent as observed in conventional extraction processes. The chemical
11
chemical potentials will also be equal in each phase, as the solute concentration in the solute will increase s.
In case (b) the cell is heated selectively during microwave processing, which causes the chemical potential of both water and solute to decrease within the cell. A chemical potential gradient exists for water between the cell and surrounding solvent, which causes more water to diffuse into the cell. As water transfers into the cell the pressure within the cell increases, which acts to increase the chemical potential within the cell. The solute chemical potential in the cell also decreases due to the increase in
temperature, leading to a smaller chemical potential gradient than the constant temperature case.
Case (c) shows the result of the selective microwave heating process proceeding until equilibrium is reached. A higher pressure is required within the cell to increase the cell-side chemical potential of water such that it equals that in the solvent phase.
12
known pressure limitations within plant cells to identify the likelihood of cell rupture/disruption due to selective heating.
4.3 Quantitative model for equilibrium pressure
Equilibrium exists when the chemical potential of water within a cell (
ˆ
wc) equalsthat of water outside the cell (
ˆ
ws):ws wc
ˆ
ˆ
[Eq. 1]The ^ notation denotes that water is within a mixture, i.e. solutes are present. Subscript c relates to the cell, and subscript s relates to the surrounding solvent. The chemical potential of water within a generic mixture is related to pressure and composition according to Equation 2:
0 0
0 0 ln ˆ ln ˆ w w w w w w w w f f a RT f f RT
[Eq. 2]0
w
is the chemical potential of pure water at temperature T and a standard pressure(usually taken as 1 bar), fˆwis the fugacity of water within the mixture at T, fw is the
fugacity of pure water at T,aw the water activity at T and 0
w
f is the fugacity of pure
water at T and the standard pressure. If the water outside the cell is assumed to be solute free then aws = 1, and combining Equations 1 and 2 yields:
0 0
0 0 ln ln w ws ws w wc wc wc f f RT f f a RT
[Eq. 3]13
*
*
ln
ln w w w P pw
RT v f
f [Eq. 4]
*
w
f is the fugacity of water at saturation, vw the molar volume of water at T and *
w
p
the saturated vapour pressure at T. Combining Equations 3 and 4 gives:
c s
w wcwc
ws P P v RTlna
0
0
[Eq. 5]Where Pc is the pressure within the cell and Ps the external pressure within the solvent. When the temperature is constant between cell and solvent and an ideal mixture
exists then
ws0
wc0 and awc = xwc, and Equation 5 reverts to the classical definitionfor osmotic pressure. However, when selective heating takes place the assumption of constant temperature cannot be made, so a different approach is required. In this case
there are two temperature values, Tc and Ts, and 0
ws
and
wc0 will have different valuesbased on the temperature of the solvent and cell respectively. If the change in chemical potential with temperature for pure water is quantified then Equation 5 can be adapted to estimate the equilibrium pressure within the cell for a variable temperature case, provided that awc is known or can be estimated:
s s
s s c c c c T w T w s s T w T w s T w T w c c T w T w wc c wc
ws P p f
RT v f RT f p P RT v f a
RT * * 0 * * 0
0 0 ln ln ln ln ln
At the standard pressure of 1 bar fw0 fw* as water is liquid under these conditions.
Fugacities at saturation can be approximated to the saturated vapour pressure, which gives the final result shown by Equation 6:
wc w c w wc ws T w s T w c a v RT v p P p
P c s ln
0 0 *
*
14
Equation 6 can be solved for Pc for fixed values of Ts and Tc based on widely available thermodynamic data for vw and p*. The change in chemical potential with temperature can be related according to Equation 7 [30]:
T
[Eq. 7]
is a temperature coefficient, which is numerically equivalent to –s, where s is the
entropy over the temperature range. For liquid water the standard state entropy is 80
J/mol.K at 70oC [31,32].
ws0 can be calculated from the bulk water temperature and0
wc
based on an assumed cell temperature. When Ts = Tc then 0ws
=
wc0 and Equation6 reverts to the standard expression for osmotic pressure.
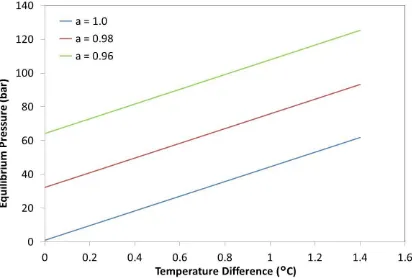
Ts was chosen to be 70°C, consistent with the data shown in Figure 1 and Figure 2. A range of water activities were chosen such that the equilibrium cell pressure at constant temperature gave values within the range of known osmotic/Turgor pressures for plant materials. The lowest value for awc was chosen to be 0.96, which corresponds to an osmotic pressure of 64 bar. The equilibrium pressure as a function of temperature difference between cell and solvent for a range of cell water activity is shown in Figure 5.
The predicted equilibrium pressure within the plant material varies linearly with the temperature difference between the cell and surrounding water. The y-intercepts shown in Figure 5 represent the osmotic pressure (absolute) at 70°C for the range of water activities investigated. A solute free system (awc = 1) has an osmotic pressure of 1 bar, by definition, but shows that an equilibrium pressure of around 45 bar would be
achieved if the plant material was 1°C hotter than the surrounding water. When solutes are present within the plant system then the equilibrium pressures are higher still. When
15
equilibrium pressure exceeds 100 bar with a temperature difference of just 0.8oC. Whilst water activity within the cell is not known for the okra/water system used in this study, it is apparent from Figure 5 that a temperature difference of a few degrees will be sufficient to induce an equilibrium pressure that will exceed the yield stress of most cellular structures, irrespective of the water activity within the plant material [27]. When the yield stress is reached then cell disruption is likely to occur, which reduces the resistance to solute mass transfer and results in a step-change in the extraction kinetics.
The theoretical predictions shown in Figure 5 imply that cell disruption due to increased water uptake is the most likely mechanism that takes place during MAE when selective heating occurs, and it is this mechanism that accounts for the difference
between microwave and conventional heating. With conventional heating the plant structures and solvent are at the same temperature, so there is no net chemical potential gradient for water transport. When microwave heating is used at temperatures below 50°C there is no selective heating of the okra, hence no chemical potential gradient for water and the process behaves in the same manner as conventional hydrothermal
extraction. Above 50°C the okra heats selectively due to its tan value being higher than
water, and under these conditions the okra is at a higher temperature than the
surrounding water. A temperature difference of the order of 1°C is sufficient to induce an equilibrium pressure of around 100 bar within the cell structures, which will exceed the yield stress and lead to disruption of the cell structures. The previously-proposed physical disruption mechanism based on vapour pressure requires a temperature
16
occurs due to a change in water chemical potential, which subsequently results in the yield stress being exceeded when the temperature difference is of the order of 1oC.
The implications of this newly-proposed mechanism could be far-reaching in the field of microwave-assisted extraction, and other mass-transfer limited processes. Whilst the exact extraction mechanism is yet to be fully-proven and is likely to be dependent on the nature and location of the target extract, this study has categorically shown that significant enhancements in yield and extraction rate can be achieved provided that selective heating occurs. Measurement of the dielectric properties of the system components across the process temperature range is essential in order to develop this understanding. The cell disruption mechanism based on chemical potential is likely to apply for a wide-range of systems that use other solvents for extraction and/or reaction purposes where mass-transfer is the rate-determining step, and consequently this work could lead to an enhanced understanding and improvement in process performance where MAE is utilised.
Conclusions
17 References:
1. Flórez, N., E. Conde, and H. Domínguez, Microwave assisted water extraction of plant compounds. Journal of Chemical Technology and Biotechnology, 2015. 90(4): p. 590-607.
2. Farhat, A., et al., Microwave steam diffusion for extraction of essential oil from orange peel: Kinetic data, extract’s global yield and mechanism. Food Chemistry,
2011. 125(1): p. 255-261.
3. Robinson, J.P., et al., Separation of polyaromatic hydrocarbons from contaminated soils using microwave heating. Separation and Purification Technology, 2009. 69(3): p. 249-254.
4. Osaili, T.M., Developments in the Thermal Processing of Food, in Progress in Food Preservation. 2012, Wiley-Blackwell. p. 211-230.
5. Chemat, F. and G. Cravotto, Microwave-assisted Extraction for Bioactive Compounds. 2013, Springer US. p. 240.
6. Mandal, S.C., V. Mandal, and A.K. Das, Essentials of Botanical Extraction. 2015, Academic Press: Boston. p. 207.
7. Samavati, V., Central composite rotatable design for investigation of microwave-assisted extraction of okra pod hydrocolloid. International Journal of Biological Macromolecules, 2013. 61: p. 142-149.
8. Lee, C.S., et al., Optimisation of extraction and sludge dewatering efficiencies of bio-flocculants extracted from Abelmoschus esculentus (okra). Journal of
18
9. Kratchanova, M., E. Pavlova, and I. Panchev, The effect of microwave heating of fresh orange peels on the fruit tissue and quality of extracted pectin. Carbohydrate Polymers, 2004. 56(2): p. 181-185.
10. Zhongdong, L., et al., Image study of pectin extraction from orange skin assisted by microwave. Carbohydrate Polymers, 2006. 64(4): p. 548-552.
11. Yeoh, S., J. Shi, and T. Langrish, Comparisons between different techniques for water-based extraction of pectin from orange peels. Desalination, 2008. 218(1): p. 229-237.
12. Yan, M.-M., et al., Optimisation of the microwave-assisted extraction process for four main astragalosides in Radix Astragali. Food Chemistry, 2010. 119(4): p. 1663-1670.
13. Rodriguez-Jasso, R.M., et al., Microwave-assisted extraction of sulfated
polysaccharides (fucoidan) from brown seaweed. Carbohydrate Polymers, 2011. 86(3): p. 1137-1144.
14. Fishman, M.L., et al., Microwave-assisted extraction of lime pectin. Food Hydrocolloids, 2006. 20(8): p. 1170-1177.
15. Wijmans, J.G. and R.W. Baker, The solution-diffusion model: a review. Journal of Membrane Science, 1995. 107(1–2): p. 1-21.
16. Elmoazzen, H.Y., J.A.W. Elliott, and L.E. McGann, Osmotic Transport across Cell Membranes in Nondilute Solutions: A New Nondilute Solute Transport Equation. Biophysical Journal, 2009. 96(7): p. 2559-2571.
19
18. Meredith, R.J., Engineers' Handbook of Industrial Microwave Heating. 1998, The Institution of Engineering and Technology: London, U.K. p. 377.
19. Ameena, K., et al., Isolation of the mucilages from Hibiscus rosasinensis linn. and Okra (Abelmoschus esculentus linn.) and studies of the binding effects of the mucilages. Asian Pacific Journal of Tropical Medicine, 2010. 3(7): p. 539-543. 20. Wang, J., et al., A comparison study on microwave-assisted extraction of
Potentilla anserina L. polysaccharides with conventional method: Molecule weight and antioxidant activities evaluation. Carbohydrate Polymers, 2010. 80(1): p. 84-93.
21. Veggi, P., J. Martinez, and M.A. Meireles, Fundamentals of Microwave Extraction, in Microwave-assisted Extraction for Bioactive Compounds, F. Chemat and G. Cravotto, Editors. 2013, Springer US. p. 15-52.
22. Spigno, G. and D.M. De Faveri, Microwave-assisted extraction of tea phenols: A phenomenological study. Journal of Food Engineering, 2009. 93(2): p. 210-217. 23. Ferhat, M.A., B.Y. Meklati, and F. Chemat, Comparison of different isolation
methods of essential oil from Citrus fruits: Cold pressing, hydrodistillation and microwave 'dry' distillation. Flavour and Fragrance Journal, 2007. 22(6): p. 494-504.
24. Choi, I.L., et al., Extraction yield of soluble protein and microstructure of soybean affected by microwave heating. Journal of Food Processing and Preservation, 2006. 30(4): p. 407-419.
20
microwave ‘dry’ distillation. Flavour and Fragrance Journal, 2007. 22(6): p.
494-504.
26. Zimmermann, U., D. Hüsken, and E.D. Schulze, Direct turgor pressure
measurements in individual leaf cells of Tradescantia virginiana. Planta, 1980. 149(5): p. 445-453.
27. Pieczywek, P.M. and A. Zdunek, Finite element modelling of the mechanical behaviour of onion epidermis with incorporation of nonlinear properties of cell walls and real tissue geometry. Journal of Food Engineering, 2014. 123: p. 50-59. 28. Rogers, G.F.C. and Y.R. Mayhew, Thermodynamic and Transport Properties of
Fluids. 1994, Wiley-Blackwell. p. 32.
29. Atkins, P. and J. de Paula, Atkins' Physical Chemistry. 2014, Oxford University Press: United Kingdom. p. 1005.
30. Job, G. and F. Herrmann, Chemical potential—a quantity in search of recognition. European Journal of Physics, 2006. 27(2): p. 353.
31. Chase, M.W., NIST-JANAF Thermochemical Tables: Part 1, Al-Co. Journal of Physical and Chemical Reference Data, 1998. Monograph No. 9: p. 1-59. 32. Lide, D.R. and W.M.M. Haynes, CRC Handbook of Chemistry and Physics,
21
22
23
Figure 3 - Loss tangent of okra and deionised water measured at 2470 MHz
0.0 0.1 0.2 0.3
0 10 20 30 40 50 60 70 80 90 100
tan
δ
Temperature (oC)
24
Figure 4 – Illustration of pressure (P), temperature (T) and chemical potential (µs for solute and µw for water) across a cell boundary during microwave heating. (a) – Constant temperature with no selective heating; (b) selective microwave heating; (c) Equilibrium during selective microwave heating.
w
Cell Solvent
P T
w
Cell Solvent
P T
w
Cell Solvent
P T
(a) (b) (c)
S
25