Evaluation of a Method for Determining
Binaural Sensitivity to Temporal Fine
Structure (TFS-AF Test) for Older Listeners
With Normal and Impaired Low-Frequency
Hearing
Christian Fu
¨ llgrabe
1and Brian C. J. Moore
2Abstract
The ability to process binaural temporal fine structure (TFS) information was assessed using the TFS-AF test (where AF stands for adaptive frequency) for 26 listeners aged 60 years or more with normal or elevated low-frequency audiometric thresholds. The test estimates the highest frequency at which a fixed interaural phase difference (IPD) ofj (varied here between 30 and 180) can be discriminated from an IPD of 0, with higher thresholds indicating better performance.
A sensation level of 30 dB was used. All listeners were able to perform the task reliably, giving thresholds well above the lowest allowed frequency of 30 Hz. The duration of a run averaged 5 min. Repeated testing of the normal-hearing listeners showed no significant practice effects. Thresholds varied markedly across listeners, but their ranking was fairly consistent across values ofj. Thresholds decreased (worsened) with decreasingjand were lower than for a group of young listeners tested in an earlier study. There were weak to moderate, negative correlations between TFS-AF thresholds and audiometric thresholds at low frequencies (125–1000 Hz) but not at high frequencies (4000–8000 Hz). In conclusion, the TFS-AF test yielded a graded measure of binaural TFS sensitivity for all listeners. This contrasts with the TFS-LF (low-frequency) test, which measures the smallest detectable shift in IPD for a fixed frequency. The absence of practice effects and a reasonably short administration time make the TFS-AF test a good candidate for the assessment of sensitivity to changes in binaural TFS for older listeners without or with hearing loss.
Keywords
interaural phase, suprathreshold processing, practice effects, clinical screen, sound localization
Date received: 12 April 2017; revised: 19 September 2017; accepted: 20 September 2017
Introduction
In the cochlea, complex broadband signals such as speech are decomposed by the filtering on the basilar membrane (BM) into a series of narrowband signals. The waveform at each place on the BM can be con-sidered as an envelope (ENV) superimposed on a more rapidly oscillating carrier, the temporal fine structure (TFS). One can distinguish between the physical ENV and TFS of the input signal (ENVpand TFSp), the ENV
and TFS at a given place on the BM (ENVBM and
TFSBM), and the neural representation of ENV and
TFS (ENVn and TFSn; Moore, 2014). In what follows,
we use ‘‘TFS’’ as a generic term to refer to the internal representation of TFS, that is, both TFSBMand TFSn.
Sensitivity to changes in TFS does not seem essential for speech intelligibility in quiet (e.g., Van Tasell, Soli, Kirby, & Widin, 1987; Wilson et al., 1991), but it may improve speech intelligibility in the presence of interfer-ing background sounds, presumably through enhanced
1
Medical Research Council Institute of Hearing Research, School of Medicine, The University of Nottingham, UK
2
Department of Psychology, University of Cambridge, UK
Corresponding author:
Christian Fu¨llgrabe, Medical Research Council Institute of Hearing Research, School of Medicine, The University of Nottingham, University Park, Science Road, Nottingham NG7 2RD, UK.
Email: [email protected]
Trends in Hearing Volume 21: 1–14
!The Author(s) 2017 DOI: 10.1177/2331216517737230 journals.sagepub.com/home/tia
perceptual segregation of the target and background (Stone, Moore, & Fu¨llgrabe, 2011), based on differences in perceived direction (Fu¨llgrabe & Moore, 2012, 2014; Neher, Lunner, Hopkins, & Moore, 2012; Rayleigh, 1907) and fundamental frequency (Brokx & Nooteboom, 1982; Jackson & Moore, 2013). Consistent with this, sensitivity to changes in TFS has been shown to be correlated with (a) the variability in speech-in-noise identification performance observed for young normal-hearing (YNH; Oberfeld & Klo¨ckner-Nowotny, 2016; Ruggles, Bharadwaj, & Shinn-Cunningham, 2011) and older normal-hearing (ONH; Fu¨llgrabe, Moore, & Stone, 2015) listeners; (b) the age-related decline in speech-in-noise identification observed for audiometri-cally normal-hearing listeners (Fu¨llgrabe et al., 2015), (c) the speech-identification difficulties of unaided (Strelcyk & Dau, 2009) and aided (Hopkins & Moore, 2011; Lopez-Poveda, Johannesen, Perez-Gonzalez, Blanco, Kalluri, & Edwards, 2017) hearing-impaired (HI) listeners, and (d) self-reported hearing-aid benefit for older HI (OHI) lis-teners (Perez, McCormack, & Edmonds, 2014).
Given the important role of TFS information for speech perception in noisy listening environments, there has been keen interest in the development of reliable and fast tests that could be used to assess TFS sensitivity in the clinic and in large-scale research studies (Bernstein et al., 2013; Hopkins & Moore, 2010; Moore & Sek, 2009; Sheft, Risley, & Shafiro, 2012). One such test is the TFS-LF (low-frequency) test, developed by Hopkins and Moore (2010), in which the task is to distinguish an interaural phase difference (IPD) of jfrom an IPD of 0, in bursts
of pure tones with a fixed frequency. A interval, two-alternative forced choice (2I, 2AFC) task is used, with four successive tones in each interval. In one interval, selected randomly, the four tones all have the same IPD of 0. In
the other interval, the IPD alternates between 0 andjin
successive tones. The task is to indicate the interval in which the tones appear to be more diffuse or to move within the head. This task structure seems to make the task easy to learn, and practice effects are small or absent (Hopkins & Moore, 2010). The initial value ofjis usually set to 180, and j is adaptively varied to determine the
threshold. Although this test has frequently been used to assess sensitivity to binaural TFS (Ernst & Moore, 2012; Fu¨llgrabe, 2013; Fu¨llgrabe et al., 2015; Fu¨llgrabe, Harland, Sek, & Moore, 2017; Hopkins & Moore, 2011; Le´ger, Moore, & Lorenzi, 2012; Lo00
csei et al., 2016; Moore, Glasberg, Stoev, Fu¨llgrabe, & Hopkins, 2012a; Moore, Vickers, & Mehta, 2012b; Neher et al., 2012; Oberfeld & Klo¨ckner-Nowotny, 2016; Perez et al., 2014; Ro¨nnberg et al., 2016; Sharma, Dhamani, Leung, & Carlile, 2014; Whitmer, Seeber, & Akeroyd, 2014), it has been repeatedly observed that some listeners are unable to perform the task, and hence no graded measure of sensitivity to TFS is obtained for those listeners.
To attempt to overcome this limitation, Fu¨llgrabe et al. (2017) modified the TFS-LF test. In their method, referred to as the TFS-AF test (where AF stands for adap-tive frequency), the IPD is fixed and the frequency of the tone is adaptively varied. It was reasoned that the ability to detect a change in IPD worsens markedly above a given frequency (Brughera, Dunai, & Hartmann, 2013; Hughes, 1940) and that this threshold frequency varies across listeners depending on their binaural TFS sensitivity. A similar rationale and method has been used in several earlier studies (Grose & Mamo, 2010; Neher, Laugesen, Jensen, & Kragelund, 2011; Ross, Fujioka, Tremblay, & Picton, 2007; Santurette & Dau, 2012; Thorup et al., 2016). To retain the desirable properties of the TFS-LF test of no or minimal practice effects, little dependence on test level, and reasonably short test duration, the structure of the AF test was made similar to that for the TFS-LF test.
In a series of experiments with YNH listeners (with audiometric thresholds420 dB hearing level [HL] from 125 to 8000 Hz), Fu¨llgrabe et al. (2017) established that all listeners were able to perform the TFS-AF test reli-ably, there was no trend for performance to improve with practice, and thresholds were strongly negatively correlated with those measured using the TFS-LF test (high frequencies at threshold for the TFS-AF test are associated with good TFS sensitivity, which in turn is associated with low thresholds in degrees for the TFS-LF test). Fu¨llgrabe et al. (2017) also demonstrated that middle-aged and older listeners with normal audiometric thresholds below 2000 Hz, selected because they were unable to complete the TFS-LF test in previous studies, yielded a graded measure of binaural TFS sensitivity using the TFS-AF test. In addition, Moore and Sek (2016a) showed that six older listeners (aged 56, 76, 78, 84, 86, and 87 years) with mild-to-moderate hearing loss at low frequencies (and greater losses at high frequen-cies), who were unable to complete the TFS-LF test, were able to complete the TFS-AF test. Based on their findings, Fu¨llgrabe et al. (2017) suggested that the TFS-AF test might be a suitable test for the assessment of the sensitivity to binaural TFS for a wide range of listeners both in the clinic and in large-scale research studies.
and audiometric thresholds (Fu¨llgrabe, 2013; Fu¨llgrabe et al., 2015; Hopkins & Moore, 2011; Moore et al., 2012a, 2012b; Thorup et al., 2016), although both King, Hopkins, and Plack (2014) and Moore and Sek (2016b) found weak-to-moderate but significant correl-ations between measures of IPD sensitivity and audio-metric thresholds at low frequencies.
General Method
This study was approved by the Cambridge Research Ethics Committee and the University of Nottingham’s School of Psychology Ethics Committee. Prior to partici-pation, listeners provided informed written consent. They were paid an hourly wage for their services.
All listeners completed the Mini Mental State Examination (Folstein, Folstein, & McHugh, 1975) to screen for gross cognitive impairment, generally taken as indexed by scores<24/30 points, and scored at least 28 points.
Audiometric thresholds were assessed following the procedure recommended by the British Society of Audiology (2004) and using standard calibrated equip-ment (audiometer, headphones, and bone conductor). Audiometric thresholds were measured for each ear for octave audiometric frequencies from 125 to 8000 Hz, as well as at 750, 1500, 3000, and 6000 Hz.
Stimuli and Procedure for the TFS-AF Test
The ability to detect changes in IPD of low-frequency sinusoidal tones was assessed using the TFS-AF test and, in some cases, the TFS-LF test (Hopkins & Moore, 2010). For both tests, a 2I, 2AFC procedure with feedback was used. On each trial, two consecutive intervals were presented, separated by 500 ms. Each interval contained four consecutive 400-ms tones (including 20-ms raised-cosine rise/fall ramps), separated by 100 ms. In one interval, selected at random, the IPD of all tones was 0 (the standard). In the other interval
(the target), the first and third tones were the same as in the standard interval while the second and fourth tones differed in their IPD byj. Listeners with ‘‘normal’’ TFS sensitivity perceive pure tones with IPD¼0 as being
close to the center of the head, while tones with a suffi-ciently large IPD are perceived as being lateralized toward one ear or the other, or as being more diffuse. Listeners were asked to indicate which of the two inter-vals contained a sequence of tones that appeared to change in some way, for example, to move within the head. The intervals were clearly indicated by boxes on the screen labeled ‘‘1’’ and ‘‘2,’’ which were lit during the corresponding interval. Feedback was provided after each trial by the words ‘‘correct’’ or ‘‘incorrect’’ on the screen and by ‘‘flashing’’ the box for the selected
interval with a green light (for correct) or a red light (for incorrect).
For the TFS-AF test, the frequency of the tones was adaptively adjusted, using a 2-up, 1-down stepping rule to estimate the 71% correct point on the psychometric function (Levitt, 1971). For the TFS-LF test, the differ-ence in IPD was changed using a 2-down, 1-up rule. For the TFS-AF test, the frequency was changed by a factor of 1.4 until the first reversal, then by a factor of 1.2 until the next reversal, and by a factor of 1.1 thereafter. The corresponding factors for the TFS-LF test were 1.95, 1.56, and 1.25. After eight reversals, the run was termi-nated and the geometric mean of the values of the manipulated variable at the last six reversals was taken as the threshold estimate. For the TFS-AF test, the lowest allowed frequency was 30 Hz. If the adaptive pro-cedure called for a value below 30 Hz, the frequency was set to 30 Hz.
Because the adaptive procedures involved multiplying the frequency (or the phase) by certain factors, all thresh-old estimates were based on geometric means, and all statistical analyses were based on the log-transformed thresholds.
The level of presentation in each ear for each test fre-quency was individually adjusted to approximately 30 dB sensation level based on the measured audiometric thresh-olds. This allows testing of listeners with audiometric thresholds up to about 60 dB HL without loudness dis-comfort, unless the listener has unusually low loudness discomfort levels. The audiometric thresholds were con-verted to thresholds in dB sound pressure level using values of the monaural minimum audible pressure esti-mated from the loudness model of Moore and Glasberg (2007), and then the level was set 30 dB higher than the threshold in dB sound pressure level, based on the known sensitivity of the headphones. It was assumed that the headphones had a reasonably flat response at the eardrum over the relevant frequency range. This was the case for the Sennheiser HDA200 headphones used; the response was within 2.6 dB from 125 to 2000 Hz, as measured using KEMAR (Burkhard & Sachs, 1975). For the TFS-AF test, the required levels at intermediate frequen-cies were estimated by linear interpolation (in dB on a logarithmic frequency scale), or, in rare cases (when the frequency was below 125 Hz) by extrapolation. The start-ing values of the trackstart-ing variables for the TFS-AF and the TFS-LF tests were 200 Hz and 180, respectively. The
fixed frequency for the TFS-LF test was 250 Hz. For a few listeners who reported that they could not hear a differ-ence between the two intervals at the start of a TFS-AF run, the run was stopped, and the starting frequency was set to 100 Hz. Further details of the TFS-AF test can be found in Fu¨llgrabe et al. (2017).
babyface soundcard with 24-bit resolution and a sam-pling rate of 48000 Hz. Stimuli were presented via Sennheiser HDA200 headphones. Listeners were seated in a double-walled sound-attenuating booth and chose to enter their responses via either mouse clicks on virtual buttons displayed on a monitor or manual presses of buttons on a response box.
Experiment 1: The Effect of Practice on the
TFS-AF Test for ONH Listeners
Rationale and Method
For YNH listeners, the ability to detect changes in IPD does not change with prolonged practice for the TFS-LF test (Hopkins & Moore, 2010) or for the TFS-AF test (Fu¨llgrabe et al., 2017). In this experiment, we assessed the effects of practice on the TFS-AF test for ONH lis-teners, who initially might show more procedural (i.e., task) learning, due to their lesser experience with (e.g., Czaja & Sharit, 1993) and possible negative attitude and anxiety toward (e.g., Zygouris & Tsolaki, 2015) compu-terized testing. The value of j was 180. All ONH
lis-teners completed 15 threshold runs distributed over three test sessions, scheduled on different days. During the first session, three threshold runs were obtained without pro-viding any prior practice runs. This was done to mimic roughly the test conditions and time constraints found during an audiological assessment or during research studies. However, to familiarize the listeners with the test stimuli, some example four-tone sequences contain-ing an IPD of 0or 180were presented. During each of
the remaining two sessions, separated by not more than five days, six threshold runs were obtained with short breaks between test blocks of three threshold runs.
Listeners
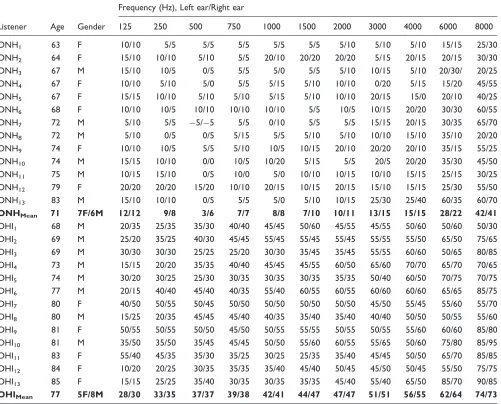
Thirteen ONH listeners (seven females) aged from 63 to 83 years (M¼71.5 years; standard deviation,SD¼5.9) were tested. All listeners bar one had audiometric thresh-olds in each ear420 dB HL between 125 and 4000 Hz; the oldest ONH listener (ONH13 aged 83 years) had
higher thresholds (of 25 to 40 dB HL) at 3000 and 4000 Hz but was included in the study to cover a wider age range and because the elevated thresholds were out-side the range of frequencies tested here. Interaural dif-ferences in audiometric threshold were410 dB for all frequencies below 3000 Hz. Individual and mean audio-metric thresholds are given in the upper part of Table 1.
Results
A run was considered as valid if theSDof the log values of the last six reversals was40.2. All 13 listeners gave
valid threshold estimates for all 15 runs. All threshold values were well above the lowest allowed frequency of 30 Hz.
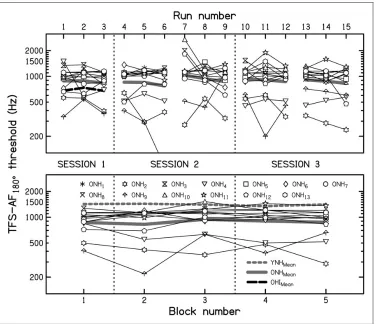
The time taken to complete a threshold run ranged from 2 min 47 s to 10 min 25 s. This relatively large range was mainly due to four outliers, with run durations in excess of 9 min. After removing those values, the mean run duration was 5 min 7 s, similar to that for YNH lis-teners (Fu¨llgrabe et al., 2017). Run durations excluding the four outliers ranged from 2 min 47 s to 7 min 19 s, and 90% of the runs took between 3 min 27 s and 6 min 59 s. The variability arose mainly from the variation of the number of trials within a run, even when the effect of the age of the listener was partialled out (as confirmed by a partial Pearson correlation between run duration and number of trials of .964; p4.001; two-tailed). Longer trials were associated with a large frequency separation between the starting frequency and the threshold value, and with large ratios between successive reversal points. The upper panel of Figure 1 shows the individual thresholds (thin lines) and the geometric means across listeners (continuous thick gray line) for each run number. The lower panel shows the geometric mean across blocks of three runs for each listener (thin lines) and the geometric mean across listeners (continuous thick gray line). For comparison, mean results for a group of nine YNH listeners over the same practice period, taken from Fu¨llgrabe et al. (2017), are shown by the dashed thick gray line. The grand geometric mean across all runs was 892 Hz, 490 Hz lower (worse) than the grand geometric mean for the YNH listeners (Fu¨llgrabe et al., 2017). Individual thresholds and thresh-olds blocked across three runs varied markedly across listeners from 238 to 2698 Hz and 287 to 1525 Hz, respectively. Thresholds as high as 2698 Hz probably resulted from several lucky guesses, because such values are well above the highest frequency for which changes in IPD are detectable even for young listeners with normal hearing, which is about 1500 Hz (Brughera et al., 2013; Hughes, 1940). Thresholds above 1500 Hz occurred for 6 individual runs out of 195 (i.e., 3%).
correlation between age and TFS-LF thresholds at 500 Hz (Spearman’s ¼ .110, p¼.634; two-tailed) and 750 Hz (Spearman’s ¼ .293, p¼.197; two-tailed). However, this finding and the results from the current study are at odds with the observation of Moore et al. (2012a) that binaural TFS sensitivity was significantly correlated with age for 39 listeners, aged 61 to 83 years with normal or near-normal low-frequency audiometric thresholds.
Consistent with findings from previous studies with YNH listeners performing the TFS-LF (Hopkins & Moore, 2010) or TFS-AF test (Fu¨llgrabe et al., 2017), there were no noticeable effects of practice for our ONH listeners, either in terms of improvements or in terms of deterioration due to fatigue, boredom, or loss of motiv-ation. A Friedman’s analysis of variance (ANOVA) was
conducted with the threshold for each block as the vari-able (data in the lower panel of Figure 1) and yielded a
2(4) of 4.369, which was not significant (p¼.358). In
addition, linear regression analyses (threshold vs. block number) for each listener and the entire group showed that none of the slopes was significantly different from zero (all p5.064 without correction for multiple com-parisons; two-tailed).
Experiment 2: The Effect of the Value of
j
for ONH Listeners
Rationale and Method
[image:5.612.65.566.94.498.2]In the previous experiment, the value ofj was fixed at 180, corresponding to the maximum IPD possible. This
Table 1. Age (Years), Gender (F¼Female; M¼Male), and Audiometric Thresholds (dB HL) for the Left and Right Ears of the Older Normal-Hearing (ONH) and Older Hearing-Impaired (OHI) Listeners.
Listener Age Gender
Frequency (Hz), Left ear/Right ear
125 250 500 750 1000 1500 2000 3000 4000 6000 8000
ONH1 63 F 10/10 5/5 5/5 5/5 5/5 5/5 5/10 5/10 5/10 15/15 25/30
ONH2 64 F 15/10 10/10 5/10 5/5 20/10 20/20 20/20 5/15 20/15 20/15 30/30
ONH3 67 M 15/10 10/5 0/5 5/5 5/0 5/5 5/10 10/15 5/10 20/30/ 20/25
ONH4 67 F 10/10 5/10 5/0 5/5 5/15 5/10 10/10 0/20 5/15 15/20 45/55
ONH5 67 F 15/15 10/10 5/10 5/10 5/15 5/10 10/10 20/15 15/0 20/10 40/25
ONH6 68 F 10/10 10/5 10/10 10/10 10/10 5/5 10/5 10/15 20/20 30/30 60/55
ONH7 72 M 5/10 5/5 5/5 5/5 0/10 5/5 5/5 15/15 20/15 30/35 65/70
ONH8 72 M 5/10 0/5 0/5 5/15 5/5 5/10 5/10 10/10 15/10 35/10 20/20
ONH9 74 F 10/10 10/5 5/5 5/10 10/5 10/15 20/10 20/20 20/10 35/15 55/25
ONH10 74 M 15/15 10/10 0/0 10/5 10/20 5/15 5/5 20/5 20/20 35/30 45/50
ONH11 75 M 10/15 15/10 0/5 10/0 5/0 10/10 10/15 10/10 15/15 25/15 30/25
ONH12 79 F 20/20 20/20 15/20 10/10 20/15 10/15 20/15 15/10 15/15 25/30 55/50
ONH13 83 M 15/10 10/10 0/5 5/5 5/0 5/10 10/15 25/30 25/40 60/35 60/70
ONHMean 71 7F/6M 12/12 9/8 3/6 7/7 8/8 7/10 10/11 13/15 15/15 28/22 42/41
OHI1 68 M 20/35 25/35 35/30 40/40 45/45 50/60 45/55 45/55 50/60 50/60 50/30
OHI2 69 M 25/20 35/25 40/30 45/45 55/45 55/45 55/45 55/55 55/50 65/50 75/65
OHI3 69 M 30/30 30/30 25/25 25/20 30/30 35/45 35/45 55/55 60/60 50/65 80/85
OHI4 73 M 15/15 20/20 35/35 40/40 45/45 45/55 60/50 65/60 70/70 65/70 70/65
OHI5 74 M 30/20 30/25 25/30 30/35 30/35 30/35 35/35 50/40 60/50 70/75 70/75
OHI6 77 M 20/15 40/40 45/40 40/35 55/40 60/55 60/55 60/60 60/60 65/65 85/75
OHI7 80 F 40/50 50/55 50/45 50/50 50/50 50/50 50/50 45/50 55/45 55/60 55/70
OHI8 80 M 15/25 20/35 45/45 45/40 40/35 35/40 35/40 40/40 50/50 50/55 55/60
OHI9 81 F 50/55 50/55 50/50 45/50 50/55 55/55 50/55 50/55 55/60 60/60 85/80
OHI10 81 M 35/50 35/50 35/45 45/45 50/50 55/60 60/55 55/65 50/60 75/80 85/95
OHI11 83 F 55/40 45/35 35/30 35/25 30/25 25/35 35/40 45/45 50/50 65/70 85/85
OHI12 84 F 10/20 20/25 30/35 35/35 35/40 45/40 50/45 45/50 50/45 55/50 75/75
OHI13 85 F 15/15 25/25 35/40 30/35 30/35 35/35 45/40 55/40 65/50 85/70 90/85
OHIMean 77 5F/8M 28/30 33/35 37/37 39/38 42/41 44/47 47/47 51/51 56/55 62/64 74/73
was done to ensure that clear differences between the two intervals were heard for as many listeners as possible. However, for this antiphase condition, the side of lateral-ization is ambiguous, with sounds being heard sometimes to the left and sometimes to the right. In addition, as shown in the first experiment, the threshold for the TFS-AF test was lower for ONH listeners than for YNH lis-teners. For low frequencies (below about 770 Hz), a value ofjof 180leads to interaural time differences larger than
would naturally occur, and to which listeners might be less sensitive (Kunov & Abel, 1981; Mossop & Culling, 1998). The purpose of the second experiment was to investigate the effect of the value ofjon TFS-AF thresholds, using values of 30, 45, 90, and 135.
Only 12 of the original 13 ONH listeners were tested, as listener ONH9was no longer available. As all listeners
had completed 15 runs of the TFS-AF test, no further practice was given prior to administration of three test
[image:6.612.114.490.64.388.2]blocks, each composed of one threshold run for each of the four values of j, presented in random order. The final estimate of TFS-AF threshold was based on the geometric mean of the three valid threshold runs for a given value of j. When the SD of the log-transformed threshold values across the three runs exceeded 0.20, an additional run was conducted, and the final estimate was taken as the geometric mean of all four estimates. Fu¨llgrabe et al. (2017) showed that IPD sensitivity for YNH listeners, as measured by the TFS-AF test, declined abruptly when the value of j divided by the IPD threshold at 250 Hz, assessed using the TFS-LF test, was less than about 3 (this ratio is denoted R). To assess whether this was also the case for the ONH lis-teners, two threshold runs for 500-ms, 250-Hz pure tones presented at 30 dB HL were obtained using the TFS-LF test (for further details, see Fu¨llgrabe et al., 2015; Hopkins & Moore, 2010).
Figure 1. Results of Experiment 1 showing individual (thin lines) and mean (continuous thick gray line) thresholds for the TFS-AF test,
usingj¼180. The frequency at threshold is plotted for 13 older normal-hearing (ONH) listeners for 15 consecutive threshold runs (top
panel) distributed over 3 test sessions. Threshold runs were conducted in blocks of three, separated by breaks. Individual (thin lines) and geometric mean (continuous thick gray line) thresholds for each of the five test blocks are shown in the bottom panel. The dashed thick gray line indicates geometric mean results for nine young normal-hearing (YNH) listeners from Fu¨llgrabe et al. (2017) tested under identical conditions to those used here. The dashed thick black line in the top panel shows mean results for the three runs for the older hearing-impaired (OHI) listeners tested in Experiment 3.
Results
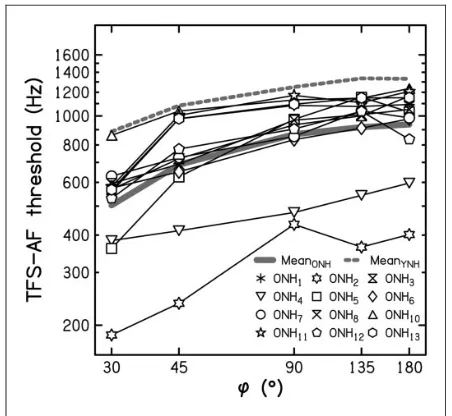
Individual (thin lines) and geometric mean (continuous thick gray line) TFS-AF thresholds for the ONH lis-teners are plotted in Figure 2 as a function of j. The individual differences found in Experiment 1 using
j¼180 (and replotted in Figure 2) persisted across
the lower values ofj tested here. For example, ONH2
performed consistently poorly, and ONH10 performed
consistently well. Spearman correlation coefficients between each listener’s thresholds obtained with
j¼180 and each of the other values of j ranged
from .615 to .902 (all p4.033, two-tailed and without correction for multiple comparisons). Thresholds varied only slightly for values ofjfrom 90to 180but declined
markedly for values of j below 90. A Friedman’s
ANOVA was conducted to assess the significance of dif-ferences between thresholds for the different values ofj. This yielded a 2(4) of 40.07, which was significant
(p<.001). Subsequent Wilcoxon signed-rank tests (uncorrected for multiple comparisons) between thresh-olds for the maximum value ofj and for each smaller value ofjconfirmed that there was no significant differ-ence for the two largest values of j (135 and 180;
z¼ 0.628,p¼.530; 2-tailed), but there was a significant decline for the three smallest values ofj relative to the maximum value (allz42.040, allp4.041; 2-tailed).
For comparison, geometric-mean results for the nine YNH listeners from Fu¨llgrabe et al. (2017) are indicated
by the dashed thick gray line. The difference in mean threshold for the two age groups (YNH vs. ONH) was fairly stable (ranging from a minimum of 381 Hz to a maximum of 418 Hz for values of j of 90 and 135,
respectively) and, on average, 394 Hz. The corresponding ratios (YNH/ONH) of 1.8 for 30, 1.6 for 45, 1.4 for
90, 1.5 for 135, and 1.4 for 180 were also fairly
con-stant but showed a trend to increase forj¼30and 45.
[image:7.612.329.553.386.591.2]A mixed-design ANOVA on the log-transformed thresh-olds with within-subject factor the value of j and between-subject factor age group revealed significant main effects of the value ofj (F[1.625, 30.866]¼40.05, p<.001) and of age group (F[1, 19]¼9.09,p¼.007) but no significant interaction—F(1.625, 30.866)¼1.81, p¼.186. The lack of interaction means that the trend for the ratios to increase for small values of j was not significant.
Figure 3 shows the TFS-AF threshold for each ONH listener plotted as a function of the value ofjdivided by the TFS-LF threshold in degrees for a fixed frequency of 250 Hz, which is denoted R. Filled symbols indicate thresholds that were more than 15% below the threshold for that listener forj¼180. The continuous and dashed
thick gray lines represent mean data for the ONH
Figure 3. Mean individual thresholds (thin lines) and overall mean thresholds (continuous thick black and gray line) for the
TFS-AF test as a function of the ratio R:jexpressed relative to
individual and mean TFS-LF thresholds for 250-Hz tones, respectively (R expressed on a logarithmic scale). Filled symbols indicate TFS-AF thresholds that were more than 15% below that
forj¼180. The thick dashed line indicates mean thresholds for
nine YNH listeners from Fu¨llgrabe et al. (2017).
TFS-AF¼temporal fine structure-adaptive frequency; TFS-LF¼
temporal fine structure-low frequency; YNH¼young
[image:7.612.70.296.429.637.2]normal-hearing; ONH¼older normal-hearing.
Figure 2. Mean individual thresholds (thin lines) and overall mean thresholds (continuous thick gray line) for the TFS-AF test as
a function ofjfor 12 older normal-hearing (ONH) listeners.
The dashed thick gray line indicates mean thresholds for the nine YNH listeners from Fu¨llgrabe et al. (2017).
TFS-AF¼temporal fine structure-adaptive frequency; YNH¼
listeners and for the YNH listeners from Fu¨llgrabe et al. (2017), respectively.
While the YNH listeners tested by Fu¨llgrabe et al. (2017) showed very strong and significant correlations between TFS-AF thresholds for values of j between 30
and 180 and TFS-LF thresholds for 250-Hz pure tones
(Pearson’s r ranging from.82 to .90), the ONH lis-teners showed weaker correlations (Spearman’s ranging from.147 to.818). For the latter, the only significant correlation was observed for the lowest value of j
(p¼.001; two-tailed). Also, there was no specific value of R for ONH listeners below which thresholds declined, while YNH listeners consistently showed worse sensitivity for R43 (see Figure 4 in Fu¨llgrabe et al., 2017). These differences between the ONH and YNH listeners may have occurred because, for the YNH listeners, binaural TFS sensitivity appears to be a global property that char-acterizes a listener over a wide frequency range (Fu¨llgrabe et al., 2017), while for ONH listeners, there may be more idiosyncratic variations in TFS sensitivity across frequency. If this were the case, then in future research studies, it might be useful to characterize sensitivity to bin-aural TFS using the TFS-LF test with several fixed fre-quencies, in addition to using the TFS-AF test. Alternatively, the weaker correlations for the ONH listeners may have occurred because the inherent variabil-ity of their threshold estimates was greater. To assess this,
we calculated the ratio of thresholds for Run 3 and Run 1. The mean value of this ratio across the ONH listeners was 0.97, with an SDof 0.22 and a range from 0.70 to 1.34. The corresponding mean for the YNH listeners was 1.05, with anSDof 0.17 and a range from 0.71 to 1.31. Thus, the variability across runs was not markedly larger for the ONH than for the YNH listeners.
Overall, it appears that the TFS-AF test can give a graded measure of binaural TFS sensitivity for a wide range of values ofjand that the potential ambiguity of lateral position associated with j¼180 does not have
any clear adverse effects. To make the task as easy as possible, so that the listener ‘‘knows what to listen for’’ at the start of a run, a relatively large value ofj, such as 180, seems a reasonable choice.
Experiment 3: The Relationship of TFS-AF
Thresholds to Audiometric Thresholds and
Feasibility of the TFS-AF Test for OHI
Listeners
Rationale and Method
[image:8.612.144.460.409.650.2]While binaural TFS sensitivity has been shown to decline with age across the adult life span (e.g., Fu¨llgrabe et al., 2015), and this as early as midlife (Fu¨llgrabe, 2013; Grose & Mamo, 2010; Ross et al., 2007), binaural TFS
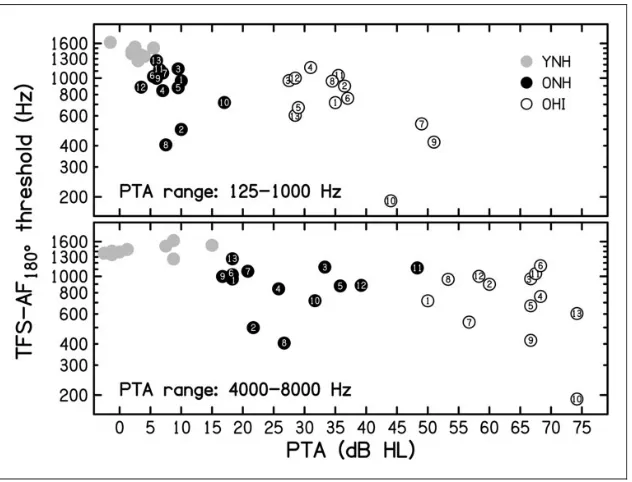
Figure 4. Individual thresholds averaged across runs for the TFS-AF test, usingj¼180, plotted against the pure-tone average (PTA) for
audiometric frequencies from 125 to 1000 Hz (top panel) or from 4000 to 8000 Hz (bottom panel) for 13 older hearing-impaired (OHI) listeners (open symbols), 13 older hearing (ONH) listeners (black-filled symbols; replotted from Figure 1), and nine young normal-hearing (YNH) listeners (gray-filled symbols; replotted from Fu¨llgrabe et al., 2017). The symbols for the ONH and OHI listeners are numbered as in Table 1, in order of increasing age.
sensitivity does not seem to be related to individual dif-ferences in audiometric threshold at the test frequency when audiometric thresholds are in the normal or near-normal range and the age of the listeners is controlled for (e.g., Fu¨llgrabe, 2013; Fu¨llgrabe et al., 2015; Moore et al., 2012a). However, King et al. (2014) tested 46 lis-teners with a wide range of ages and degrees of hearing loss and found weak but significant correlations between TFS sensitivity as measured by the TFS-LF test and the audiometric threshold at the test frequency when the effect of age was partialled out (r¼ .45 and .42, p¼.002 and .005 for pure tones with frequencies of 250 and 500 Hz, respectively). Moore and Sek (2016b) found a similar correlation (r¼ .43, p¼.05) between TFS-AF thresholds forj¼180and audiometric
thresh-olds at 500 Hz for 22 mostly older listeners (aged 56 to 86 years) with audiometric thresholds at 500 Hz ranging from 8 to 60 dB HL (mean of 35 dB HL). They did not report whether the correlation remained significant when the effect of age was partialled out. Thorup et al. (2016) assessed binaural TFS sensitivity using an adaptive fre-quency-tracking task similar to that of Ross et al. (2007). For a group of 29 mostly OHI listeners (aged 52 to 80 years), they did not find a significant correlation between binaural TFS scores and audiometric thresholds aver-aged across the frequencies 250, 500, and 1000 Hz.
We reasoned that a clearer relationship between bin-aural TFS sensitivity and audiometric thresholds might become apparent by comparing results for older listeners falling into two distinct groups in terms of hearing sensi-tivity: normal hearing versus hearing impaired. It has also been speculated that elevated thresholds in the high-frequency range, even though not directly affecting the processing of TFS information in the low-frequency range, could act as an (early) marker of changes in TFS sensitivity (Moore et al., 2012a; Smoski & Trahiotis, 1986; Strelcyk & Dau, 2009). One aim of this experiment was to clarify the link between audiometric thresholds at both low and high frequencies and binaural TFS sensitivity.
The TFS-AF test is based on the assumption that IPD discrimination worsens with increasing frequency. However, it is possible that some HI listeners with low-frequency hearing loss are particularly insensitive to TFS cues at low frequencies, in which case, the adaptive tracking procedure would not work appropriately. As noted earlier, Moore and Sek (2016b) found that the TFS-AF test could be performed consistently by older listeners, many of whom had hearing losses at low frequencies. We wished to confirm this finding for an independent group of listeners.
To test if audiometric thresholds per se affect the pro-cessing of binaural TFS cues and if TFS sensitivity can be reliably assessed for OHI listeners using the TFS-AF test, a group of OHI listeners was tested three times on
the TFS-AF test using j¼180 and their results
com-pared with those for the first three threshold runs of the YNH and ONH listeners. As before, TFS-AF thresholds were log-transformed for all inferential analyses.
Listeners
Thirteen older listeners (five females) aged from 68 to 85 years (M¼77.2 years; SD¼6.0) were tested. Most had relatively flat mild-to-moderate low-frequency hearing losses (on average, a 4-dB decline per octave frequency between 125 and 1000 Hz) with similar audiometric thresholds for the two ears (interaural differences 415 dB). The sensorineural nature of the hearing losses was confirmed by air-bone gaps415 dB at 500, 1000, and 2000 Hz. The lower part of Table 1 indicates listener characteristics and individual and mean audio-metric thresholds for the OHI listeners.
Results
On average, a threshold run was completed in 4 min and 58 s (excluding one outlier with a run time exceeding 9 min), a duration very similar to that for the two other groups. The dashed thick black line in the top panel of Figure 1 shows the mean results for each of the three runs for the OHI listeners. There was no trend for performance to improve across the three runs, indicating an absence of practice effects. To confirm this, and to provide a measure of the repeatability across runs, we calculated the ratio of thresholds for Run 3 and Run 1. The mean value of this ratio across the OHI listeners was 1.0, with anSDof 0.14 and a range from 0.67 to 1.23. The mean,SD, and range were similar to those for the YNH and ONH groups, as described earlier.
Figure 4 shows the individual TFS-AF thresholds (geometric mean for the first three threshold runs for each listener) for the OHI listeners (open symbols), ONH listeners (black-filled symbols; replotted from Figure 1) and YNH listeners (gray-filled symbols; replotted from Fu¨llgrabe et al., 2017), plotted as a func-tion of low-frequency pure-tone average (PTA) averaged across audiometric frequencies from 125 to 1000 Hz (top panel) or of the high-frequency PTA averaged across audiometric frequencies from 4000 to 8000 Hz (bottom panel). Twelve of the 13 OHI listeners gave threshold estimates clearly above the start frequency of 200 Hz. Listener OHI10(aged 81 years) gave considerably lower
thresholds, but all of his runs were valid (as defined ear-lier). His final threshold was close to 190 Hz, which is well above the lowest allowed frequency of 30 Hz.
young to older listeners, as described earlier, TFS-AF thresholds did not decline with age within the combined group of older listeners (Spearman’s¼ .123,p¼.550; two-tailed), perhaps because of the limited age range of these listeners.
The mean threshold was lower for the OHI than for the ONH listeners (699 and 869 Hz, respectively), but the difference was not significant according to a one-tailed Mann–Whitney test (U¼60.50, p¼.109; a one-tailed test was used because we were testing the hypothesis that the TFS-AF threshold would be lower [worse] for the group with hearing loss).
To explore whether there was a gradual change in TFS-AF threshold with PTA that might not be apparent when comparing the ONH and OHI listeners, a correl-ational analysis was conducted for the entire group of older listeners (ONH and OHI listeners combined). Because the PTAs were not normally distributed, Spearman’s was calculated. Using a one-tailed test (uncorrected for multiple comparisons), TFS-AF thresh-olds were significantly correlated with low-frequency PTA (125–1000 Hz; Spearman’s ¼ .444, p¼.012) but not with high-frequency PTA (4000–8000 Hz; Spearman’s¼ .275,p¼.085).
General Discussion
The results showed that a graded measure of binaural TFS sensitivity could be obtained using the TFS-AF test for all ONH and OHI listeners, in contrast to the TFS-LF test. As for the TFS-LF test, practice effects were not apparent for the TFS-AF test. Therefore, the TFS-AF test is suitable for evaluation of binaural TFS sensitivity in the clinic or in large-scale research studies.
The effect of age found here using the TFS-AF test might reflect age-related declines in monaural or bin-aural TFS sensitivity, or both. Moore et al. (2012b) reported moderate correlations between scores on the TFS-LF test and scores on the TFS1 test (a monaural test of sensitivity to TFS) for NH listeners with ages from 22 to 61 years. This might indicate that part of the age-related decline in binaural TFS sensitivity reflects limitations in the processing of TFS at a stage before binaural interaction. It is also possible that the age-related decline reflects a general age-age-related worsening in the efficiency of auditory processing (e.g., Fu¨llgrabe et al., 2015; Patterson, Nimmo-Smith, Weber, & Milroy, 1982). Finally, there may be an age-related increase in auditory distraction produced by task-irrelevant changes (e.g., Getzmann, Gajewski, & Falkenstein, 2013); in the present study, the frequency changes might have been distracting. However, this possibility is not borne out
by a recent study showing no increase in auditory dis-traction with age for intramodal task-irrelevant changes (Leiva, Andre´s, & Parmentier, 2015).
The ranking of performance on the TFS-AF test of YNH and ONH listeners did not vary markedly with the value ofj. In other words, the test could give an estimate of the relative performance of different listeners regard-less of the value of j. However, a large value of j is recommended for routine use to ensure that the task is as easy as possible for all listeners at the start of a run, independent of their age and hearing sensitivity. This helps to indicate ‘‘what to listen for.’’
As described in the Introduction section, similar tests of binaural TFS sensitivity have been used in previous studies (Grose & Mamo, 2010; Neher et al., 2011; Ross et al., 2007; Santurette & Dau, 2012; Thorup et al., 2016). However, little or no data were provided about practice effects or about the variability across runs. Grose and Mamo (2010) and Neher et al. (2011) used a presentation method that was similar to the one used for the TFS-AF test. They used 100% amplitude-modulated pure tones with four modulation cycles within each inter-val. In one interval, the IPD ‘‘flipped’’ in value between 0 and 180 in successive modulation cycles, while in the
other two intervals, the IPD was always 0. The task was
to identify the interval in which the IPD flipped. Neher et al. (2011) reported a high test–retest correlation of .89, but this does not rule out the possibility that perform-ance improved consistently in their listeners between Run 1 and Run 2. The total duration of a trial (7 s) for the method used by Neher et al. was longer than for the TFS-AF test (4.3 s). The stimuli used by Grose and Mamo (2010) were shorter (0.8 s per interval, 2.4 s for the three intervals, interstimulus interval not specified), but they used a 5-Hz modulation rate, as opposed to the 2-Hz rate used by Neher et al.; the faster rate might make the task more difficult (Blauert, 1972). As far as we are aware, the TFS-LF and TFS-AF tests are the only tests of binaural TFS sensitivity for which data on practice effects are available.
The TFS-AF procedure led to unrealistically high thresholds on about 3% of individual runs. In principle, the incidence of such high thresholds could be reduced by using a 3-up, 1-down procedure (tracking 79.4% correct) instead of a 2-up, 1-down procedure (tracking 70.7%) or by using three intervals instead of two, but both of these would require an increase in the total time required to achieve a fixed number of reversals.
One run of the TFS-AF test took, on average, about 5 min. We consider next how many runs would be required for 95% of the mean threshold estimates across those runs to fall within a factor of 1.3 of the ‘‘true’’ value (i.e., within 0.77 to 1.3 times the true value). For the log values, this corresponds to a range of 0.114 about the mean, since log10(1.3)¼0.114. We
based the analysis on the data for the ONH listeners because these are more representative of the population encountered in the clinic, and we assumed that the true values of the mean and theSDfor each listener could be estimated with negligible error from the 15 estimates obtained. We denote the mean and SD of the log values across the 15 estimates as mean15and SD15. The
average value of SD15across the 13 ONH listeners was
0.096. For a subset of n threshold runs, the standard error (SE) of the mean is SD15= ffiffiffin
p
. We would expect 95% of estimates based on n threshold runs to fall within the range mean152SE. Hence, we can estimate
the required number of runs as (2SD15/0.114)2¼2.8. To
the nearest whole number, this means that three runs would be needed to attain the desired degree of accuracy. This would require about 18 min including breaks, which would be somewhat too long for application in clinical practice, if each run was started ‘‘manually’’ by the clin-ician. However, it would be perfectly possible to set up a fully automated system, in which the three runs for the TFS-AF test, together with any other desired test, were run automatically with suitable breaks programmed into the software. The clinician would then merely have to collect the results at the end of testing.
We consider next the possible applications of the TFS-AF test in the clinic. If a listener shows relatively poor performance on the test, this would be expected to be associated with a reduced ability to segregate sounds based on binaural TFS information (Neher et al., 2011, 2012). Such a listener might be a candidate for hearing aids that make use of information from IPDs at low frequencies to enhance interaural level differences (ILDs), as described by Moore, Kolarik, Stone, and Lee (2016). This can lead to improved localization of speech and might improve the ability to understand speech in the presence of competing talkers, although the latter has not yet been assessed. Another possibility for listeners with poor binaural TFS sensitivity is to use
binaural beamforming hearing aids, which can selectively amplify sounds from a specific direction, but at the expense of discarding IPD and ILD cues (Launer, Zakis, & Moore, 2016). The loss of IPD cues would not be a major disadvantage for a listener who already has poor sensitivity to such cues. However, a listener with good sensitivity to IPD cues might suffer more from the loss of IPD cues, so binaural beamforming might be less appropriate for such a listener (Neher, Wagener, & Latzel, 2017).
The results provided some evidence for a link between TFS-AF thresholds and audiometric thresholds at low frequencies. For the two older groups combined, the Spearman correlation between TFS-AF thresholds and audiometric thresholds averaged over the range 125 to 1000 Hz was weak to moderate (.44). The correlation is of a similar magnitude to those reported King et al. (2014) and Moore and Sek (2016b). Thorup et al. (2016) did not find a significant correlation between binaural TFS sensi-tivity and audiometric thresholds at low frequencies, but the range of low-frequency audiometric thresholds in their study was relatively small, which may have limited the ability to find a correlation. Overall, it appears that there is a link between binaural TFS sensitivity and audio-metric thresholds at low frequencies, but the effect of hearing loss is small relative to the effect of age, at least for hearing losses in the mild-to-moderate range.
So far, our evaluations of the TFS-AF test have focused on listeners with reasonably symmetric hearing. It would be useful in future studies to assess how well the test works for people with asymmetric losses. Neher (2017) measured BMLDs for listeners with both symmet-ric and asymmetsymmet-ric hearing loss at low frequencies and found no significant effect of asymmetry, suggesting that binaural TFS processing was still possible for the asym-metric group. If so, then we would expect the TFS-AF test also to be applicable to listeners with asymmetric hearing loss. However, this remains to be assessed.
Conclusions
The TFS-AF test gives a graded measure of binaural sensitivity to TFS for listeners with a wide range of ages, including listeners with mild-to-moderate hearing loss. There are no effects of practice for the TFS-AF test, making the test suitable for application in the clinic or in large-scale research studies. The choice of the fixed value of the IPD does not appear to be critical, but a value of 180 is recommended to make the task easy at the start
of an adaptive run.
also declines with increasing low-frequency hearing loss. The effect of age seems to be greater than the effect of hearing loss. There are large individual differences in binaural TFS sensitivity for individuals with similar ages and with similar audiometric thresholds, especially among older listeners.
Acknowledgments
We thank Dr. Marina Salorio-Corbetto for helping with data collection for some of the OHI listeners. We also thank three anonymous reviewers and the associate editor, Torsten Dau, for helpful comments on an earlier version of this article.
Declaration of Conflicting Interests
The authors declared no potential conflicts of interest with respect to the research, authorship, and/or publication of this article.
Funding
The authors disclosed receipt of the following financial support for the research, authorship, and/or publication of this article: This work was supported by the Medical Research Council (grant number U135097130) and the Rosetrees Trust.
References
Bernstein, J. G., Mehraei, G., Shamma, S., Gallun, F. J., Theodoroff, S. M., & Leek, M. R. (2013). Spectrotemporal modulation sensitivity as a predictor of speech intelligibility for hearing-impaired listeners. Journal of the American Academy of Audiology,24, 293–306. doi: 10.3766/jaaa.24.4.5.
Blauert, J. (1972). On the lag of lateralization caused by inter-aural time and intensity differences.Audiology,11, 265–270. British Society of Audiology. (2004). Pure tone air and bone conduction threshold audiometry with and without masking and determination of uncomfortable loudness levels. Reading, UK.
Brokx, J. P. L., & Nooteboom, S. G. (1982). Intonation and the perceptual separation of simultaneous voices. Journal of Phonetics,10, 23–36.
Brughera, A., Dunai, L., & Hartmann, W. M. (2013). Human interaural time difference thresholds for sine tones: The high-frequency limit. Journal of the Acoustical Society of America,133, 2839–2855. doi: 10.1121/1.4795778.
Burkhard, M. D., & Sachs, R. M. (1975). Anthropometric manikin for acoustic research. Journal of the Acoustical Society of America,58, 214–222.
Czaja, S. J., & Sharit, J. (1993). Age differences in the perform-ance of computer-based work. Psychology and Aging, 8, 59–67. doi: http://dx.doi.org/10.1037/0882-7974.8.1.59. Ernst, S. M. A., & Moore, B. C. J. (2012). The role of time and
place cues in the detection of frequency modulation by hear-ing-impaired listeners. Journal of the Acoustical Society of America, 131, 4722–4731. doi: http://dx.doi.org/10.1121/ 1.3699233.
Folstein, M. F., Folstein, S. E., & McHugh, P. R. (1975). Mini-mental state. A practical method for grading the cognitive
state of patients for the clinician. Journal of Psychiatric Research,12, 189–198.
Fu¨llgrabe, C. (2013). Age-dependent changes in temporal-fine-structure processing in the absence of peripheral hearing loss. American Journal of Audiology, 22, 313–315. doi:10.1044/1059-0889(2013/12-0070).
Fu¨llgrabe, C., Harland, A. J., Sek, A. P., & Moore, B. C. J. (2017). Development of a method for determining binaural sensitivity to temporal fine structure.International Journal of Audiology, 1–10. doi: http://dx.doi.org/10.1080/ 14992027.2017.1366078.
Fu¨llgrabe, C., & Moore, B. C. J. (2012). Objective and subject-ive measures of pure-tone stream segregation based on interaural time differences. Hearing Research,291, 24–33. doi: https://doi.org/10.1016/j.heares.2012.06.006.
Fu¨llgrabe, C., & Moore, B. C. J. (2014). Effects of age and hearing loss on stream segregation based on interaural time differences. Journal of the Acoustical Society of America, 136, EL185–EL191. doi: http://dx.doi.org/ 10.1121/1.4890201.
Fu¨llgrabe, C., Moore, B. C. J., & Stone, M. A. (2015). Age-group differences in speech identification despite matched audiometrically normal hearing: Contributions from audi-tory temporal processing and cognition.Frontiers in Aging Neuroscience,6, 347. doi: 10.3389/fnagi.2014.00347. Getzmann, S., Gajewski, P. D., & Falkenstein, M. (2013). Does
age increase auditory distraction? Electrophysiological cor-relates of high and low performance in seniors.
Neurobiology of Aging, 34, 1952–1962. doi: http:// dx.doi.org/10.1016/j.neurobiolaging.2013.02.014.
Grose, J. H., & Mamo, S. K. (2010). Processing of temporal fine structure as a function of age. Ear and Hearing,31, 755–760. doi: 10.1097/AUD.0b013e3181e627e7.
Hafter, E. R., & Carrier, S. C. (1970). Masking-level differences obtained with a pulsed tonal masker. Journal of the Acoustical Society of America, 47, 1041–1047. doi: http:// dx.doi.org/10.1121/1.1912003.
Hopkins, K., & Moore, B. C. J. (2010). Development of a fast method for measuring sensitivity to temporal fine structure information at low frequencies. International Journal of Audiology, 49, 940–946. doi: 10.3109/ 14992027.2010.512613.
Hopkins, K., & Moore, B. C. J. (2011). The effects of age and cochlear hearing loss on temporal fine structure sensitivity, frequency selectivity, and speech reception in noise. Journal of the Acoustical Society of America, 130, 334–349.
Hughes, J. (1940). The upper frequency limit for the binaural localization of a pure tone by phase difference.Proceedings of the Royal Society of London. Series B, Biological Sciences,
128, 293–305.
Jackson, H. M., & Moore, B. C. J. (2013). Contribution of temporal fine structure information and fundamental fre-quency separation to intelligibility in a competing-speaker paradigm.Journal of the Acoustical Society of America,133, 2421–2430. doi: http://dx.doi.org/10.1121/1.4792153. King, A., Hopkins, K., & Plack, C. J. (2014). The effects of age
Kunov, H., & Abel, S. (1981). Effects of rise/decay time on the lateralization of interaurally delayed 1-kHz tones.Journal of the Acoustical Society of America,69, 769–773. doi: http:// doi.org/10.1121/1.385577.
Launer, S., Zakis, J. A., & Moore, B. C. J. (2016). Hearing aid signal processing. In G. R. Popelka, B. C. J. Moore, A. N. Popper, & R. R. Fay (Eds.),Hearing aids(pp. 93–130). New York, NY: Springer.
Le´ger, A. C., Moore, B. C. J., & Lorenzi, C. (2012). Abnormal speech processing in frequency regions where absolute thresholds are normal for listeners with high-frequency hearing loss. Hearing Research,294, 95–103. doi: 10.1016/ j.heares.2012.10.002.
Leiva, A., Andre´s, P., & Parmentier, F. B. (2015). When aging does not increase distraction: Evidence from pure auditory and visual oddball tasks. Journal of Experimental Psychology: Human Perception and Performance, 41, 1612–1622. doi: http://dx.doi.org/10.1037/xhp0000112. Levitt, H. (1971). Transformed up-down methods in
psycho-acoustics. Journal of the Acoustical Society of America,49, 467–477. doi: http://doi.org/10.1121/1.1912375.
Lo00
csei, G., Pedersen, J. H., Laugesen, S., Santurette, S., Dau, T., & MacDonald, E. N. (2016). Temporal fine-structure coding and lateralized speech perception in normal-hearing and hearing-impaired listeners. Trends in Hearing, 20, 2331216516660962. doi: 10.1177/2331216516660962. Lopez-Poveda, E. A., Johannesen, P. T., Perez-Gonzalez, P.,
Blanco, J. L., Kalluri, S., & Edwards B. (2017). Predictors of hearing-aid outcomes.Trends in Hearing,21, 1–28. Mao, J., Koch, K. J., Doherty, K. A., & Carney, L. H. (2015).
Cues for diotic and dichotic detection of a 500-Hz tone in noise vary with hearing loss.Journal of the Association for Research in Otolaryngology, 16, 507–521. doi: 10.1007/ s10162-015-0518-8.
Moore, B. C. J. (2014). Auditory processing of temporal fine structure: Effects of age and hearing loss. Singapore: World Scientific.
Moore, B. C. J., & Glasberg, B. R. (2007). Modeling binaural loudness.Journal of the Acoustical Society of America,121, 1604–1612. doi: http://dx.doi.org/10.1121/1.2431331. Moore, B. C. J., Glasberg, B. R., Stoev, M., Fu¨llgrabe, C., &
Hopkins, K. (2012a). The influence of age and high-fre-quency hearing loss on sensitivity to temporal fine structure at low frequencies (L). Journal of the Acoustical Society of America, 131, 1003–1006. doi: http://doi.org/10.1121/ 1.3672808.
Moore, B. C. J., Kolarik, A., Stone, M. A., & Lee, Y.-W. (2016). Evaluation of a method for enhancing interaural level differences at low frequencies. Journal of the Acoustical Society of America,140, 2817–2828. doi: http:// doi.org/10.1121/1.4965299.
Moore, B. C. J., & Sek, A. (2009). Development of a fast method for determining sensitivity to temporal fine struc-ture. International Journal of Audiology,48, 161–171. doi: http://dx.doi.org/10.1080/14992020802475235.
Moore, B. C. J., & Sek, A. (2016a). Preferences for compression speed in hearing aids for speech and music and its relation-ship to sensitivity to temporal fine structure. In T. Dau, J. C. Dalsgaard, L. Tranebjærg, et al. (Eds.),Individual hearing loss – Characterization, modelling, compensation strategies
(pp. 229–236). Ballerup, Denmark: The Danavox Jubilee Foundation.
Moore, B. C. J., & Sek, A. (2016b). Preferred compression speed for speech and music and its relationship to sensitivity to temporal fine structure. Trends in Hearing, 20, 2331216516640486. doi: 10.1177/2331216516640486. Moore, B. C. J., Vickers, D. A., & Mehta, A. (2012b). The
effects of age on temporal fine structure sensitivity in mon-aural and binmon-aural conditions. International Journal of Audiology, 51, 715–721. doi: http://dx.doi.org/10.3109/ 14992027.2012.690079.
Mossop, J. E., & Culling, J. F. (1998). Lateralization of large interaural delays. Journal of the Acoustical Society of America, 104, 1574–1579. doi: http://doi.org/10.1121/ 1.424369.
Neher, T. (2017). Characterizing the binaural contribution to speech-in-noise reception in elderly hearing-impaired lis-teners. Journal of the Acoustical Society of America, 141, EL159–EL163. doi: http://doi.org/10.1121/1.4976327. Neher, T., Laugesen, S., Jensen, N. S., & Kragelund, L. (2011).
Can basic auditory and cognitive measures predict hearing-impaired listeners’ localization and spatial speech recogni-tion abilities?Journal of the Acoustical Society of America,
130, 1542–1558. doi: http://dx.doi.org/10.1121/1.3608122. Neher, T., Lunner, T., Hopkins, K., & Moore, B. C. J. (2012).
Binaural temporal fine structure sensitivity, cognitive func-tion, and spatial speech recognition of hearing-impaired lis-teners (L).Journal of the Acoustical Society of America,131, 2561–2564. doi: 10.1121/1.3689850.
Neher, T., Wagener, K. C., & Latzel, M. (2017). Speech recep-tion with different bilateral direcrecep-tional processing schemes: Influence of binaural hearing, audiometric asymmetry, and acoustic scenario. Hearing Research, 353, 36–48. doi: 10.1016/j.heares.2017.07.014.
Oberfeld, D., & Klo¨ckner-Nowotny, F. (2016). Individual dif-ferences in selective attention predict speech identification at a cocktail party. Elife, 5, e16747. doi: 10.7554/ eLife.16747.
Patterson, R. D., Nimmo-Smith, I., Weber, D. L., & Milroy, R. (1982). The deterioration of hearing with age: Frequency selectivity, the critical ratio, the audiogram, and speech threshold.Journal of the Acoustical Society of America,72, 1788–1803. doi: http://dx.doi.org/10.1121/1.388652. Perez, E., McCormack, A., & Edmonds, B. A. (2014).
Sensitivity to temporal fine structure and hearing-aid out-comes in older adults.Frontiers in Neuroscience,8, 7. doi: https://doi.org/10.3389/fnins.2014.00007.
Rayleigh, L. (1907). On our perception of sound direction.
Philosophical Magazine, 13, 214–232. doi: http:// dx.doi.org/10.1080/14786440709463595.
Ro¨nnberg, J., Lunner, T., Ng, E. H., Lidestam, B., Zekveld, A. A., So¨rqvist, P.,. . .Stenfelt, S. (2016). Hearing impairment, cognition and speech understanding: Exploratory factor analyses of a comprehensive test battery for a group of hearing aid users, the n200 study.International Journal of Audiology, 55, 623–642. doi: http://dx.doi.org/10.1080/ 14992027.2016.1219775.
phase. Journal of Neuroscience, 27, 11172–11178. doi: https://doi.org/10.1523/JNEUROSCI.1813-07.2007. Ruggles, D., Bharadwaj, H., & Shinn-Cunningham, B. G.
(2011). Normal hearing is not enough to guarantee robust encoding of suprathreshold features important in everyday communication. Proceedings of the National Academy of Sciences USA, 108, 15516–15521. doi: 10.1073/ pnas.1108912108.
Santurette, S., & Dau, T. (2012). Relating binaural pitch per-ception to the individual listener’s auditory profile.Journal of the Acoustical Society of America,131, 2968–2986. doi: http://dx.doi.org/10.1121/1.3689554.
Sharma, M., Dhamani, I., Leung, J., & Carlile, S. (2014). Attention, memory, and auditory processing in 10- to 15-year-old children with listening difficulties. Journal of Speech, Language, and Hearing Research, 57, 2308–2321. doi: 10.1044/2014_JSLHR-H-13-0226.
Sheft, S., Risley, R., & Shafiro, V. (2012). Clinical measures of static and dynamic spectral-pattern discrimination in rela-tionship to speech perception. In T. Dau, M. L. Jepsen & T. Poulsen, et al. (Eds),Speech perception and auditory dis-orders (pp. 481–488). Ballerup, Denmark: The Danavox Jubilee Foundation.
Smoski, W. J., & Trahiotis, C. (1986). Discrimination of interaural temporal disparities by normal-hearing listeners and listeners with high-frequency sensorineural hearing loss. Journal of the Acoustical Society of America,
79, 1541–1547. doi: http://dx.doi.org/10.1121/1.393680. Stone, M. A., Moore, B. C. J., & Fu¨llgrabe, C. (2011). The
dynamic range of useful temporal fine structure cues for
speech in the presence of a competing talker. Journal of the Acoustical Society of America, 130, 2162–2172. doi: http://dx.doi.org/10.1121/1.3625237.
Strelcyk, O., & Dau, T. (2009). Relations between frequency selectivity, temporal fine-structure processing, and speech reception in impaired hearing. Journal of the Acoustical Society of America,125, 3328–3345. doi: http://dx.doi.org/ 10.1121/1.3097469.
Thorup, N., Santurette, S., Jørgensen, S., Kjærbøl, E., Dau, T., & Friis, M. (2016). Auditory profiling and hearing-aid sat-isfaction in hearing-aid candidates.Danish Medical Journal,
63, A5275.
Van Tasell, D. J., Soli, S. D., Kirby, V. M., & Widin, G. P. (1987). Speech waveform envelope cues for consonant rec-ognition.Journal of the Acoustical Society of America,82, 1152–1161. doi: http://doi.org/10.1121/1.395251.
Whitmer, W. M., Seeber, B. U., & Akeroyd, M. A. (2014). The perception of apparent auditory source width in hearing-impaired adults. Journal of the Acoustical Society of America, 135, 3548–3559. doi: http://doi.org/10.1121/ 1.4875575.
Wilson, B. S., Finley, C. C., Lawson, D. T., Wolford, R. D., Eddington, D. K., & Rabinowitz, W. M. (1991). Better speech recognition with cochlear implants. Nature, 352, 236–238. doi:10.1038/352236a0.