Running head:
Detecting others’ trait levels
Judging personality from a brief sample of behavior:
Detecting where others stand on trait continua
Wenjie Wu1, Elizabeth Sheppard2and Peter Mitchell2
1School of Education, Lingnan Normal University, Zhanjiang, China 2School of Psychology, University of Nottingham, UK
Word count: 11004 (excluding title page, abstract, references, figure captions, tables
and figures)
Author note: Correspondence should be addressed to Wenjie Wu, School of Education,
Lingnan Normal University, Cunjin Road No. 29, Chikan District, Zhanjiang 524048.
Email: jie.w.wu@hotmail.com. Studies 1 and 2 were done at the University of Nottingham Malaysia campus for the first author’s PhD. The authors declare that there
are no potential conflicts of interest with respect to the research, authorship, and
Abstract
Trait inferences occur routinely and rapidly during social interaction, sometimes
based on scant or fleeting information. In this research, participants (perceivers) made
inferences of targets’ big-five traits after briefly watching or listening to an unfamiliar
target (a third party) performing various mundane activities (telling a scripted joke or
answering questions about him/herself or reading aloud a paragraph of promotional
material). Across three studies, when perceivers judged targets to be either low or
high in one or more dimensions of the big-five traits they tended to be correct, but
they did not tend to be correct when they judged targets as average. Such inferences
seemed to vary in effectiveness across different trait dimensions and depending on
whether the target’s behavior was presented either in a video with audio, a silent
video or just in an audio track – perceivers generally were less often correct when
they judged targets as average in each of the big-five traits across various information
channels (videos with audio, silent videos and audios). Study 3 replicated these
findings in a different culture. We conclude with discussion of the scope and the
adaptive value of this trait inferential ability.
Key Words: trait inferences, big-five traits, zero-acquaintance, thin slices of
Judging personality from a brief sample of behavior:
Detecting where others stand on trait continua
Trait inferences occur routinely and rapidly during social interaction (Todorov &
Uleman, 2002, 2003, 2004; Uleman & Saribay, 2012, for a review), sometimes based
on scant or ephemeral information (Ambady, Bernieri, & Richeson, 2000), such as a
fleeting facial expression (Willis & Todorov, 2006), a quick gait (Thoresen, Vuong, &
Atkinson, 2012), a voice offering a greeting (McAleer, Todorov, & Belin, 2014) and a
short get-acquainted conversation (Carney, Colvin, & Hall, 2007). Being able to infer
aspects of a person’s character, or traits, is adaptive in that it influences the way we
select, shape and maintain our social environments (Back & Nestler, 2016), allowing
us to decide who will be only nodding acquaintances and who may be enduring
friends.
Research has already investigated whether or not various traits are perceptible
(e.g., Albright, Kenny, & Malloy, 1988; Back & Nestler, 2016; Borkenau & Liebler,
1992, 1993; Borkenau, Mauer, Riemann, Spinath, & Angleitner, 2004; Carney et al.,
2007; Funder, 2012; Funder, Kolar, & Blackman, 1995; Kenny, Horner, Kashy, &
Chu, 1992; McLarney-Vesotski, Bernieri, & Rempala, 2006; Thoresen, et al., 2012;
Todorov, Pakrashi, & Oosterhof, 2009), but the current research has a slightly
different purpose. Past research usually tells us that people (henceforth ‘perceivers’)
can systematically infer some aspects of personality traits; it does not tell us whether
people’s judgments differ at differing levels of a trait continuum. The aim, then, was
high, middle or lowin each dimension of the big-five traits: Do people judge
personality traits similarly at any point on the scale or do their judgments differ at
different parts of the scale?
Using the zero-acquaintance procedure, where the perceiver is asked about a
target’s psychological traits neither with acquaintance nor prior knowledge (Norman
& Goldberg, 1966; Albright et al., 1988), a large number of studies have revealed
above-chance levels of accuracy in judging some aspects of the big-five personality
dimensions (Neuroticism (N), Extraversion (E), Openness to Experience (O),
Agreeableness (A) and Conscientiousness (C)) in a wide variety of contexts (Back &
Nestler, 2016) ranging from physical appearance (Naumann, Vazire, Rentfrow, &
Gosling, 2009) to short samples of behavior (e.g., Borkenau et al., 2004; Carney et al.,
2007; Thoresen, et al., 2012). After observing ‘thin slices’ of behavior (occupying less
than five minutes, Ambady et al., 2000), sampled from mundane activities, such as
reading aloud a standard text (Borkenau & Liebler, 1992, 1993), performing an
unstructured dyadic interaction (Carney et al., 2007), singing a song or doing a
self-introduction and so forth (Borkenau et al., 2004), perceivers can draw somewhat
accurate inferences about E and C across different contexts but their performance in
inferring the other three big-five dimensions seems to be inconsistent across different
studies (e.g., Borkenau & Liebler 1992; Borkenau et al., 2004; Carney et al., 2007;
McLarney-Vesotski et al., 2006; Norman & Goldberg, 1966; Wall, Taylor, Dixon,
Conchie, & Ellis, 2013; Watson, 1989). For instance, in the study by Borkenau et al
significant agreement on the evaluation of A, whereas in another study even in a
carefully crafted trait-relevant situation, perceivers failed to make an accurate
judgment of A (McLarney-Vesotski et al., 2006). Trait O is difficult to judge in some
contexts (e.g., Borkenau & Liebler, 1992; Wall et al., 2013) but can be judged
consistently when targets performed a task of pantomime (Borkenau et al., 2004).
Although trait N is low in visibility at zero acquaintance (Connelly & Ones, 2010;
Connolly, Kavanagh, & Viswesvaran, 2007; Funder, 2012; Vazire, 2010), a recent
study (Hirschüller, Egloff, Schmukle, Nestler, & Back, 2015) suggested that strangers
were sensitive to individual differences in N as long as targets were observed in
socially stressful situations. All in all, the literature suggests that people can form
somewhat accurate first impressions on the dimensions of E and C or other traits even
on the basis of minimal observation in either trivial scenarios (e.g., Borkenau et al,
2004; Carney et al., 2007) or crafted trait-relevant situations (Hirschüller et al., 2015;
McLarney-Vesotski et al., 2006).
While performance across perceivers tends to be fairly consistent in such studies,
research yields much wider variability in the judgability of traits of different targets,
raising the question of what makes a good or ‘readable’ target. A large number of
factors have been proposed to contribute to target judgability (see Human & Biesanz,
2013, for a review) with psychological adjustment being the most consistent
predictor. Psychological adjustment may manifest as a particular configuration of Big
5 traits, including high E, high A, high C and low N, a configuration which has been
Although this strand of research implies some targets may be easier to read
overall, it does not tell us whether people differ in their judgments about people who
score low or high as opposed to those who score in the average range of each trait
individually. If the findings on target judgability hold across individual traits, this
could suggest that perceivers will often be correct when judging a target as high E,
high A, high C and low N. On the other hand, research on trait judgments for samples
that included individuals with known personality disorders, who by definition occupy
extreme positions on various personality traits, found perceivers were able to
accurately detect personality features of those disorders, implying that both extremes
of traits may be distinctive and easy to detect (Oltmanns, Friedman, Fiedler, &
Turkheimer, 2004). Moreover, a recent study (Wu et al., 2016) revealed that
perceivers tended to be correct when they judged a target as low or high empathy
(measurable with the Empathy Quotient – EQ – Baron-Cohen & Wheelwright, 2004)
but not when they judged a target as average in empathizing. Examination of the
pattern of responding reveals that perceivers tended to judge most targets as average
in empathizing, making many ‘false alarms’ in doing so; in contrast, they were
conservative but usually correct when judging targets as non-average in empathizing.
The present study aimed to explore if there is a similar pattern in people’s ability
to locate targets along the big-five personality dimensions: whether perceivers are
typically correct when they judge someone as unique on a trait but less so (due to a
high proportion of false alarms) when judging that someone is average. Adopting
the perceiver to detect each of the target’s big-five traits on three levels (high, middle
or low), allowing us to compare perceiver inferences against target self-reported traits
measureable with the big-five personality inventory. Because traits give rise to
fleeting patterns of behavior that transcend time and specific situations (Funder, 1991,
2006), we extracted ‘thin slices’ from ongoing behavior. The zero-acquaintance
procedure was used to ensure that perceivers made judgments of big-five traits on the
basis of the presented thin slices of behavior rather than any prior knowledge of the
target. Considering its wide application and putative reliability and validity (Borkenau
& Ostendorf, 1998; McCrae & John, 1992, for a review; McCrae & Costa, 2004;
McCrae, Terracciano, et al., 2005; Schmitt, Allik, McCrae, & Benet-Martínez, 2007),
this study employs the updated shortened version of the NEO Personality Inventory,
the NEO Five-Factor Inventory-3 (NEO-FFI-3: McCrae & Costa, 2004; Costa &
McCrae, 2011) to measure the targets’ five dimensions of personality traits.
Study 1
Method
Three sets of video clips (with audio) were derived from a previous study (Wu, et
al., 2016), with 47 clips in each set in which targets were recorded during a
conversation, reading a joke or doing a screen test. We adopted a 5 × 3 × 3 mixed
design, with the big-five traits and the three levels of each trait (low, average, and
high) as the within-subjects factors and the three scenarios (Conversation, Joke, and
needed to infer which level (low, average or high) on each of the big-five traits the
target belonged to.
Participants
Ninety students (serving as perceivers) aged 18-25 years (45 males,M= 20
years) were recruited from the University of Nottingham Malaysia campus. The
sample size was determined according to our previous research (Wu et al., 2016). The
perceivers were asked to identify whether they had met any of the targets after
viewing pictures of them (taken from their videos) and those who responded
positively were replaced. Each perceiver was randomly assigned to watch the targets
either in the Conversation, in the Joke or in the Screen Test Scenario.
Materials
Video stimuli collection and editing
A Sony Handycam DCR-SR60 video camera filmed 47 targets (24 males, aged
18-32 years,M= 21 years) recruited from the University of Nottingham Malaysia
campus, all of whom responded to a call to do a screen test advertising the university.
On arrival, targets were issued with a script of the joke and the screen test. All were
individually videoed in a quiet laboratory with the camera mounted on a tripod placed
approximately 1.2 m away to record the target’s face and the top part of their body.
The researcher sat opposite but out of view of the camera. Unknown to the target, the
camera automatically began recording as soon as they entered the room.
(Subsequently, all targets were fully debriefed and gave written informed consent to
Once inside the laboratory, after the target read some information (including an
information sheet, a script of the joke, a script of the screen test and a consent form),
the researcher began with a brief conversation in which she asked a series of questions
(and wrote down the responses) about the target’s name, age, what course they were
enrolled on, where they were from and so on. The conversation lasted approximately
two minutes. The camera was then ostensibly switched to ‘record mode’ (note that it
was already in record mode) and the target was invited to read out the joke to the camera.
After a pause of about one minute the target was then invited to read aloud a verbatim
script of the screen test:
“At the University of Nottingham we are committed to providing a truly
international education, inspiring our students, producing world-leading research and
benefitting the communities around our campuses in the UK, China and Malaysia. Our
purpose is to improve life for individuals and societies worldwide. By bold innovation
and excellence in all that we do, we make both knowledge and discoveries matter.”
These three scenarios in which behavior was sampled were based upon those
used in previous research on personality judgment demonstrating self-other agreement
(e.g. Borkenau & Liebler, 1992). We aimed to gain samples of both highly
constrained behavior under known surveillance (joke and screen test) and less
constrained behavior with covert video recording (conversation). Inclusion of three
behavioral samples from each participant enabled us to determine the extent to which
perceivers’ judgments about a particular target were consistent across samples.
After recording and a short break for several minutes, each target completed the
NEO-FFI-3, which is an updated and revised shortened version of the self-report form
of the NEO Personality Inventory-3 (NEO-PI-R-3), with 12-item scales to measure
each of the five personality factors, N, E, O, A, and C (McCrae & Costa, 2004). The
task took about 12 minutes and responses were collected on 5-point Likert scales
ranging from strongly disagree to strongly agree.
We have definedTscores within one standard deviation either side of the
population mean as average, and scores above or below one standard deviation each
side of the population mean as high or low respectively. In other words,Tscores of 61
or higher are considered high,Tscores ranging from 40 to 60 are considered average,
andTscores lower than 40 are considered low in each of the five trait domains. The
targets’ self-report ratings were thus classified into three levels of low, average or
high: Eight (6 males), 26 (13 males) and 13 (5 males) targets respectively scored low,
average and high on N; 11 (5 males), 26 (12 males) and 10 (7 males) were
respectively low, average and high on E; 7 (6 males), 27 (13 males), and 13 (5 males)
were low, average and high on O; 10 (7 males), 31 (14 males) and 6 (3 males) scored
low, average and high on A; 14 (5 males), 24 (14 males) and 9 (5 males) were low,
average and high on C (see Supplementary Materials S1 for analyses using a different
criterion for defining the trait levels).
Three separate video clips were made for each target. In the Joke and the Screen
Test Scenario, each clip began when the target started the task and ended about two
video clips was 30.87 s (SD= 2.56; ranging from 24 s to 35 s) for the Conversation,
8.94s (SD= 1.36; ranging from 7 s to 12 s) for the Joke and 29.36 s for the Screen
Test (SD= 4.48; ranging from 22 s to 42 s). Because the raw filming of the
Conversation actually lasted around two minutes, we extracted 30-second clips from
either the beginning (15 targets selected at random), the middle (16 targets selected at
random) or the end (16 targets selected at random).
Procedure
Perceivers were tested individually. After receiving the instruction sheet and
offering consent, the perceiver was given a personality information sheet that includes
a brief definition of personality along with concise explanations of each personality
trait in line with the description in the NEO manual (Costa & McCrae, 2011):
“Personality traits are a person’s characteristic patterns of thought, emotion and
behavior that are relatively consistent over time and across situations (Funder, 2006);
in other words, personality traits describe what a person is like. The following five
factors are widely used to depict a person’s basic personality traits.
Neuroticism: The tendency to experience unpleasant emotions easily, such as
anxiety, depression, self-consciousness, impulsiveness and vulnerability.
Extraversion: Warm, assertive (confident), active, sociable, excitement-seeking, and
the tendency to experience positive emotions. Openness to Experience (Openness):
Appreciation for art (and beauty), feelings and emotions, curiosity, unusual ideas, and
variety of experience. Agreeableness: A tendency to be straightforward, altruistic
tendency to show self-discipline, act dutifully, and aim for achievement; planned
rather than spontaneous behavior; organized, and dependable.”
After reading the personality information sheet, the perceiver proceeded to the
trials of inferring the target’s big-five traits. Each video clip was displayed (600 × 400
pixels) to the perceiver in full color with audio in random order with the software
PsychoPy (Peirce, 2007) on a laptop. Following each target video, a response screen
appeared showing five 3-point scales (low, average & high) as response options
corresponding to the five traits of N, E, O, A, and C in fixed order. The perceiver used
the mouse to click on one of three levels for each of the five traits for each target.
After the perceiver made judgments for all five traits, the screen moved immediately
to the next video clip. PsychoPy was programmed to allow perceivers to take as long
as they needed to respond. Responses were automatically recorded by the software for
later retrieval.
Results and discussion
Preliminary analyses
Three separate groups of perceivers rated the big-five traits of each of the 47
targets – one group rated the targets in conversation with the experimenter, another
rated the targets as they told a joke and another rated the targets as they performed a
screen test. Thus, each target had three mean ratings of scores for each of the five
traits from perceivers who watched the target in a conversation, perceivers who
watched the target tell a joke and perceivers who watched the target do a screen test.
The intercorrelations between these three sets of ratings were high in each of the
their inferences (see below), at least it seems that samples of target behavior across
three scenarios led to rather consistent ratings of the big-five traits by the perceivers.
Table 1 about here
Two scores of each trait were coded for each target: their self-rated score of each
trait (N:M= 2.11,SD= .67; E:M= 1.98,SD= .68; O:M= 2.13,SD= 65; A:M=
1.91,SD= .58; C:M= 1.89,SD= .70) and their mean score as estimated by 90
perceivers (combined across three scenarios) for each trait (N:M= 1.68,SD= .24; E:
M= 2.00,SD= .36; O:M= 1.98,SD= .31; A:M= 2.12,SD= .22; C:M= 2.07,SD
= .28). There was a significant correlation between target self-ratings and perceiver
ratings for Trait E:r= .32,p= .031, but there were non-significant associations
between target self-ratings and perceiver ratings for the other traits. This is only
partially informative because it tells us nothing about whether big-five traits were
judged differently at different levels of the scale. To illuminate such a matter, a
different kind of analysis was adopted as explained below.
Main analysis – Perceiver accuracy in detecting targets at three different levels of
each trait
Any perceiver who judged the same category over 80% of the time across the five
traits was removed from the following analyses in case such individuals were
repeatedly picking the same category in order to complete the experiment rapidly,
rather than making considered judgments. One male perceiver observing the Joke
Inspection of the data revealed that base rates in perceivers’ judgments varied
widely across the targets’ three levels of each ‘Big 5’ trait. As shown in Table 2, it
was common for perceivers to judge that targets were in the middle level but less
common for them to judge that targets were in the two extreme levels in each
condition. Because perceivers frequently judged targets to be in the middle level, in
absolute terms ‘correct’ judgments were fairly common but this high frequency of
correct judgments is at the cost of high frequency in false alarms.
Table 2 about here
Given that signal detection theory (SDT) allows an assessment of accuracy and
sensitivity that is immune to response bias (the tendency to select one category more
frequently than another; Macmillan, 2002; Macmillan & Creelman, 2005; Stanislaw
& Todorov, 1999), it is widely applied to measure performance across various tasks,
including those that employ multi-way forced choice procedures (Macmillan, 2002;
Macmillan &Creelman, 2005), as illustrated in the following examples: SDT has been
used to examine accuracy in empathy judgments (Wu et al., 2016) and mental state
inferences (Pillai et al., 2012, 2014), eyewitness’s identification of suspects (Clark,
2012), perceptual judgments (Kang, Anthoney & Mitchell, 2017), diagnostic
decisions more generally (Swets, Dawes, & Monahan, 2000) and optimal decision
making (Lynn & Barrett, 2014). We thus adopted SDT to compute participant
accuracy (sensitivity) in detecting targets’ trait levels.
According to the published guidelines on calculating SDT (Macmillan, 2002;
particular level of each trait counted as a ‘hit’ while an incorrect judgment that a
target belonged to the same trait level counted as a false alarm. Performance of
participants across the different trait levels over a total of 47 trials was characterised
as single values for each perceiver in the form of d-prime (d’) for assessing perceiver
accuracy in judging each trait level. Following Macmillan and Creelman (2005),
where the perceiver either made no hits or no false alarms for a particular trait level,
or where the number hits or false alarms was the maximum it could be for a trait level,
these values were adjusted before calculating the hit rate and false alarm rate. Where
the number of hits (or false alarms) was 0, 0.5 was added and the hit rate (or false
alarm rate) was then calculated; where the participant made the maximum number of
hits or false alarms for a given trait level, 0.5 was subtracted from the number of hits
or false alarms prior to calculating the hit rate or false alarm rate. d’ was then
calculated by subtracting the z-score of the false alarm rate from the z-score of the hit
rate (d’ = Z (hit rate) – Z (false alarm rate), where function Z (p), 0 ≤ p ≤1). In
addition, according to SDT outlined by Macmillan and Creelman (2005), we represent
the base-rate as the ‘criterion’ (c) for choosing any particular response category with
the statistic c: the more negative the value of c, the more perceivers were in favour of
choosing this particular category (e.g. a category of average E), irrespective of
whether correct; but when c is more positive, it implies perceivers were against
choosing the particular category (e.g. high or low E), meaning that they were
conservative in this case. Criterion c was calculated by -0.5 x (Z (false alarm rate) + Z
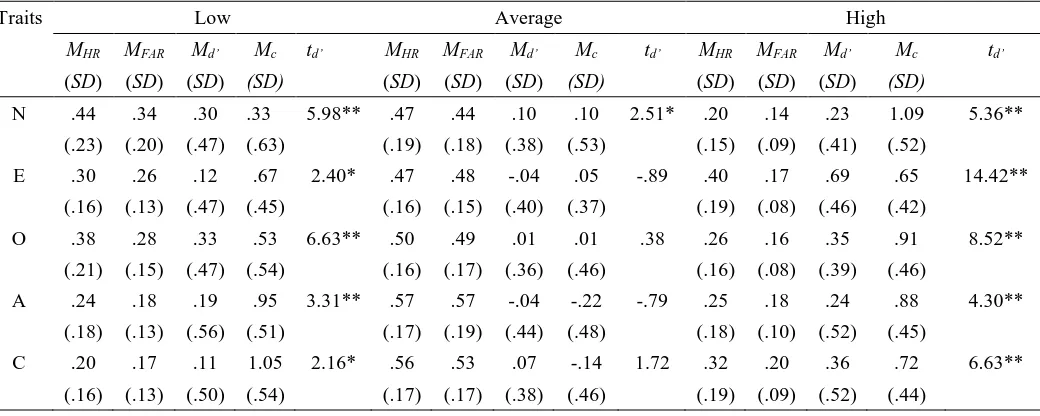
Table 3 shows the means of hit rate (MHR), false alarm rate (MFAR), d-prime (Md’)
and criterion (Mc) in each level in each trait across the three scenarios combined,
along with thetvalues of one-samplettests of eachMd’. As demonstrated in Table 3,
the hit rates for the middle level of each trait were usually relatively high but the false
alarm rates were also rather high; by contrast, in spite of relatively low hit rates for
the two extreme levels, the corresponding false alarm rates were quite small. As a
result, the d’ (the index of perceiver sensitivity of detecting target traits), which was
computed by comparing the proportion of hits against the proportion of false alarms,
was low in the average trait level but high in the extremes. In other words, perceivers
tended to judge the target was in the middle of the trait continuum though in many
cases they were incorrect to do so when the target was actually located at the
extremes; perceivers were less likely to judge the target was at the two extremes of
the continuum but when they did so their judgments were frequently correct.
These results were confirmed by the one-samplettests ofMd’where the
comparison value is zero: If perceivers were insensitive to when a target is in a
particular trait level, this would yield anMd’of zero for that level of the trait.
According to thetvalues displayed in Table 3, perceivers were not uniform in their
judgments about big-five traits: When perceivers stated that a target was in the low
and high levels, they tended to be correct (indicated byMd’well above zero) while in
all cases (except for N) when they judged targets to be in the middle level of each trait
they were often incorrect. Figure 1 demonstrates five similar trends associated with
Table 3 & Figure 1 about here
To examine perceivers’ judgments of target trait levels, a 5 (traits) × 3 (levels of
each trait) × 3 (scenarios) mixed design ANOVA was computed, with the 3 scenarios
as the between-subjects factor, and the 5 traits and the 3 levels of each trait as the
within-subjects factors; the dependent variable was the mean d’. Effect sizes are
reported as Cohen’sf, where .10, .25 and .40 respectively represent small, medium
and large effect sizes (Cohen, 1988). A main effect was associated with the three trait
levels (F(2, 172) = 99.85,p< .001, Cohen’sf= 1.06), but there were no main effects
associated with the five traits and the three scenarios. The interactions between Trait
Level and Scenario (F(4, 172) = 4.22,p= .003, Cohen’sf= .21), between Trait and
Level (F(8, 688) = 12.59,p< .001, Cohen’sf= .38), and an interaction among Trait,
Level and Scenario (F(16, 688) = 2.67,p= .003, Cohen’sf= .17) were significant,
but there was no interaction between Trait and Scenario.
To examine whether or not perceivers were more likely to be correct when they
judged that targets were located in the two extreme levels of each trait than when they
judged that targets were located in the middle level (shown in the results of
one-samplettests in Table 3 and demonstrated in Figure 1), we conducted a repeated
measures ANOVA for each trait across the three scenarios combined, with the three
trait levels as the within-subjects factor. The results showed thatMd’among the three
levels of each trait were significantly different in all cases (N:F(2, 176) = 6.67,p
= .002, Cohen’sf= .27; E:F(2, 176) = 94.78,p< .001, Cohen’sf= 1.03; O:F(2,
= .35; C:F(2, 176) = 13.16,p< .001, Cohen’sf= .38).Post hocBonferroni-adjusted
tests for each trait revealed the following results. For the trait N, perceivers were less
often correct when judging targets as average N than when judging targets as either
low N (p< .001) or high N (p= .048), but there was no difference when they judged
cases as low and high N. For the trait E, perceivers were more often correct when they
judged a target as high in E than when they judged targets to fall into either low E or
average E (ps< .001), and they also were more often correct when they judged targets
as low E than when they judged targets as average E (p= .009). For the trait O,
perceivers were often correct when they judged targets to be either low or high O, but
they were less often correct when they judged a target as average O (ps< .001). For
the trait A, perceivers were more often correct when they judged a target to be either
low or high in A than when they judged targets to be average A (ps< .001), but were
equally often correct when they judged a target to be low or high A. For the trait C,
perceivers were more often correct when they judged targets as being high C in
comparison with when they judged a target as low (p= .005) or average C (p< .001),
and performance was no different when they judged a target as low or average C.
To examine whether the criterion differed for judging targets as low, average and
high, a 5 (traits) × 3 (levels of each trait) × 3 (scenarios) mixed design ANOVA was
computed, with the 3 scenarios as the between-subjects factor, and the 5 traits and the
3 levels of each trait as the within-subjects factors; the dependent variable was the
mean c. There was a main effect of trait,F(4, 344) = 18.03,p< .001, Cohen’sf= .46,
effect of scenario,F(2, 86) = 3.21,p= .045, Cohen’sf= .27. The interactions
between Trait and Scenario (F(8, 344) = 2.12,p= .041 (Greenhouse-Geisser
corrected), Cohen’sf= .22), between Trait and Level (F(8, 688) = 25.98,p< .001,
Cohen’sf= .55), and an interaction among Trait, Level and Scenario (F(16, 688) =
3.13,p< .001, Cohen’sf= .27) were significant, but there was no interaction between
Trait Level and Scenario.
To examine whether or not perceivers differed in the criterion they adopted for
the two extreme levels of each trait than for the middle level (as shown in Table 3),
we conducted a repeated measures ANOVA for each trait across the three scenarios
combined, with the three trait levels as the within-subjects factor. The results showed
thatMcamong the three levels of each trait were significantly different in all cases (N:
F(2, 176) = 51.45,p< .001, Cohen’sf= .76; E:F(2, 176) = 44.91,p< .001, Cohen’s
f= .71; O:F(2, 176) = 53.40,p< .001, Cohen’sf= .78; A:F(2, 176) = 114.52,p
< .001, Cohen’sf= 1.14; C:F(2, 176) = 99.65,p< .001, Cohen’sf= 1.06).Post hoc
Bonferroni-adjusted tests for each trait revealed the following results. For the trait N,
perceivers were more conservative when judging targets as high N than when judging
targets as either low N or average N (ps< .001), but were equally conservative when
they judged cases as low N and average N. For the trait E, perceivers were more
conservative in judging a target as high or low E than average E (ps< .001), but were
equally conservative in judging targets as low and high E. For the trait O, perceivers
were more conservative in judging targets as high O than average or low O (ps
O (p< .001). For the trait A, perceivers were more conservative when judging a target
as low or high in A than as average A (ps< .001), but were equally conservative in
judging a target to be low or high A. For the trait C, perceivers were more
conservative in judging targets as low C in comparison with high or average C (ps
< .001), and they were also more conservative in judging targets as high C than
judging them as average (p< .001). See Supplementary Materials (S2) for analysis
using an alternative way of operationalising criterion.
Is it possible that the trends of perceivers’ performance in detecting targets with
different levels of traits shown in Figure 1 are an artifact of a ‘range effect’? The
dependent variable d’ represented the z-score for the proportion of hits (for example
that judging the target was in the category of low N and he/she was truly located on low
N) minus the z-score for the proportion of false alarm (such as judging that the target
was in low N when in fact he/she was in the level of average or high). For average
targets, all opportunities for false alarms arose in adjacent categories (low or high) while
for low or high targets, some opportunities for false alarms arose from an adjacent
category (average) and some from a more distal category (high or low, respectively).
Arguably a perceiver may be less likely to make a false alarm in a distal than adjacent
category for a particular target, so the inclusion of false alarms from distal categories
in the false alarm rate for d-prime calculations for targets in the high and low category
could have resulted in lower overall false alarm rates. This could artifactually lead to
the value ofMd’being lower for the middle level than for the outer levels, thus giving
that a target is located in the two extreme levels than when inferring that a target is in
the middle.
We addressed this matter by statistically adjusting the false alarm rates and then
repeating all the analyses (see the Supplementary Materials S3 for the results). The
false alarm rate of judgments on each trait level was confined to cases where correct
responses would have been the neighboring level of the same trait (or the number of
times the correct response would have been one or other of the two neighboring levels
of the trait in the average level). The same trends emerged even with these adjusted
false alarm rates (as shown in Table S3 & Figure S3). This was true not only in the
current study but also in Studies 2 and 3 reported in this article. It seems, then, that
perceivers tended to be incorrect when they judged targets as being average in each of
the big-five traits but tended to be correct when they judged a target to be extreme.
Study 2
Study 1 revealed that when perceivers identified a target as being at the end point
of each trait continuum they tended to be correct across the three scenarios from
watching videos with audio; perceivers were not systematically correct when they
identified a target as average. Given that predicting and explaining behavior is
normally done rapidly in a context of fleeting information, we also aimed to discover
how little information is sufficient for making this pattern of inferences of big-five
traits. The purpose of Study 2 was to explore the limitation in perceiver ability to
detect target personality traits. Specifically, would the principal findings reported in
silent video, and soundtrack only)? For the sake of simplicity the present study only
used the scenario of Conversation where the targets were unobtrusively filmed while
answering some questions about themselves – This scenario might evoke informative
spontaneous behaviors in the targets.
Method
Participants
Ninety students (43 males) aged 18-27 years (M= 21 years) from the Monash
University Sunway campus were recruited as perceivers. None reported acquaintance
with any of the targets. The sample size was determined according to our previous
research (Wu et al., 2016). Perceivers were randomly assigned to three groups of 30
in each condition (Video with audio, Video only, and Audio only).
Materials and Procedure
The 47 video clips in the Conversation Scenario were used with or without audio.
The 47 audio tracks were extracted from the corresponding video clips. Thus, 30
perceivers viewed 47 video clips with audio, 30 perceivers viewed the same 47 clips
without sound, and 30 perceivers listened to 47 audio tracks. The procedure was the
same as that in Study 1. After watching a video with audio or a silent video or hearing
a soundtrack, perceivers were asked to infer the big-five traits of each target.
Results and discussion
Judgmental accuracy of the big-five traits in each condition
As in Study 1, any perceiver who judged the same category over 80% of the time
video with audio condition and one female in the audio only condition were duly
excluded. Table 4 showsMHR,MFAR, andMcin each level of each trait in each
information condition, together with the corresponding values of one-samplettests of
eachMd’. As we see in Table 4 and Figures 2 – 4, perceivers seemed to demonstrate a
similar trend to Study 1 in their judgments of the big-five traits in each condition.
When they judged a target as having an average level of the trait, perceivers usually
did not perform above chance (except for the average level of trait O in the Audio
Only condition), but they tended to be correct when identifying a target as being
either low or high in one or more traits in each condition. Furthermore, this pattern of
performance seemed to be influenced by information conditions – The trends seemed
strongest in the condition of video with audio where perceivers tended to be correct
when judging extreme trait levels in more types of traits than in the other information
conditions; also, the trend appeared to be more evident in some traits, such as O, than
others, such as A, across the three conditions.
Table 4 & Figure 2-4 about here
We conducted a 5 (traits) × 3 (levels of each trait) × 3 (conditions) mixed design
ANOVA, with the five traits and the three levels of each trait as the within-subjects
factors and the three conditions as the between-subjects factor; the dependent variable
wasMd’. The results revealed main effects associated with the traits (F(4, 340) =
4.41,p= .002, Cohen’sf= .22), the trait levels (F(2, 170) = 104.93,p< .001,
Cohen’sf= 1.09), and the conditions (F(2, 85) = 4.92,p= .009, Cohen’sf= .24);
170) = 4.10,p= .003, Cohen’sf= .22), between the traits and the levels of trait (F(8,
680) = 7.08,p< .001, Cohen’sf= ..28), and an interaction among the traits, the trait
levels and the conditions (F(16, 680) = 2.54,p= .001, Cohen’sf= .17), but there was
no interaction between the traits and the conditions.
We carried outpost hocBonferroni-adjusted tests for the main effect of
condition, and found that overall perceivers performed equally well in the video with
audio condition and the audio only condition, and perceiver performance in the video
with audio condition was better than that in the video only condition (p= .008). These
data suggest that perceivers were generally more effective in inferring personality
traits with access to both visual and auditory information of the targets for thirty
seconds than when they had access only to visual information.
To examine whether there was a similar type of trend for each condition, we
carried out a 5 (traits) × 3 (trait levels) repeated measures ANOVA in each condition.
As demonstrated in Table 5, which reports the corresponding results of the ANOVA
in the three conditions, the same kind of trend emerged in each condition – there was
a main effect of trait levels and a significant interaction between the traits and the
levels but no main effect associated with the traits. Additionally, the interaction
between the traits and the trait levels was strongest in the video with audio condition.
Table 5 about here
To examine whether there were differences in criterion for judging targets as low,
average and high, a 5 (traits) × 3 (levels of each trait) × 3 (conditions) mixed design
5 traits and the 3 levels of each trait as the within-subjects factors; the dependent
variable wasMc. There was a main effect of trait (F(4, 340) = 11.15,p< .001,
Cohen’sf= .36) and a main effect of trait level (F(2, 170) = 91.58,p< .001, Cohen’s
f=1.02) but no main effect of condition. The interaction between Trait and Level (F
(8, 680) = 25.76,p< .001, Cohen’sf= .54) and an interaction among Trait, Level and
Condition (F(16, 680) = 1.74,p= .036, Cohen’sf= .14) were significant, but there
were no interactions between Trait Level and Condition, or between Trait and
Condition.
To examine whether or not perceivers differed in the criterion they adopted for
the two extreme levels of each trait than for the middle level (as shown in Table 4),
we conducted a repeated measures ANOVA for each trait across the three conditions
combined, with the three trait levels as the within-subjects factor. The results showed
thatMcamong the three levels of each trait were significantly different in all cases
(N:F(2, 174) = 49.15,p< .001, Cohen’sf= .74; E:F(2, 174) = 44.64,p< .001,
Cohen’sf= .71; O:F(2, 174) = 40.78,p< .001, Cohen’sf= .68; A:F(2, 174) =
79.29,p< .001, Cohen’sf= .95; C:F(2, 174) = 77.17,p< .001, Cohen’sf= .94).
Bonferroni-adjusted post hoc tests for each trait revealed the following results. For the
trait N, perceivers were more conservative when judging targets as high N than when
judging targets as either low N or average N (ps< .001), but were equally
conservative when they judged cases as low N and average N. For the trait E,
perceivers were more conservative in judging a target as high or low E than average E
the trait O, perceivers were more conservative in judging targets as high O or low O
than average O (ps< .001), and they were equally conservative in judging a target as
low and average O. For the trait A, perceivers were more conservative when judging a
target as low in A than targets as either average or high A (ps< .001), and they were
also more conservative in judging a target to be high A than average A (p< .001). For
the trait C, perceivers were more conservative in judging targets as low C in
comparison with high or average C (ps< .005), and they were also more conservative
in judging targets as high C than judging them as average (p< .001).
The trends in judgmental accuracy in each trait in each condition
Video with audio condition
From Study 1 we already know that perceivers frequently made correct
judgments about the big-five traits based on a series of videos with audio across
different scenarios, and perceivers were more likely to be correct when they judged a
target as having a high or low level of a trait than when they judged a target was
average. Would these findings be replicated with the Conversation Scenario only?
Table 4 and Figure 2 show that, as with Study 1, perceivers did not uniformly
make correct judgments of each level of each trait: perceivers tended to be correct
when they judged a target as low N, high E, low and high O, high A as well as high C,
but there was no evidence of perceivers being correct when they judged a target was
in the middle of each trait.
A repeated measures ANOVA was conducted for each trait, with the three trait
the three levels of each trait (except for N) were significantly different (N:F(2, 56)
= .87,p= .427; E:F(2, 56) = 60.94,p< .001, Cohen’sf= 1.45; O:F(2, 56) = 4.83,p
= .012, Cohen’sf= .41; A:F(2, 56) = 8.52,p= .001, Cohen’sf= .54; C:F(2, 56) =
18.69,p< .001, Cohen’sf= .80).Post hocBonferroni-adjusted tests for each trait
(except for N) revealed the following results. For the trait E, perceivers were more
often correct when they judged a target as high E than when they judged a target as
being low E or average E (ps< .001), and they performed similarly when they judged
the targets as low E or average E. For the trait O, perceivers were more often correct
when they judged a target as low O (p= .038) and high O (p= .001) than when they
judged a target as average O, but performance in detecting targets as low or high O
was not significantly different. For the trait A, perceivers were less often correct when
they identified a target as average A than when they identified a target as low (p
= .01) or high (p=.001) in A, but there was no difference when they identified a target
as low or high A. For the trait C, perceivers were more often correct when they
identified the targets as high than when they identified the target as low and average
(ps< .005), and they performed similarly when identifying targets as low and average
C.
Overall, perceivers’ performance in detecting the big-five traits in the video with
audio condition replicated similar trends found in Study 1 with a small exception. It
seems perceiver performance when making judgments about high and low levels on
be because the current study was based only on the Conversation Scenario whereas
Study 1 calculated the aggregate accuracy across the three scenarios.
Video only condition
Would the findings in the video with audio condition generalize to the video only
condition? According to Table 4 and Figure 3, perceivers were often correct when
they judged that targets had high N, high E, low and high O, as well as high C while
viewing a silent video. A repeated measures ANOVA was conducted for each trait,
with the three trait levels as the within-subjects factor. The results revealed that the
means of d’ across the three levels of each trait were significantly different except for
the trait A (N:F(2, 58) = 4.07,p= .022, Cohen’sf= .37; E:F(2, 58) = 22.57,p
< .001, Cohen’sf= .96; O:F(2, 58) = 4.52,p= .015, Cohen’sf= .39; A:F(2, 58) =
1.61,p= .210; C:F(2, 58) = 5.31,p= .008, Cohen’sf= .42).Post hoc
Bonferroni-adjusted analyses for each trait (except for A) revealed the following things. For trait
N, perceivers were more often correct when they judged a target as high N than as
average N (p= .002). For the trait E, perceivers were more often correct when they
judged a target as high E than as either low or average E (ps< .001), and they
performed equally well when they judged targets as low or average in E. For the trait
O, perceivers were more effective when they judged targets as high O than when they
judged targets as average O (p= .026). For the trait C, perceivers were only more
often correct when they identified targets as high C than when they judged targets as
In summary, while observing the targets having a conversation with sound muted
perceivers were often correct when they judged a target as being located in the
extremes of most big-five trait continua. They generally tended to be more often
correct when they judged targets as either low or high on some trait continua than
when they judged targets as being in the middle level of the traits.
Audio only condition
As shown in Table 4 and Figure 4, perceivers were seldom correct when they
judged targets at any level of C, but they were effective when identifying the targets
as being in each level of O, and they also tended to be correct when they identified
targets as high N, low and high E as well as low and high A. They were not
systematically correct when judging targets as being in the middle level of each trait
(except for O). A repeated measures ANOVA was conducted for each trait, with the
three levels as the within-subjects factor. The results showed that the mean d’ values
across the levels of each trait were significant except for the traits O and C (N:F(2,
56) = 4.54,p= .015, Cohen’sf= .40; E:F(2, 56) = 9.49,p< .001, Cohen’sf= .57;
O:F(2, 56) = .49,p= .62; A:F(2, 56) = 18.82,p< .001, Cohen’sf= .81; C:F(2,
56) = .68,p= .512). The results ofpost hocBonferroni-adjusted tests for the traits N,
E and A were as follows. For the trait N, perceivers were equally correct when they
judged targets as having low and high N, and the performance in both cases was better
than when they judged targets as having average N (ps≤ .036). For the trait E, perceivers tended to be more often correct when they identified targets as low (p
performance when judging targets as low and high E was not different. For the trait A,
perceivers were more often correct when they judged targets as low (p= .002) and
high A (p< .001) than when they judged targets as average A; they were similarly
effective when judging cases as low and high A.
To summarize, in the Audio only condition, when judging N, E and A, perceivers
were not systematically correct when they judged targets as being in the average
level; but they tended to be correct when judging targets as either high or low in trait
levels (or both), and their performance when judging targets as being in these outer
levels was significantly better in most cases compared with when they judged targets
as being in the average level.
Study 3
The previous two studies conducted in Malaysia demonstrated that perceivers
seemed to perform better when identifying targets as having low or high levels of
traits than when they identified them as average. Could this finding be replicated in
another context with a different population? Study 3 was conducted in a different
cultural context with the aim of investigating whether perceivers’ detection of levels
of traits of unfamiliar targets forms a similar pattern to that reported in Studies 1 and
2.
Method
Participants
Thirty-nine participants (perceivers; 18 males) aged 20-47 years (M= 25.74
sample size was determined according to our previous research (Wu et al., 2016). The
perceivers were asked to identify whether they had met any of the targets (after
viewing the videos) and any who responded positively were excluded from the
analysis.
Materials
Video stimuli & the NEO Five-Factor Inventory-3 (NEO-FFI-3)
Forty-eight participants (targets; 19 males) aged 18-34 years (M= 23.73 years,
SD= 3.58) were recruited from the University of Nottingham UK campus. Each
target’s face and the top part of their body was recorded while they were reading the
verbatim script of a joke to the camera. The mean length of the videos was 12.19 s
(SD= 1.53, ranging from 7.98 s to 16.18 s).
After recording and a short break, each target completed the NEO-FFI-3. As in
the previous studies, targets’ self-report ratings were classified into levels of Low,
Average or High: Three (3 males), 31 (15 males) and 14 (1 male) targets respectively
scored low, average and high on N; 5 (2 males), 27 (4 males) and 16 (13 males) were
respectively low, average and high on E; 1 (0 males), 27 (9 males), and 20 (10 males)
were low, average and high on O; 7 (4 males), 29 (12 males) and 12 (3 males) scored
low, average and high on A; 11 (5 males), 32 (13 males) and 5 (1 male) were low,
average and high on C.
Procedure
The procedure was based upon what we had developed for Studies 1 and 2. After
judgment task presented on a computer using PsychoPy. Perceivers had to detect
which trait level (high, average or low) of each of the five traits the target belonged to
as they viewed each video clip.
Results and discussion
Main analysis – Detecting the big-five traits of the target
Preliminary checks showed that no perceivers judged the same category over
80% of the time across the five traits so all perceivers were retained in the analysis.
Table 6 shows the means of hit rate (MHR), false alarm rate (MFAR), d-prime (Md’) and
criterion c (Mc) in each category of each trait, along with the values of one-samplet
tests for eachMd’. There was a small amount of missing data where the perceiver
either failed to give a response for one trait or in some cases the program
malfunctioned. To maximize statistical power, we retained perceivers with a small
amount of missing data (<15%), adjusting the hit rate and false alarm rate to be
calculated only across the trials the perceiver actually responded to. For example, if
the perceiver correctly identified 4 out of 10 targets with low E but did not make a
response for two of the low E targets, the hit rate would be 4/8 or 0.5. The false alarm
rate for average and high E targets would also be adjusted in this example, because
there would be fewer opportunities for a false alarm for such cases.
As demonstrated in Table 6 and Figure 5, perceivers were not uniformly effective
in detecting each trait and each level of each trait. After observing the target reading a
average level of the trait continuum, but tended to be correct when they judged cases
as low N, low and high E, O and C, as well as low A.
Table 6 about & Figure 5 here
To examine whether the perceivers differed across the three trait levels and the
five traits, a 5 (traits) × 3 (trait levels) repeated-measures ANOVA was computed,
with the 5 traits and the 3 levels of each trait as the within-subjects factors; the
dependent variable wasMd’. There were main effects associated with the five traits (F
(4, 152) = 5.64,p= .001, Cohen’sf= .38) and the three trait levels (F(2, 76) = 53.49,
p< .001, Cohen’sf= 1.19) as well as an interaction between Trait and Level (F(8,
304) = 3.18,p< .01, Cohen’sf=.29).
To examine how perceivers’ judgments differed at different trait levels, we
conducted a repeated measures ANOVA for each trait, with the three trait levels as
the within-subjects factor. The results showed thatMd’values among the three levels
of each trait were significantly different in all cases (N:F(2, 76) = 5.69,p< .01,
Cohen’sf= .39; E:F(2, 76) = 7.35,p< .005, Cohen’sf= .44; O:F(2, 76) = 31.24,p
< .001, Cohen’sf=.91; A:F(2, 76) = 10.02,p< .005, Cohen’sf= .51; C:F(2, 76) =
4.46,p< .05, Cohen’sf= .34).Post hocBonferroni-adjusted tests for the three levels
of each trait revealed the following results. For the trait N, perceivers were more often
correct when they judged targets as low N than when they judged targets as average N
(p= .002). For the trait E, perceivers were more often correct when they identified
targets as low E than when they identified targets as average E (p= .004), and
average E (p= .034). For the trait O, perceivers were more often correct when they
identified targets as low O than as average and high O (ps< .001) and they were also
more often correct when they judged targets as high O than average O (p< .001). For
the trait A, perceivers were more effective when they judged targets as low A or high
A than as average (ps ≤ .001). For trait C, perceivers were more often correct when they identified targets as low C than as average C (p= .035) and they were also more
often correct when they identified targets as high C than average C (p= .020).
In order to determine whether or not perceivers differed in the criterion they
adopted for the two extreme levels of each trait than for the middle level (shown in
Table 6), we conducted a repeated measures ANOVA for each trait, with the three
trait levels as the within-subjects factor. The results showed thatMcfor the three
levels of each trait was significantly different in all cases (N:F(2, 76) = 43.46,p
< .001, Cohen’sf= 1.07; E:F(2, 76) = 34.99,p< .001, Cohen’sf= .96; O:F(2, 76)
= 52.22,p< .001, Cohen’sf= 1.17; A:F(2, 76) = 96.18,p< .001, Cohen’sf=1.59;
C:F(2, 76) = 131.45,p< .001, Cohen’sf= 1.86).Post hocBonferroni-adjusted tests
for each trait revealed the following results. For the trait N, perceivers were more
conservative when judging targets as high N than when judging targets as either low
N or average N (ps< .001), but were equally conservative when they judged cases as
low N and average N. For the trait E, perceivers were more conservative in judging a
target as high or low E than average E (ps< .001), and were more conservative in
judging targets as high than low E (p< .01). For the trait O, perceivers were more
were also more conservative in judging a target as low than average O (p< .001). For
the trait A, perceivers were more conservative when judging a target as low than
average or high in A (ps< .001), and were more conservative in judging a target to be
high than average A. For the trait C, perceivers were more conservative in judging
targets as being low C in comparison with high or average C (ps< .001), and they
were also more conservative in judging targets as high C than judging them as
average (p< .001).
In summary, based on a sample of targets and perceivers recruited from a
different culture, Study 3 suggested the following results: (1) perceivers were
unsuccessful when they identified targets as being in the middle level of each
dimension of the big-five traits; (2) when perceivers judged targets as being low N,
low and high E, O, and C, as well as low A they tended to be correct, and more so
than when they judged targets as being in the middle level of the traits.
General Discussion
In Study 1, after watching a short video with audio across the three scenarios,
perceivers tended to be correct when judging that a target was high or low in each trait
but performed less well when they judged targets as average. Based on the videos
with audio in the Conversation Scenario, Study 2 replicated these findings to a large
degree: Perceivers tended to be correct when they identified targets as scoring either
low or high on O, and low in N, high in traits E, A and C. With a sample of targets
and perceivers recruited from the UK, Study 3 also found perceivers tended to be
in A and low or high in C; and they were generally not effective when judging targets
as within the average level of each trait.
Previous research suggests that people are capable of making accurate judgments
about some dimensions of the big-five traits (e.g., Albright et al., 1988; Borkenau &
Liebler, 1992, 1993; Borkenau et al., 2004; Carnet et al., 2007; McLarney-Vesotski et
al., 2006; Watson, 1989) and can detect the distinctive from the normal in terms of
general personality profiles (Biesanz & Human, 2010). The present study has
extended these findings by showing that when people judge targets as being at the
outer levels (high or low) of the big five personality continua they tend to be correct,
while this is not the case when they judge targets to be in the middle. A similar pattern
of performance was found in a previous study which reported the ability to infer
targets’ trait of empathy (Wu et al., 2016).
Taken together, the findings here suggest that the strategy (or bias or preference)
of perceivers was to judge most people as average unless their behavior suggests
otherwise. This may be fairly effective in that it leads to a high frequency of correct
identifications overall, given that most people do fall within the category of average.
Nevertheless, when perceivers judged that a target fell into one of the two extreme
levels of a trait, they tended to be correct. Moreover, perceivers adopted a
conservative criterion for judging targets as being extreme - they frequently judge that
targets are average but judge that targets are in the extremes infrequently. However,
when they do make a judgment in one of the extremes it is often correct, implying that
One explanation we explore concerns the strength of the signal that is available to
perceivers: Compared with the average, targets who are high or low in personality
traits might behave in ways that are atypical (and do not typically follow situational
norms); for instance, an extravert is more talkative than normal while an introvert is
rather quieter than normal during social interactions. The behavior of targets located
in the middle of trait continua perhaps does not stand out from ‘normal’ behavior –
behavior that is normal for that particular situation. Perhaps perceivers assume that
targets are average unless there is a clear signal that suggests otherwise, resulting in a
subset of those who fell into the extremes of each trait being identified as such, with
everyone else assumed to be average. This possibility is also consistent with the
finding that there was variability between the traits in the exact pattern of
performance. This may be because some traits have a stronger signal at high than low
levels, and for others vice versa. In other words, there may be clearer, more visible
behavioral cues signaling at one end of the trait distribution than the other.
Another possibility is that people are better adapted to identify those with high or
low trait levels because these levels are moreevaluativethan middle levels. Typically,
one end of each trait dimension can be seen as desirable (such as high A or high C)
while the other end might be regarded as undesirable (such as low A, high N), and it
may be particularly advantageous to be able to identify others who have highly
desirable or undesirable traits, to decide who to cooperate with and who to avoid.
Previous research has suggested lower self-other agreement for traits that are more
perhaps due to inaccuracies in self-reports of evaluative traits (John & Robins, 1993).
However, previous research has not addressed the possibility that scores within
particular trait dimensions can be more or less evaluative.
It is possible that processes combine in making high and low levels of traits
detectable in some targets; the mechanisms discussed above are not mutually
incompatible. For instance, the desirability of a trait might impact on the strength of
the signal as targets make greater efforts to mask traits at the undesirable end of the
trait continuum. This could also explain some of the variability between traits: high N
was less well-identified across studies than low N, which could be due to targets
producing less clear signals of this trait level. While it is perhaps adaptive to be able
to identify those with atypical standing on a particular trait, it might also be adaptive
in some cases for targets to conceal such trait levels. Study 3 replicated the general
pattern of results of Studies 1 and 2 – after watching the target tell a joke, perceivers
tended to be correct when they judged a target as low N, low and high E, low and high
O, low A, and low and high C. The similarity is striking given that the studies
recruited samples of targets from culturally different populations performing slightly
different tasks. Studies 1 and 2 were conducted in Malaysia and sampled a wider
range of target behavior, such as having a conversation, telling a joke and reading
promotional material. In contrast, Study 3 was conducted in the UK and was based
only on targets telling a (different) joke. Even so, perceivers were inclined to be
correct when they identified targets as having the higher and lower levels of traits but
Finally, it is worth considering the findings here in the context of other research
on individual differences in target judgability. Colvin (1993) reported that targets with
high E, high A, high C and low N are particularly easy to judge, and more recently
Wood, Gosling and Potter (2007) found that a similar configuration of traits tended to
be perceived as ‘normal’ as opposed to ‘unique’. Taken together, the above findings
contrast with the current research in implying that targets who seem particularly
‘normal’ are easy to judge. Nevertheless, the results may not be inconsistent. In the
study by Wood et al., it was shown that what is perceived as normal is not necessarily
the same as the ‘true’ average standing on the traits. Moreover, the results in Study 1,
Study 2 (Video with Audio condition) and Study 3 were somewhat consistent with the
pattern observed by Colvin (where perceivers tended to be correct when they judged a
target as high E, high A, high C and low N). Furthermore, here the focus was on
individual traits rather than on combinations of traits within targets: it could be that
being average on a particular trait is not easy to detect but being generally average
would make deviations from normality in specific traits easier to detect.
In conclusion, the present research expanded upon recent findings (Wu et al.,
2016) by suggesting a similar kind of performance in people’s capabilities of inferring
the big-five traits, in which people tend to be imprecise in judging many targets as
average but when they judge a target as being other than average, they tend to be
correct. This ability is apparent in the sample from Malaysia and the sample from the
UK. These results suggest that being able to detect who is unique may be especially
impression formation in social life. Given the modest sample-sizes of targets in the
current study, larger-scale future replications will contribute a more nuanced picture
References
Albright, L., Kenny, D. A., & Malloy, T. E. (1988). Consensus in personality
judgments at zero acquaintance.Journal of Personality and Social Psychology,55,
387-395. doi:10.1037/0022-3514.55.3.387
Ambady, N., Bernieri, F., & Richeson, J. (2000). Towards a histology of social
behavior: Judgmental accuracy from thin slices of behavior. In Zanna, M. P. (Ed.),
Advances in experimental social psychology(pp. 201-272). New York, NY:
Academic Press.
Back, M. D., & Nestler, S. Judging personality. In Hall, J. A., Schmidt Mast, M., &
West, T. V. (Eds.) (2016).The social psychology of perceiving others accurately.
Cambridge University Press.
Baron-Cohen, S., & Wheelwright, S. (2004). The empathy quotient: An investigation
of adults with Asperger Syndrome or High Functioning Autism, and normal sex
differences.Journal of Autism and Developmental Disorders,34, 163-175.
doi:10.1023/B:JADD.0000022607.19833.00
Biesanz, J. C., & Human, L. J. (2010). The cost of forming more accurate
impressions: Accuracy-motivated perceivers see the personality of others more
distinctively but less normatively than perceivers without an explicit goal.
Psychological Science, 21 (4),589-594. doi:10.1177/0956797610364121
Borkenau, P., & Liebler, A. (1992). Trait inferences: Sources of validity at zero
acquaintance.Journal of Personality and Social Psychology, 62, 645-657.
Borkenau, P., & Liebler, A. (1993). Convergence of stranger ratings of personality
and intelligence with self-ratings, partner ratings, and measured intelligence.Journal
of Personality and Social Psychology, 65,546-553. doi:10.1037/0022-3514.65.3.546
Borkenau, P., & Ostendorf, F. (1998). The Big Five as states: How useful is the
Five-Factor Model to describe intraindividual variations over time?Journal of research in
personality,32, 202-221. doi:10.1006/jrpe.1997.2206
Borkenau, P., Mauer, N., Riemann, R., Spinath, F., & Angleitner, A. (2004). Thin
slices of behavior as cues of personality and intelligence.Journal of Personality and
Social Psychology,86, 599-614. doi:10.1037/0022-3514.86.4.599
Carney, D. R., Colvin, C. R., & Hall, J. A. (2007). A thin slice perspective on the
accuracy of first impressions.Journal of Research in Personality,41, 1054-1072.
doi:10.1016/j.jrp.2007.01.004
Clark, S. E. (2012). Costs and benefits of eyewitness identification reform:
Psychological science and public policy.Perspectives on Psychological Science, 7,
238–259. doi:10.1177/1745691612439584
Cohen, J. (1988).Statistical Power Analysis for the Behavioral Sciences. New Jersey:
Lawrence Erlbaum Associates.
Colvin, C. R. (1993). “Judgable” people: Personality, behavior, and competing
explanations.Journal of Personality and Social Psychology, 64,861-873. doi:
10.1037//0022-3514.64.5.861
Connelly, B. S., & Ones, D. S. (2010). An other perspective on personality: