warwick.ac.uk/lib-publications
Original citation:
Cinelli, Marco, Coles, Stuart R., Nadagouda, M. (Mallikarjuna), Blaszczynski, Jerzy, Slowinski,
Roman, Varma, Rajender S. and Kirwan, Kerry. (2017) Robustness analysis of a green
chemistry-based model for the classification of silver nanoparticles synthesis processes.
Journal of Cleaner Production, 162. pp. 938-948.
Permanent WRAP URL:
http://wrap.warwick.ac.uk/90328
Copyright and reuse:
The Warwick Research Archive Portal (WRAP) makes this work of researchers of the
University of Warwick available open access under the following conditions.
This article is made available under the Creative Commons Attribution 4.0 International
license (CC BY 4.0) and may be reused according to the conditions of the license. For more
details see:
http://creativecommons.org/licenses/by/4.0/
A note on versions:
The version presented in WRAP is the published version, or, version of record, and may be
cited as it appears here.
Robustness analysis of a green chemistry-based model for the
classi
fi
cation of silver nanoparticles synthesis processes
Marco Cinelli
a,b,*, Stuart R. Coles
b, Mallikarjuna N. Nadagouda
c, Jerzy B
ł
aszczy
nski
d,
Roman S
ł
owi
nski
d,e, Rajender S. Varma
c, Kerry Kirwan
b,**aInstitute of Advanced Study, Millburn House, University of Warwick Science Park, Coventry, CV4 7HS, UK bWMG, University of Warwick, Coventry, CV4 7AL, UK
cU.S. Environmental Protection Agency, ORD National Risk Management Research Laboratory, Water Systems Division / Water Resources Recovery Branch,
26 West M.L.K. Dr., MS 443, Cincinnati, Ohio 45268, USA
dInstitute of Computing Science, Poznan University of Technology, 60-965 Pozna n, Poland eSystems Research Institute, Polish Academy of Sciences, 01-447 Warsaw, Poland
a r t i c l e i n f o
Article history:
Received 1 October 2016 Received in revised form 13 June 2017
Accepted 13 June 2017 Available online 14 June 2017
Handling Editor: Cecilia Maria Villas B^oas de
Almeida
Keywords:
Multiple Criteria Decision Aiding Robustness analysis
Green nanotechnology
Dominance-based Rough Set Approach ELECTRE
a b s t r a c t
This paper proposes a robustness analysis based on Multiple Criteria Decision Aiding (MCDA). The ensuing model was used to assess the implementation of green chemistry principles in the synthesis of silver nanoparticles. Its recommendations were also compared to an earlier developed model for the same purpose to investigate concordance between the models and potential decision support synergies. A three-phase procedure was adopted to achieve the research objectives. Firstly, an ordinal ranking of the evaluation criteria used to characterize the implementation of green chemistry principles was identified through relative ranking analysis. Secondly, a structured selection process for an MCDA classification method was conducted, which ensued in the identification of Stochastic Multi-Criteria Acceptability Analysis (SMAA). Lastly, the agreement of the classifications by the two MCDA models and the resulting synergistic role of decision recommendations were studied. This comparison showed that the results of the two models agree between 76% and 93% of the simulation set-ups and it confirmed that different MCDA models provide a more inclusive and transparent set of recommendations. This integrative research confirmed the beneficial complementary use of MCDA methods to aid responsible development of nanosynthesis, by accounting for multiple objectives and helping communication of complex infor-mation in a comprehensive and traceable format, suitable for stakeholders and/or decision-makers with diverse backgrounds.
©2017 The Authors. Published by Elsevier Ltd. This is an open access article under the CC BY license (http://creativecommons.org/licenses/by/4.0/).
1. Introduction
The comprehensive assessment of the implementation of green chemistry principles (GCP) during nanosynthesis processes is a complex decision-making problem, requiring the consideration of multiple evaluation parameters. The authors have recently pro-posed a model to provide a preliminary solution to this challenge (Cinelli et al., 2015) as well as a holistic set of criteria for the
sustainability appraisal of nanoproducts (Cinelli et al., 2016). However, the credibility of sustainability-oriented assessments relies on the robustness of the results they provide to the Decision-Makers (DMs) (Sala et al., 2015). In order to achieve credible and sound decision support, the uncertainties inherent in these evalu-ations as well as the resulting modelling strategies need to be accounted for (Dias et al., 2012). This paper proposes a methodol-ogy that considers these requirements by employing a decision support method from the Multiple Criteria Decision Aiding (MCDA) research domain.
Nanomaterials can be produced via different techniques and the bio-inspired approaches are receiving surging interest from the scientific community for the possibility of implementing GCP (Gilbertson et al., 2015; Mata et al., 2015; Varma, 2014). The eval-uation of how green synthesis processes are for nanomaterials is a
*Corresponding author. Current address: Future Resilient Systems (FRS), Swiss
Federal Institute of Technology (ETH) Zϋrich, Singapore-ETH Centre (SEC),
Singapore
**Corresponding author.
E-mail addresses:[email protected](M. Cinelli),kerry.kirwan@warwick. ac.uk(K. Kirwan).
Contents lists available atScienceDirect
Journal of Cleaner Production
j o u r n a l h o m e p a g e :w w w . e l s e v i e r . c o m / lo c a t e / j c l e p r o
http://dx.doi.org/10.1016/j.jclepro.2017.06.113
challenging task, due to the limited information available on the specific operating conditions and the impacts associated with the employed materials (Feijoo et al., 2017; Meyer and Upadhyayula, 2014). Some studies have assessed the environmental impacts of nanomaterials synthesis with life cycle assessment (LCA), though the main limitation is that data are currently lacking or are of low quality to assess the implications of synthesis processes for nano-materials with quantitative methods, especially those which are based on bio-inspired approaches (Pati et al., 2014; Pourzahedi and Eckelman, 2015). Nonetheless, qualitative and semi-quantitative information is available on the types of employed materials, oper-ational conditions, equipment typologies and products’ perfor-mance. MCDA methods have been confirmed as excellent candidates to handle heterogeneous information and uncertainties and provide intelligible comprehensive evaluations of comparable materials, processes and technologies (Cinelli et al., 2014; Singh et al., 2012).
So far nanomaterials have been produced through the“ bio-inspired”route with bacteria, fungi, plants, plants extracts, yeasts and algae and the literature is steadily growing in this domain (Stark et al., 2015; Varma, 2016; Virkutyte and Varma, 2013). However, limited research efforts were devoted to understand how“green” they are and assess the implementation of GCP in bio-inspired nanosynthesis processes in the form of a perfor-mance class (e.g. “green” nano) (Bergeson, 2013; Duan et al., 2015; Matus et al., 2011). Such research gap is an important limitation for practitioners who aim at complying with demands for green nanomaterials and associated synthesis processes, especially for those that do not yet allow quantitative assess-ments employing LCA, for example. This article contributes to this topic by developing an MCDA model that can support such type of evaluations and should not be seen as a tool in substi-tution for quantitative methods but rather as a decision aid in-strument that can help chemists and engineers in reflecting on the implications of their choices during the development of new materials and products.
The challenge of assessing the “greenness” of nanosynthesis processesfits with the MCDA methodology, and the authors of this paper previously developed another MCDA model based on Dominance-based Rough Set Approach (DRSA) for the classification of synthesis processes of silver nanoparticles depending on the GCP implementation (Cinelli et al., 2015). The DRSA-based model is a notable contribution for the chemists' and nanosynthesis’ com-munities because it shows how the MCDA process and one of its methods can be used through an intelligible approach for prefer-ences elicitation, by posing limited burden on the DMs and obtaining condensed and intelligible representation of their knowledge in the form of decision rules. It can help screening “greenness” of new or existing processes by supplying quality classes on afive-level scale and justify the decision recommenda-tion (i.e. classification) with easily intelligible“if condition,then
decision”rules. However, the robustness of its recommendations must be verified in the form of its validity and stability according to a compatible set of modelling constraints (Bouyssou et al., 2006).
This paper presents a robustness analysis structured upon the MCDA process. The objective was achieved by exploiting a subset of criteria for the sustainability assessment of nanoproducts recently published (Cinelli et al., 2016) to develop an MCDA model, based on Stochastic Multi-Criteria Acceptability Analysis (SMAA), yielding uncertainty-characterized robustfindings, which were compared with the classifications of the DRSA-based model.
This paper has two main objectives:
Describe the development and application of an MCDA model (ELECTRE-based (Figueira et al., 2005)) for the assessment of
implementation of GCP in synthetic processes for silver nanoparticles;
Use its decision recommendations to evaluate the correspon-dence with the DRSA-based model described in (Cinelli et al., 2015) and study the potential decision support synergies.
The paper presents the methodology that was developed to conduct the robustness analysis (Section2), and then describes its results with the main learning insights that MCDA empowers when supporting sustainability-oriented assessments (Section 3); tangible conclusions are summarized in Section4.
2. Methodology
The decision-making challenge tackled in this case study is a classification problem. Considering that provision of decision rec-ommendations in the form of a quality class is one of the main reasons why MCDA has been developed and excels (Cinelli et al., 2014; Roy and Słowinski, 2013 ), it was employed in this research project to advance a relevant classification model. This case study builds upon the decision-making problem described in the afore-mentioned previous study and the reader is referred to that article for details on its context (Cinelli et al., 2015).
The justification for the use of MCDA is supported by its ca-pacities of effectively meeting three main challenges that hamper the assessment of the “greenness” of nanosynthesis processes, including (i) the need to account for performance criteria of different type (e.g. quantitative, qualitative, fuzzy) (Eason et al., 2011; Mata et al., 2015), (ii) high uncertainty in input dataset (Mata et al., 2015; Meyer and Upadhyayula, 2014; Pourzahedi et al., 2017), and (iii) limited capabilities of conventional tools to provide a comprehensive and easily interpretable evaluation of each pro-cess (Bates et al., 2015; Eason et al., 2011).
The model presented in this paper (i.e. ELECTRE-based model) provides classifications for a set of test synthesis processes as those considered in (Cinelli et al., 2015), which can be defined as robust following the definition proposed by Dias and Climaco (2000). Robustness analysis consists in assessing how robust conclusions are when a precise combination of the parameters (e.g. weights, thresholds) of the model is not imposed. This type of analysis leads to survey all the possible recommendations that are compatible with such modelling constraints. According to the grouping of robustness analysis forms proposed byDias (2007), the one adop-ted in this case is the ex-post, because the research goal consists in assessing the stability of the recommendations according to a pre-defined set of compatible models. These models derive from the consideration of imprecise information, which can be lack of pre-cise user's preferences and values for the parameters on the input dataset.
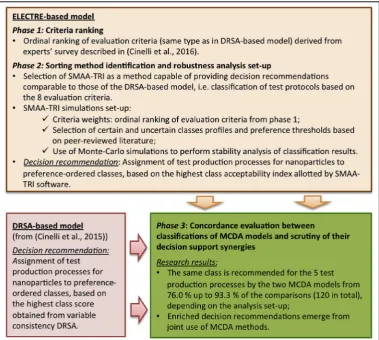
Fig. 1 summarizes the procedure proposed to develop the ELECTRE-based model and compare its results with the DRSA-based model. It incorporates the elaboration of the relative ranking of performance criteria from (Cinelli et al., 2016) (phase 1), the selection process for the suitable sorting method as well as the modelling used to obtain comparable classifications for the test protocols (phase 2), and the strategy used to assess the agreement between recommendations of the two models (phase 3).
2.1. Identification of alternatives and evaluation criteria
and preference direction. They all have ordinal (i.e. qualitative) scales with the exception of criteria g5and g6, which have a cardinal (i.e. quantitative) scale.
Table 2shows thefive synthesis protocols (t1-5) that were used as test dataset, which are the same as those employed in the DRSA-based model (Cinelli et al., 2015).
2.2. Criteria weights
Thefirst phaseof the robustness analysis procedure (seeFig. 1) was inspired by the framework of sustainability evaluation criteria proposed in a recent paper in this journal, ranked according to their relative importance (Cinelli et al., 2016). A correspondence between a subset of such criteria and the evaluation criteria used in this case study could be derived, as shown inTable 3and their ranking was used as preference information for ELECTRE-based model con-struction. Similar approaches emerged in comparable research contexts, where rankings of criteria based on experts’survey were used as preference information to develop MCDA models (Akadiri and Olomolaiye, 2012; Tobiszewski and Orłowski, 2015).
Multiple correspondences between the criteria in the survey and the ELECTRE-based model indicate that various combinations of criteria priorities are possible (Table 3). As far as the MCDA models are concerned, the possible correspondence between criteria from the survey is that“Hazardous materials used or pro-duced”(2nd rank),“Use of renewable resources”(3rd rank) and “Use of raw materials”(6th rank) can be represented by reducing agent (g1), capping agent (g2) and solvent (g3).“Energy efficiency” (4th rank) and“Energy consumption”(5th rank) are represented by the criterion equipment type (g7). Consequently, the 2nd, 3rd and 5th positions in the MCDA models (right column inTable 3) can be taken either byg1,g2andg3, whereas the fourth position is always assigned to g7. These conditions lead to the following modelling constraints. Three criteria (i.e.g1,g2 and g3) can take their rank either in 2nd, 3rd or 5th position. There can be six permutations in place (three criteria * two positions to vary) and thus the overall set of possible rankings to consider is six. Such permutations are conducted for thefive test protocols, which for each modelling set leads to 30 classifications. What is more, reaction time (g5) and reaction temperature (g6) can be allotted to rank 7th and 8th and vice-versa, which doubles the number of classifications to 60 (see also details in Section 2.3, “Accounting for uncertainty in the analysis”).
2.3. Sorting method selection and robustness analysis set-up
The decision recommendation provided by the DRSA-based model is a suggestion of classification of a protocol that results from inductive learning on the comprehensive evaluation of a set of reference protocols. This implies the evaluation of the robustness of its recommendation required a tool capable of providing a suitable result to which it could be compared (second phaseof the robust-ness analysis procedure,Fig. 1). MCDA is ideal for aggregating in-formation and providing a classification or ranking of the alternatives under evaluation (Cinelli et al., 2014; Domingues et al., 2015; Tervonen et al., 2009b), consequently the development of the new model was grounded on an MCDA method, with the following requirements driving its selection:
Need for enforcement of strong sustainability, so that limited compensation between criteria is guaranteed;
Independence of criteria weights from their evaluation scales. This is due to the nature of the importance of the criteria, which represent their relative importance and not the trade-offs
between their measurement scales (details about weights ty-pology is available in (Cinelli et al., 2014));
Decision recommendations (i.e. classes assignment) must be robust. The MCDA approach needs to investigate the possible changes in results by accounting for the uncertainty of input parameters, in this case weights and class profiles;
Most of the evaluation criteria (six out of the eight) are expressed on an ordinal scale, with two on a cardinal one. MCDA method, thus, has to be tailored for this typology.
An assessment of the MCDA methods available in the literature (drawing from thefindings presented in (Cinelli et al., 2014; Ibanez-~ Fores et al., 2014; Munda, 2016; Rowley et al., 2012) in relation to the requirements listed above lead to the identification of SMAA method (Tervonen et al., 2009a) as a relevant candidate to confront the research challenge. In this case, SMAA-TRI was selected as it is an MCDA classification method based on ELECTRE-TRI, with the added capability of using imprecise measurements values, thresh-olds, weights and class profiles, so that robust decision recom-mendations can be achieved through parameter stability analysis (Tervonen and Lahdelma, 2007).
The main differences this research introduces compared with previous studies dealing with evaluation of nanosynthesis pro-cesses based on sustainability metrics (Canis et al., 2010; Naidu et al., 2008), are that in this case:
The aim of the evaluation is to classify the processes rather than to rank them;
Real preference information is employed as data input; The focus of the approach is on the synthesis of silver
nano-particles based on techniques which have been frequently labelled as green and more sustainable (Changseok et al., 2013; Dahl et al., 2007; Dubey et al., 2010; Hebbalalu et al., 2013; Karn, 2008; Karn and Wong, 2013; Kavitha et al., 2013; Kaviya et al., 2011; Kou et al., 2013; Luque, 2013; Matus et al., 2011; Patete et al., 2011; Pati et al., 2014; Senjen, 2009; Varma, 2014; Virkutyte and Varma, 2013).
For the sake of simplicity the multiple models developed for the RA based on SMAA-TRI will be termed“ELECTRE-based model.”
2.3.1. Class profiles and thresholds
The aim of the decision-aiding model is to classify synthesis protocols in preference-ordered classes, based on the imple-mentation of the GCP and the technical performance, represented by the size range of the nanoparticles.
Five classes (C1<C2<C3<C4<C5) were devised by accounting for the nature of the data, as well as the arbitrariness that is inherent in the coding of the criteria values (Table 1):
C1¼GCP are completely overlooked;
C2 ¼ limited implementation of GCP and/or satisfaction of quality requirements;
C3 ¼ partial fulfilment of GCP and potentials for quality improvements;
C4 ¼performance standards are satisfied and many GCP are implemented;
C5¼the process is very good both from a green chemistry and technical perspective.
processes assigned toC1and C2are those that require thorough considerations about the worthiness of such approaches and need improvement work to increase their“greenness”.
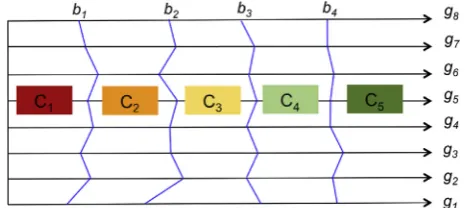
Every performance class C (C ε f1;2;3;4;5g) in SMAA-TRI is delimited by a profilebh(seeFig. 2), so that each of them has a certain discriminatory value for every criteriongj.bjis worse than
bjþ1on all criteria.
The selection of the values of the profiles for the criteria was based on analysis of production strategies reported in the literature.
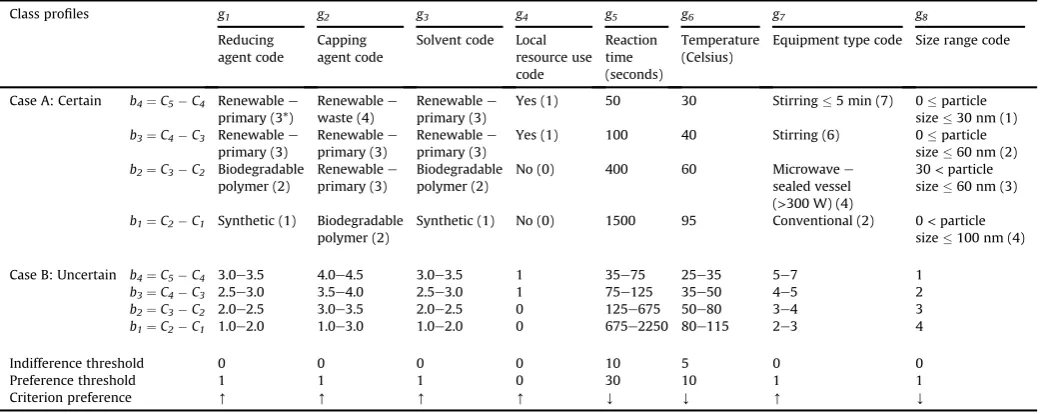
Table 4 shows a summary of the selected profiles values and
Appendix A in Electronic Supplementary Information (ESI) pro-vides the scientific rationale on selection of suchfigures.
Elaborate preferences can be accounted for by this MCDA method using two types of thresholds: indifference thresholdqj and preference thresholdpj. There are currently no guidelines to define such thresholds, however an elaboration of the research considerations reported by relevant authors in the published literature allowed them to be extracted (Table 4).Appendix Ain ESI provides the scientific details for such values selection.
2.3.2. Classification of synthesis processes
SMAA-TRI operates with an outranking relation approach based on pairwise comparisons of alternatives, which means that the performance of each production processtmon each criteriongjis compared to profilebhto verify whether the synthesis protocoltmis “at least as good as” profile bh. In other words, it is checked if outranking relationtmS bhholds (Dias and Mousseau, 2003). This leads to the calculation of credibility index
r
for the outrankingrelationstmS bh(seeAppendix Bin ESI for details on the SMAA-TRI procedure).
r
represents the credibility of outranking of each production protocol over the class profile. It is used to make a recommendation of the assignment of production protocols to classes.SMAA-TRI operates a high number of simulations (i.e. 10,000), sampling at each run a set of weights (case I below) as well as class profiles (case II below) from a uniform probability distribution (Tervonen and Lahdelma, 2007). The final results are Class Acceptability Indices (CAI), which indicate the share of possible parameters (expressed as a percentage) that lead a protocol to be assigned to each classCh(Tervonen and Lahdelma, 2007). CAI is an intelligible tool that conveys the stability of the input information, providing robust conclusions despite having incomplete informa-tion. The higher the score for a class, the higher the confidence for such class. The range of this index is between 0 and 1, with 0 indi-cating that the process will never be assigned to the specific class whereas 1 denoting that the process will be assigned to the target class with every combination of uncertain input values.
2.3.3. Weighting
[image:5.595.113.493.66.406.2]SMAA-TRI uses weights as intrinsic measures of importance of each criterion so that the value of the weight is independent from the evaluation scale of each criterion (Figueira et al., 2005). There are various strategies that can be used to assign weight values to the criteria in outranking methods (Figueira et al., 2005) and the approach selected in this case benefits from part of the results described in Section2.2, where the criteria priorities obtained from
the survey questionnaire allow defining an ordinal ranking of such criteria, which can actually be used in SMAA-TRI. The novel contribution to the research area consists in the use of a method that does not depend on the opinions of two specific experts, uses parsimonious information about preferences (i.e. ordinal ranks) and supplies robust conclusions.
In order to account for an even broader uncertainty in weight-ing, SMAA-TRI was also run without any preference information on the weights (i.e. missing weights option). The results are
summarized inAppendix Hin ESI and do not deviate considerably from the ones presented and discussed in Section3.
2.3.4. Accounting for uncertainty in the analysis
[image:6.595.30.554.95.369.2]Two types of uncertainty had to be treated in the construction of the ELECTRE-based model: (i) selection of criteria weights; and (ii) definition of discriminatory profiles between the quality classes. Consequently, two modelling layouts were defined in this model to consider such uncertainties.
Table 1
Criteria selected for evaluation of synthesis protocols, including coding and rationale for preference direction (the arrow‘up’means that the higher its rank on the list of
possible values, the better it is, and the arrow‘down’says the opposite) (adapted from (Cinelli et al., 2015)).
Criterion Criterion values Code Preference order of the values
g1¼Reducing agent Renewableewaste 4 [
Renewableeprimary 3
Biodegradable polymer 2
Synthetic 1
g2¼Capping agent Not needed 5 [
Renewableewaste 4
Renewableeprimary 3
Biodegradable polymer 2
Synthetic 1
g3¼Solvent Renewableewaste 4 [
Renewableeprimary 3
Biodegradable polymer 2
Synthetic 1
g4¼Local resources use Yes 1 [
No 0
g5¼Reaction time In seconds integer Y
g6¼Reaction temperature In Celsius integer Y
g7¼Equipment type Static 8 [
Stirring for at most 5 min 7
Stirring 6
Microwaveesealed vessel (300 W) 5
Microwaveesealed vessel (>300 W) 4
Microwaveeopen vessel 3
Conventional (oil bath, steam bath) 2
Not reported 1
g8¼Particles size range 0particle size30 nm 1 Y
0particle size60 nm 2
30<particle size60 nm 3
0<particle size100 nm 4
[image:6.595.31.557.410.492.2]60<particle size100 nm 5
Table 2
Test protocols used to show decision support capabilities of MCDA models (from (Cinelli et al., 2015)).
Test protocol g1 g2 g3 g4 g5 g6 g7 g8 Quality class
(C1<C2<C3<C4<C5) Reducing
agent code Capping agent code
Solvent code Local
resource use code
Reaction time (seconds)
Temperature (Celsius)
Equipment type code
Size range code
t1 3 5 3 0 55 42 5 1 ?
t2 3 2 1 1 2500 85 2 2 ?
t3 2 2 3 0 600 90 2 3 ?
t4 3 3 3 0 70 65 5 1 ?
t5 1 1 1 0 480 100 3 1 ?
Table 3
Relative ranking of criteria (Cinelli et al., 2016) and correspondence with those employed in MCDA models.
Criteria from experts' survey and relative ranking Correspondent evaluation criteria in the MCDA models
1 Functionality Particle size range
2 Hazardous materials used or produced Reducing agent/Capping agent/Solvent
3 Use of renewable resources Reducing agent/Capping agent/Solvent
4 Energy efficiency Equipment type
5 Energy consumption Equipment type
6 Use of raw materials Reducing agent/Capping agent/Solvent
7 Local resources use Local resources use
8 Processing conditions Reaction time
[image:6.595.32.554.534.630.2]2.3.4.1. Case I: certain class profiles. Thefirst modelling set-up with SMAA-TRI considered only the uncertainty in the weighting pro-cedure. As described in Section2.2, the weights of the criteria were based on an ordinal ranking, which did not impose a specific value for each of the weights. Furthermore, priorities of the criteria had to be varied as well, due to the multiple correspondences between them and those from the survey (seeTable 3).
2.3.4.2. Case II: uncertain class profiles. The second set-up of the SMAA-TRI model included the previous type of uncertainty and also the one related to the values for the class profiles. This decision accounted for the fact that the profiles of the classes adopted for the discernment of quality of synthesis processes were selected from a range of possible values. Even though their appointment was based on the published literature as discussed above and inAppendix Ain ESI, expert judgment was adopted to choose the individual discriminatory values (seeTable 4for the selected uncertain
pro-files values). This represents a second type of uncertainty that was considered in the model, together with the variability of the criteria weights, as in the previous case.
3. Results and discussion
A robustness analysis of nanosynthesis test processes was con-ducted by means of SMAA-TRI through several simulations set-up settings, which included certain (i.e. case I) and uncertain (i.e. case II) class profiles with criteria in different importance ranks according to the combinations explained in Section2.2.
The same five test protocols (see Table 2) used to show the applicability of DRSA-based model were employed to examine the decision support synergies with the ELECTRE-based model and also the decision recommendation (i.e. classification) agreement of the two models (third phase of the robustness analysis, Fig. 1). In addition, no veto threshold for any criteria was applied considering the lack of such type of information in the relevant literature, which means that only concordance indexes contributed to the calculation of the credibility indices. Such an approach is in line with a com-parable case study application in the area of risk assessment of nanomaterials (Tervonen et al., 2009b). Lastly, the
l
-cutting levelrange was½0:65;0:85, the recommended and sensible interval to be used for the ELECTRE-TRI method as it considers the cases for a simple (though strong, i.e. 65% of criteria weights) as well as above two-thirds criteria majority (Domingues et al., 2015; Tervonen et al., 2009b).
A summary of the RA outcomes is provided inTable 5, whereas the detailed results are reported inAppendices CeFin ESI. In each case, six different combinations of the materials type criteria were tested with SMAA-TRI, which leads to a total of 30 agreement comparisons between the two models. Moreover, a distinction between certain (case I) and uncertain profiles (case II) was applied.
InAppendices C and D, reaction time (g5) was kept as the second-to-last (7th rank) and reaction temperature (g6) was the last one (8th rank) whereas the setting was the opposite (7th rank for re-action temperature and 8th rank for rere-action time) inAppendices E and F. The overall modelling sets amount to four as the models were run with certain and uncertain profiles, combined with reaction time in 7th rank and reaction temperature in 8th rank and vice-versa. This led to a 120 comparisons on the whole.
The overall correspondence was just under 86%, a satisfactory value for such a different application of MCDA (Dimitras et al., 1999; Słowinski et al., 1997 ). In all the comparisons it can be seen that there is a high to very high correspondence between decision recommendations of the two MCDA models, with values up to 93.3% (i.e., the same class recommended for 28 out of 30 protocols). The lowest agreement (76.0%) is reached in the case of uncertain class profiles with reaction temperature in 7th rank and reaction time in 8th rank, still an acceptable concordance level in this case as well (Dimitras et al., 1999; Słowinski et al., 1997 ).
Most of the disagreement between the models (14 out of 17 discordance cases) involves protocolst3andt5. As far ast3is con-cerned, the reason is that the protocol employs a renewable pri-mary material as a solvent, which is considered as good from a green chemistry perspective. When the solvent is placed at a high position in the ordinal ranking, its relative weight increases, which overall determines a higher assignment to class 3 (medium) rather than 2 (low) as DRSA does. In the case oft5, the reason is that the process uses a synthetic capping agent, the worst condition from the green chemistry perspective. In fact, a synthetic material should be the least preferred choice and the capping agent can be elimi-nated if a multifunctional reducing agent is used. For this reason,C5 (very low) receives a lot of CAI share from SMAA-TRI, especially when the capping agent has a high ordinal rank and thus it has a higher weight.
The comprehensibility of the justifications“behind”the decision recommendation is an important feature of MCDA models as it can increase their transparency to non-experts in MCDA who are interested in understanding why an alternative receives a certain evaluation while others do not. More specifically, transparency is essential to avoid the model being perceived as a “black box” (Słowinski et al., 2009). Furthermore, the combined use of MCDA methods working with different methodological foundations can enhance the credibility of the recommendations; these detailed considerations are elaborated in the remaining of this section.
In the case oft1,the DRSA-based model provides a recommen-dation that is supported by the decision rules 3, 5, 6, 8, 11, 12, 13 (see
Scheme 1for explanation of rules). These rules point out important characteristics of green chemistry protocols, including the possi-bility of producing nanoparticles within short timeframes and under milder temperatures (rule 3, 13) in combination with the use of a renewable capping agent or the adoption of multifunctional renewable materials that eliminate the need for a capping agent in the process (rule 5, 6). This is coupled with the possibility of using benign solvents such as water (rule 8, 11). These set-ups lead to fulfilment of several GCP, including reduction in hazardousness of chemical synthesis, prevention of waste and reduction of de-rivatives, use of safer solvents and inherently safer chemistry (e.g. closed vessels and low power). The decision recommendations provided by the DRSA-based model can be easily traced back to the protocols that applied these principles and that form the basis of the decision rules.
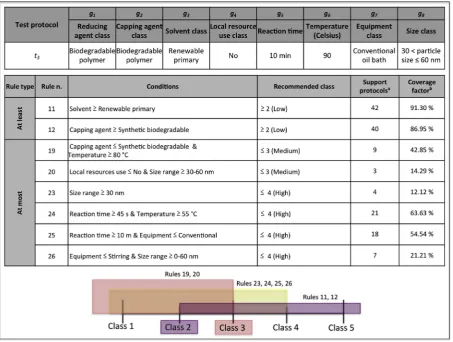
[image:7.595.51.284.613.717.2]The example fort3leads to other considerations as the matching rules are 11, 12, 19, 20, 23, 24, 25, 26 (seeScheme 2for explanation of rules). The learning process in this case is more elaborate as there are both types of rules involved,“at least”and“at most.”As far as the“at least”rules are concerned (i.e. 11, 12), the DRSA-based model
indicates a potentially at least low performance based on the use of a renewable primary material as a solvent and a bio-polymer as a capping agent instead of synthetic chemicals. On the other hand, the other types of rules (i.e. at most) are indicative of several con-cerns. Firstly, the use of a rather high temperature (80C) and the selection of a capping agent at most bio-polymer (rule 19) in addition to the use of non-local resources as well as producing lower quality particles (between 30 and 60 nm size) (rule 20) suggest a maximum assignment to medium class. This is com-plemented by the use of a conventional heating technique that requires rather long reaction times (10 min in this case) (rule 25), not desirable when looking at the process from the green chemistry perspective (Gilbertson et al., 2015). The intersection of the rules following the standard DRSA procedure would suggest a low or medium class as a decision recommendation, whereas the more elaborate approach provides the low class as an assignment.
These assessment examples show that, from a decision aiding perspective, the recommendation provided by the DRSA-based model is traceable and supported by previous knowledge base that in this case was extracted from the two experts that collabo-rated during the case study. These rules are a summary of the characteristics of synthesis processes that have already been developed in reality and can thus be used as comparative measures when developing brand new processes or while assessing existing ones.
The ELECTRE-based model provides a different and comple-mentary perspective on each process by accounting for the
performance on each criterion and aggregating the information following the procedure presented in Section2.3andAppendix B. This means that the decision aiding support is focused on the evaluation of the performance of each protocol for every criterion in respect to a performance profile for each class.Tables 6 and 7
illustrate the scoring on the evaluation criteria for thefirst (t1) and third (t3) test protocols with respect to every class profile, together with the assigned CAI for each quality class. Processt1 performs well in relation to the class profiles, which explains the high percentage for the very high CAI (i.e. 81%), though there is not a specific indication/explanation about the combined effect of the criteria on the decision recommendation (Table 6). Similarly, when considering process t3 it is evident that the protocol does not perform well on the green chemistry criteria, which explains the reason behind the recommendation mostly for a low performance class (Table 7). In this case, the developer of a new process could consider the improvement on the worst criteria (e.g. capping agent
g2, processing conditionsg5,g6and equipmentg7), however he/she would not be provided with a recommendation on how the process could be improved by taking exemplary real case processes as indicative guidelines, which is what the DRSA-based model does through the supporting protocols for the rules.
[image:8.595.34.555.85.292.2]One key advantage of SMAA-TRI is the possibility of obtaining results that do not depend on a specific weights vector elicited from some DM. The method empower the analysts to use different rankings of the criteria weights based on the survey involving many experts, resulting in conclusions which are more acceptable, since
Table 4
Class profiles, thresholds and preferences directions for criteria used in SMAA-TRI (*: the numbers within brackets indicate the code used for the value of each criterion).
Class profiles g1 g2 g3 g4 g5 g6 g7 g8
Reducing agent code
Capping agent code
Solvent code Local
resource use code
Reaction time (seconds)
Temperature (Celsius)
Equipment type code Size range code
Case A: Certain b4¼C5C4 Renewablee
primary (3*)
Renewablee
waste (4)
Renewablee
primary (3)
Yes (1) 50 30 Stirring5 min (7) 0particle
size30 nm (1)
b3¼C4C3 Renewablee
primary (3)
Renewablee
primary (3)
Renewablee
primary (3)
Yes (1) 100 40 Stirring (6) 0particle
size60 nm (2)
b2¼C3C2 Biodegradable
polymer (2)
Renewablee
primary (3)
Biodegradable polymer (2)
No (0) 400 60 Microwavee
sealed vessel
(>300 W) (4)
30<particle
size60 nm (3)
b1¼C2C1 Synthetic (1) Biodegradable
polymer (2)
Synthetic (1) No (0) 1500 95 Conventional (2) 0<particle
size100 nm (4)
Case B: Uncertain b4¼C5C4 3.0e3.5 4.0e4.5 3.0e3.5 1 35e75 25e35 5e7 1
b3¼C4C3 2.5e3.0 3.5e4.0 2.5e3.0 1 75e125 35e50 4e5 2
b2¼C3C2 2.0e2.5 3.0e3.5 2.0e2.5 0 125e675 50e80 3e4 3
b1¼C2C1 1.0e2.0 1.0e3.0 1.0e2.0 0 675e2250 80e115 2e3 4
Indifference threshold 0 0 0 0 10 5 0 0
Preference threshold 1 1 1 0 30 10 1 1
Criterion preference [ [ [ [ Y Y [ Y
Table 5
Class recommendation agreement (in % and ratio) between the MCDA models, based on class with highest CAI. (þ/ ¼higher or lower SMAA-TRI classes compared to
DRSA-based model).
Criteria ranking Appendix Case I: Certain class profiles Appendix Case II: Uncertain class profiles case
7th rank for reaction time (g5) and 8th rank for
reaction temperature (g6)
C 93.3% (28/30 protocols) D 86.0% (26/30 protocols)
þ1 class in 2 cases: protocolt3 1 class in 4 cases: protocolt5
7th rank for reaction temperature (g6) and 8th
rank for reaction time (g5)
E 86.0% (26/30 protocols) F 76.0% (23/30 protocols)
þ1 class in 2 cases: protocolt3
þ1 class in 2 cases: protocolt4
1 class in 4 cases:
protocolt5
2 cases of same index for two classes: protocolt5
[image:8.595.33.552.659.737.2]they are not contingent on the opinion of a specific person or a small group.
This research has shown the benefit of MCDA methods to foster traceable and robust decision support. They enable integration of evaluation criteria of production processes for a typology of nanomaterials in the form of a comprehensive preference-oriented class, enhancing the understandability of the performance of each of them. However, it needs to be mentioned that these models are not substitutes for quantitative assessment tools that can cover the whole life cycle impact of nanomaterials. They are rather powerful instruments that could include the results of such tools in the form of criteria to allow a comprehensive understanding of the envi-ronmental as well as sustainability impacts of nanomaterials.
It is also worthy highlighting that the use of different MCDA methods for the same case study has the added benefit of providing multiple facets of the potentials of decision support tools. Within this perspective, the authors have recently proposed a MCDA methodology to study this dataset and classify the nanoparticle synthesis protocols using a value function approach, interestingly supplying the same pattern of recommendations as the DRSA-based and ELECTRE-DRSA-based models (Kadzinski et al., 2016).
4. Conclusions
There is currently a vital need for decision support models in the area of nanosynthesis to improve the understanding of the
comprehensive implications that it can have on the environment, the economy and the society as well. MCDA processes and methods have received growing interest from the scientific community because of their capabilities to develop such models and clearly condense the results in the form of a ranking, classification or performance score.
In this paper, the contribution and impact that MCDA methods can have in the synthesis of silver nanoparticles has been shown through (i) the development of an ELECTRE-based model providing uncertainty-characterized performance classes of synthesis pro-cesses for silver nanoparticles and (ii) the concordance assessment as well as evaluation of decision support synergies of its recom-mendations with those of a comparable model based on the DRSA approach (Cinelli et al., 2015).
The research objectives were achieved through a three-phase procedure that integrated part of the results from an experts’ sur-vey with another MCDA method. Firstly, an ordinal ranking of the evaluation parameters was derived from the relative priorities of a comprehensive framework of sustainability evaluation criteria for nanoproducts presented in another paper recently (Cinelli et al., 2016). Secondly, a suitable method capable of providing a deci-sion recommendation comparable with the one of the DRSA-based model was identified. This was the SMAA-TRI, an MCDA method specifically tailored to supply uncertainty-characterized classifi ca-tions. The integration of criteria rankings and SMAA-TRI method led to another model, called ELECTRE-based model to derive
Scheme 1.Performance of test protocolt1, matching rules from DRSA-based model and recommendation of performance class based on standard classification scheme (a¼number
of protocols that support the rule;b¼percentage of protocols that satisfy the conditions of the rule and are assigned to the class or union of classes) (adapted from (Cinelli et al.,
Scheme 2.Performance of test protocolt3, matching rules from DRSA-based model and recommendation of performance class based on standard classification scheme (a¼number
of protocols that support the rule;b¼percentage of protocols that satisfy the conditions of the rule and are assigned to the class or union of classes) (adapted from (Cinelli et al.,
[image:10.595.68.522.66.408.2]2015)).
Table 6
Performance oft1with respect to the class profiles of ELECTRE-based model and resulting share of CAI (case for reducing agent (g1)>capping agent (g2)>solvent (g3)).
Class profiles
g1 g2 g3 g4 g5 g6 g7 g8
CAI Reducing
agent
Capping
agent Solvent
Local resource
use
ReacƟon Ɵme (seconds)
Tempera-ture (Celsius)
Equipment
type Size range
Case A: Certain
Class very
high (5) t1 t1 t1 t1 t1 81%
b4 = Very
high - high
Renewable – primary
Renewable – waste
Renewable
– primary Yes 50 30
S rring ≤ 5 minutes
0 ≤ par cle size ≤ 30
nm Class high
(4) t1 6%
b3 = High -
medium
Renewable – primary
Renewable – primary
Renewable
– primary Yes 100 40 S rring
0 ≤ par cle size ≤ 60
nm Class
medium (3) t1 t1 13%
b2 =
Medium - low
Biodegrada ble polymer
Renewable – primary
Biodegrada ble polymer
No 400 60
Microwave – sealed
vessel (> 300 W)
30 < par cle size ≤ 60
nm Class low
(2)
b1 = Low -
very low Synthe c
Biodegrada ble polymer
Synthe c No 1500 95 Conven on al
0 < par cle size ≤ 100
nm Class very
probabilistically characterized quality classes for the same test protocols with which the DRSA-based model was trialled with. A key strength of this model, from a decision support perspective, is the possibility of not imposing specific weights vectors on the criteria and the capacity of providing robust conclusions.
The last research stage entailed comparing the decision rec-ommendations from the two models to assess their concordance and discuss the decision support synergies of these decision sup-port tools. This was achieved by comparing the classification for
five test protocols from the model based on DRSA with those derived by the one based on ELECTRE, adopting different criteria weights and discriminatory class profiles to account for input data variability. Out of 120 classifications comparisons, the overall cor-respondence reached a remarkable level of just under 86%, whereas it varied between 76.0% and 93.3% depending on the settings of the analysis.
This multidisciplinary research confirmed the beneficial com-plementary use of MCDA methods to aid criteria aggregation in a traceable and understandable format. DRSA method enriches the decision support by means of decision rules which substantiate the classification with previously stored knowledge in the form of simple “if … then …” connectors, whereas SMAA-TRI employs parsimonious information on preferences to lead to robust con-clusions according to traceable modelling constraints. These po-tentials can be particularly useful in research domains characterized by conflicting criteria, such as LCA, life cycle costing (LCC) and social LCA (SLCA), where alternatives excel on some in-dicators while underperform on others, and for this reason multiple objectives must be addressed to reach a decision recommendation as transparent as possible.
Disclaimer
The views expressed in this article are those of the authors and do not necessarily represent the views or policies of the U.S. Environmental Protection Agency. Any mention of trade names or
commercial products does not constitute endorsement or recom-mendation for use.
Acknowledgements
The authors would like to express their gratitude to Dr. Miłosz Kadzinski and Dr. Tommi Tervonen for their constructive feedback provided during the preparation of this article. The work of Marco Cinelli was supported by the Institute of Advanced Study from the University of Warwick under the Early Career Fellowship scheme in award number IAS/ECF/250452/15. Marco Cinelli, Stuart R. Coles and Kerry Kirwan gratefully acknowledge the funding from the UK Engineering and Physical Sciences Research Council, WMG Department of the University of Warwick (UK) (grant number EP/ K503204/1), the“CL4W”, Cleaning Land for Wealth, project (grant number EP/K026216/1) and the Innovative Manufacturing Global Research Priority at the University of Warwick (UK).
Abbreviations
CAI Class Acceptability Indices DMs Decision-Makers
ESI Electronic Supplementary Information GCP Green Chemistry Principles
LCA Life Cycle Assessment LCC Life Cycle Costing RA Robustness Analysis SLCA Social Life Cycle Assessment
SMAA Stochastic Multi-Criteria Acceptability Analysis
Appendix A. Supplementary data
[image:11.595.75.529.91.344.2]Supplementary data related to this article can be found athttp:// dx.doi.org/10.1016/j.jclepro.2017.06.113.
Table 7
Performance oft3with respect to the class profiles of ELECTRE-based model and resulting share of CAI (case for reducing agent (g1)>capping agent (g2)>solvent (g3)).
Class profiles
g1 g2 g3 g4 g5 g6 g7 g8
CAI Reducing
agent
Capping
agent Solvent
Local resource
use
ReacƟon
Ɵme (seconds)
Tempera-ture (Celsius)
Equipment
type Size range
Case A: Certain
Class very
high (5) t3
b4= Very high - high
Renewable – primary
Renewable – waste
Renewable
– primary Yes 50 30
S rring ≤ 5 minutes
0 ≤ par cle size ≤ 30
nm Class high
(4)
b3= High -medium
Renewable – primary
Renewable – primary
Renewable
– primary Yes 100 40 S rring
0 ≤ par cle size ≤ 60
nm Class
medium (3) t3 t3 t3 23%
b2= Medium - low
Biodegrada ble polymer
Renewable – primary
Biodegrada
ble polymer No 400 60
Microwave – sealed
vessel (> 300 W)
30 < par cle size
≤ 60 nm
Class low (2) t3 t3 t3 t3 77%
b1= Low
-very low Synthe c
Biodegrada
ble polymer Synthe c No 1500 95
Conven on al
0 < par cle size ≤ 100
nm Class very
References
Akadiri, P.O., Olomolaiye, P.O., 2012. Development of sustainable assessment criteria for building materials selection. Eng. Constr. Archit. Manag. 19, 666e687. Bates, M.E., Larkin, S., Keisler, J.M., Linkov, I., 2015. How decision analysis can further
nanoinformatics. Beilstein J. Nanotechnol. 6, 1594e1600.
Bergeson, L.L., 2013. Sustainable nanomaterials: emerging governance Systems. ACS Sustain. Chem. Eng. 1, 724e730.
Bouyssou, D., Marchant, T., Pirlot, M., Tsoukias, A., Vincke, P., 2006. Problem Formulation and Structuring: the Decision Aiding Process, Evaluation and De-cision Models with Multiple Criteria: Stepping Stones for the Analyst. Springer US, Boston, MA, pp. 19e65.
Canis, L., Linkov, I., Seager, T.P., 2010. Application of stochastic multiattribute analysis to assessment of single walled carbon nanotube synthesis processes. Environ. Sci. Technol. 44, 8704e8711.
Changseok, H., Joel, A., Suresh, C.P., Rachel, F., Polycarpos, F., Byrne, J.A., Patrick, S.M.D., Hyeok, C., Wenjun, J., Kevin, O.S., Dionysios, D.D., 2013. Green Nanotechnology: Development of Nanomaterials for Environmental and Energy Applications, Sustainable Nanotechnology and the Environment: Advances and Achievements. American Chemical Society, pp. 201e229.
Cinelli, M., Coles, S.R., Kirwan, K., 2014. Analysis of the potentials of multi criteria decision analysis methods to conduct sustainability assessment. Ecol. Indic. 46, 138e148.
Cinelli, M., Coles, S.R., Nadagouda, M.N., Błaszczynski, J., Słowinski, R., Varma, R.S., Kirwan, K., 2015. A green chemistry-based classification model for the synthesis of silver nanoparticles. Green Chem. 17, 2825e2839.
Cinelli, M., Coles, S.R., Sadik, O., Karn, B., Kirwan, K., 2016. A framework of criteria for the sustainability assessment of nanoproducts. J. Clean. Prod. 126, 277e287. Dahl, J.A., Maddux, B.L.S., Hutchison, J.E., 2007. Toward greener nanosynthesis.
Chem. Rev. 107, 2228e2269.
Dias, L.C., 2007. A note on the role of robustness analysis in decision-aiding pro-cesses. In: Roy, B., Aloulou, M.A., Kalaï, R. (Eds.), Rubustness in OR-DA. LAM-SADE, Paris, pp. 53e70.
Dias, L.C., Antunes, C.H., Insua, D.R., 2012. Dealing with uncertainty in Decision Support Systems: recent trends 2000e2011. Intell. Decis. Technol. 6, 245e264. Dias, L.C., Climaco, J.N., 2000. Additive aggregation with variable interdependent
parameters: the VIP analysis software. J. Oper. Res. Soc. 51, 1070e1082. Dias, L.C., Mousseau, V., 2003. IRIS: a DSS for multiple criteria sorting problems.
J. Multi Criteria Decis. Anal. 12, 285e298.
Dimitras, A.I., Słowinski, R., Susmaga, R., Zopounidis, C., 1999. Business failure prediction using rough sets. Eur. J. Oper. Res. 114, 263e280.
Domingues, A.R., Marques, P., Garcia, R., Freire, F., Dias, L.C., 2015. Applying multi-criteria decision analysis to the life-cycle assessment of vehicles. J. Clean. Prod. 107, 749e759.
Duan, H., Wang, D., Li, Y., 2015. Green chemistry for nanoparticle synthesis. Chem. Soc. Rev. 44, 5778e5792.
Dubey, S.P., Lahtinen, M., Sillanp€a€a, M., 2010. Green synthesis and characterizations of silver and gold nanoparticles using leaf extract of Rosa rugosa. Colloids Surf. A Physicochem. Eng. Aspects 364, 34e41.
Eason, T., Meyer, D.E., Curran, M.A., Upadhyayula, V., 2011. Guidance to Facilitate Decisions for Sustainable Nanotechnology. EPA/600/R-11/107. U.S.
Environ-mental Protection Agency. https://cfpub.epa.gov/si/si_public_record_report.
cfm?dirEntryId¼238589(Accessed 22 September 2016).
Feijoo, S., Gonzalez-García, S., Moldes-Diz, Y., Vazquez-Vazquez, C., Feijoo, G., Moreira, M.T., 2017. Comparative life cycle assessment of different synthesis routes of magnetic nanoparticles. J. Clean. Prod. 143, 528e538.
Figueira, J., Mousseau, V., Roy, B., 2005. ELECTRE methods. In: Figueira, J., Greco, S., Ehrgott, M. (Eds.), Multi Criteria Decision Analysis: State of the Art Surveys. Springer, New York, pp. 133e162.
Gilbertson, L.M., Zimmerman, J.B., Plata, D.L., Hutchison, J.E., Anastas, P.T., 2015. Designing nanomaterials to maximize performance and minimize undesirable implications guided by the Principles of Green Chemistry. Chem. Soc. Rev. 44, 5758e5777.
Hebbalalu, D., Lalley, J., Nadagouda, M.N., Varma, R.S., 2013. Greener techniques for the synthesis of silver nanoparticles using plant extracts, enzymes, bacteria, Biodegradable polymers, and microwaves. ACS Sustain. Chem. Eng. 1, 703e712. Iba~nez-Fores, V., Bovea, M.D., Perez-Belis, V., 2014. A holistic review of applied methodologies for assessing and selecting the optimal technological alternative from a sustainability perspective. J. Clean. Prod. 70, 259e281.
Kadzinski, M., Cinelli, M., Ciomek, K., Coles, S.R., Nadagouda, M.N., Varma, R.S.,
Kirwan, K., 2016. Co-constructive development of a green chemistry-based model for the performance assessment of nanoparticles synthesis. Eur. J.
Oper. Res.http://dx.doi.org/10.1016/j.ejor.2016.10.019.
Karn, B., 2008. The road to green nanotechnology. J. Ind. Ecol. 12, 263e266. Karn, B., Wong, S.S., 2013. Ten Years of Green Nanotechnology. In: Sustainable
Nanotechnology and the Environment: Advances and Achievements. American Chemical Society, pp. 1e10.
Kavitha, K.S., Syed, B., Rakshith, D., Kavitha, H.U., Yashwantha, R.H.C., Harini, B.P.,
Satish, S., 2013. Plants as green source towards synthesis of nanoparticles. Int. Res. J. Biol. Sci. 2, 66e76.
Kaviya, S., Santhanalakshmi, J., Viswanathan, B., Muthumary, J., Srinivasan, K., 2011. Biosynthesis of silver nanoparticles using citrus sinensis peel extract and its antibacterial activity. Spectroch. Acta Part A Mol. Biomol. Spectrosc. 79, 594e598.
Kou, J., Bennett-Stamper, C., Varma, R.S., 2013. Green synthesis of noble nanometals (Au, Pt, Pd) using glycerol under microwave irradiation conditions. ACS Sustain. Chem. Eng. 1, 810e816.
Luque, R., 2013. Sustainable nanomaterials: a greener future avenue? Mater. Sci. Nanotechnol. 1, 1e2.
Mata, M.T., Martins, A.A., Costa, A.V.C., Sikdar, K.S., 2015. Nanotechnology and sustainability - current status and future challenges. In: Vaseashta, A. (Ed.), Life Cycle Analysis of Nanoparticles. Risk, Assessment, and Sustainability. DEStech Publications, pp. 271e306.
Matus, K.J.M., Hutchinson, J.E., Peoples, R., Rung, S., Tanguay, R., 2011. Green Nanotechnology Challenges and Opportunities. American Chemical Society. Merad, M., Verdel, T., Roy, B., Kouniali, S., 2004. Use of multi-criteria decision-aids
for risk zoning and management of large area subjected to mining-induced hazards. Tunn. Undergr. Space Technol. 19, 125e138.
Meyer, D.E., Upadhyayula, V.K.K., 2014. The use of life cycle tools to support decision making for sustainable nanotechnologies. Clean. Techn Environ. Policy 16, 757e772.
Munda, G., 2016. Multiple criteria decision analysis and sustainable development. In: Greco, S., Ehrgott, M., Figueira, R.J. (Eds.), Multiple Criteria Decision Analysis: State of the Art Surveys. Springer New York, New York, NY, pp. 1235e1267. Naidu, S., Sawhney, R., Li, X., 2008. A methodology for evaluation and selection of
nanoparticle manufacturing processes based on sustainability metrics. Environ. Sci. Technol. 42, 6697e6702.
Patete, J.M., Peng, X., Koenigsmann, C., Xu, Y., Karn, B., Wong, S.S., 2011. Viable methodologies for the synthesis of high-quality nanostructures. Green Chem. 13, 482e519.
Pati, P., Sean, M., Vikeseland, P., 2014. Life cycle assessment of“green”nanoparticle synthesis methods. Environ. Eng. Sci. 31, 410e420.
Pourzahedi, L., Eckelman, M.J., 2015. Comparative life cycle assessment of silver nanoparticle synthesis routes. Environ. Sci. Nano 2, 361e369.
Pourzahedi, L., Zhai, P., Isaacs, J.A., Eckelman, M.J., 2017. Life cycle energy benefits of carbon nanotubes for electromagnetic interference (EMI) shielding applica-tions. J. Clean. Prod. 142 (Part 4), 1971e1978.
Rowley, H.V., Peters, G.M., Lundie, S., Moore, S.J., 2012. Aggregating sustainability indicators: beyond the weighted sum. J. Environ. Manag. 111, 24e33. Roy, B., Słowinski, R., 2013. Questions guiding the choice of a multicriteria decision
aiding method. EURO J. Decis. Process. 1, 69e97.
Sala, S., Ciuffo, B., Nijkamp, P., 2015. A systemic framework for sustainability assessment. Ecol. Econ. 119, 314e325.
Senjen, R., 2009. Challenges and Opportunities to Green Nanotechnologies,
Nano-technologies in the 21st Century. European Environmental Bureau.http://www.
bef.lt/fileadmin/Publications/2009-NanoBrochureNo1-WEB_Eng.pdf (Accessed 13 March 2016).
Singh, R.K., Murty, H.R., Gupta, S.K., Dikshit, A.K., 2012. An overview of sustainability assessment methodologies. Ecol. Indic. 15, 281e299.
Słowinski, R., Greco, S., Matarazzo, B., 2009. Rough sets in decision making. In: Meyers, A.R. (Ed.), Encyclopedia of Complexity and Systems Science. Springer New York, New York, NY, pp. 7753e7787.
Słowinski, R., Zopounidis, C., Dimitras, A.I., 1997. Prediction of company acquisition in Greece by means of the rough set approach. Eur. J. Oper. Res. 100, 1e15. Stark, W.J., Stoessel, P.R., Wohlleben, W., Hafner, A., 2015. Industrial applications of
nanoparticles. Chem. Soc. Rev. 44, 5793e5805.
Tervonen, T., Figueira, J.R., Lahdelma, R., Dias, J.A., Salminen, P., 2009a. A stochastic method for robustness analysis in sorting problems. Eur. J. Oper. Res. 192, 236e242.
Tervonen, T., Lahdelma, R., 2007. Implementing stochastic multicriteria accept-ability analysis. Eur. J. Oper. Res. 178, 500e513.
Tervonen, T., Linkov, I., Figueirs, J.R., Steevens, J., Chappel, M., Merad, M., 2009b. Risk-based classification system of nanomaterials. J. Nanoparticle Res. 11, 757e766.
Tobiszewski, M., Orłowski, A., 2015. Multicriteria decision analysis in ranking of analytical procedures for aldrin determination in water. J. Chromatogr. A 1387, 116e122.
Varma, R.S., 2014. Journey on greener pathways: from the use of alternate energy inputs and benign reaction media to sustainable applications of nano-catalysts in synthesis and environmental remediation. Green Chem. 16, 2027e2041. Varma, R.S., 2016. Greener and sustainable trends in synthesis of organics and
nanomaterials. ACS Sustain. Chem. Eng. 4, 5866e5878.