© 2019, IRJET | Impact Factor value: 7.211 | ISO 9001:2008 Certified Journal
| Page 5607
Prediction of Fine-Grained Air Quality for Pollution Control
Vinod Kumar K
1, Sheba Selvam
2, Suraj S
3, Chandrashekar S S
41,3,4
B.E Student, Dept of Computer Science and Engineering, RRCE, Bengaluru, Karnataka, India
2
Associate Professor, Dept. of Computer Science and Engineering, RRCE, Bengaluru, Karnataka, India
---***---Abstract -
Air pollution is one of the serious problems in theurban cities, where particulate matter (PM2.5) has greater effect on the humans than any other impure substances. This PM2.5 is dangerous part of the air pollution due its adverse effects on humans as well as other living things, it can penetrate into the lungs or alveoli and blood vessels and causes serious diseases such as DNA mutation, respiratory diseases, heart attack and even leads to lung cancer. Even small amount of PM 2.5 in air is extremely dangerous. Hence, predicting the air quality is very important to the urban cities as it helps to take necessary measures and control it. The proposed work aims at predicting air quality by using Random forest algorithm with air quality index provided by the respected government agencies. In this work we make use of feature analysis for prediction process to provide more effective and general model. The proposed model considers various data taken for number of hours and days from Bangalore, India. This dataset will be helpful for training the system, later we compute real time datasets for predicting the pollution levels in that city, this predicted information will provide crucial information which will be helpful for pollution control and management.
Key Words: Data Pre-processing, Particulate matter, Air quality Index, Random forest algorithm, Air pollution.
1. INTRODUCTION
Particulate matter is one of the dangerous parts of the air pollution. It is a composition of both liquid and solid particles; it may occur naturally due to volcanoes and fire burst or by human involvement such as power plants and vehicle emission. It occurs in various sizes; each size of PM has its own impact on humans as well as nature. It can easily penetrate into human blood, lungs and causes lot of diseases such as lung cancer and heart attack. Its presence in the air is causing lot of problems in the urban cities and it is increasing rapidly. Hence controlling or removing the particulate matter from air is the most important topics in the urban cities. Our study will provide crucial information of air pollution levels in a particular city by using AQI, so that it will be helpful for pollution control.
Air Quality Index (AQI) is used to find out pollution levels in cities by government agencies, each country has different air quality index. It is basically used to provide information about the health risks to the public as the AQI increases. The levels of health concern can be identified as good, moderate,
unhealthy, hazardous etc. Our study aims at providing this health concern levels based on the presence of particulate matter in the air. Machine learning techniques can be used for the prediction process along with AQI.
Machine learning is a scientific way of getting computers to act without giving explicit instruction, it learns and improves based on experience of the previous data or instructions. It is the most emerging and commonly used field across the world. It is considered as a part of artificial intelligence, and data mining techniques lies with in machine learning. Machine learning algorithms are used across various applications. Usually machine learning algorithms works on a simple data called training data. This data is nothing but previously existing data collected and stored for long period, data mining techniques is used for the collection of the data. Machine learning system is trained based on this training data; the systems accuracy increases with the increase of training data. Machine learning tasks can be classified as supervised learning and unsupervised learning.
Supervised learning provides a function that maps from input to output, based on training examples. Where training examples consists of labelled training data. Supervised learning includes classification and regression. Random forest, Support vector machines are some of the most common algorithms of supervised learning.
Unsupervised learning is a kind of machine learning algorithm which make use of unlabeled data to draw some patterns or inferences. Unsupervised learning includes clustering and association. K-means algorithm is the most common algorithm used for clustering where as Apriori algorithm for association.
In the proposed work, random forest algorithm is used for the prediction of the air pollution levels in the cities, as random forest is more accurate and performs both classification and regression.
2. LITERATURE SURVEY
© 2019, IRJET | Impact Factor value: 7.211 | ISO 9001:2008 Certified Journal
| Page 5608
quality 2 days prior, large number of metallurgical data wascollected from Beijing, China for this work. Y.-F. Xing et. al [3] in his work, shown what are all the affects that could cause on humans due to the presence of PM2.5
[image:2.595.33.558.598.766.2]In air and also stated some of the deadly diseases which could occur when it penetrates into human body. H. Zhang et. al [4] proposed a first ever three-dimensional particulate matter tracking system, which required collection of lot of three-dimensional samples.in Hangzhou, China for which they used low cost systems to collect the samples. C. Zhao et. al [5] also in his work used neural networks for prediction of pollution in the air, which was able to provide accurate air quality prediction. M. M. Dedovic et. al [6] presented the prediction of PM10 using ANN, which was able to give the concentrations of PM10 in Sarajevo. Yu. Zheng et. al [7], Yu. Zheng et. al [10] a bigdata approach is considered for the prediction of fine- grained air pollution for which samples from 43 cities of China was taken and was able to predict before two days. H.-P. Hsieh et. al [8] presents how to deduce real time air quality for a particular location based on data from scant air monitoring stations, and also tries to identify the locations in which air quality monitoring stations has to be implemented based on the human population and other aspects, they carried their experiments in Beijing, China. K. P. Singh et. al [9] worked to predict urban air quality in Lucknow India, and also to find out sources from which the pollutants are occurring, for that they have taken metallurgical samples of around five years. L. Li, X. Zhang et. al [11] proposed methods for interpolation of the air pollution, the main purpose is to identify the presence of the PM2.5 in air, they have also identified population effected by this air pollutants in USA. A. P. Tai et. al [12] was able to find out what are the effects and climate changes caused due to the presence of particulate matter in the air surrounding US. M. Cai, Y et. al [13] also proposed prediction of the concentration of the PM in the air based on hourly basics in the urban cities, an ANN approach was implemented for this study.
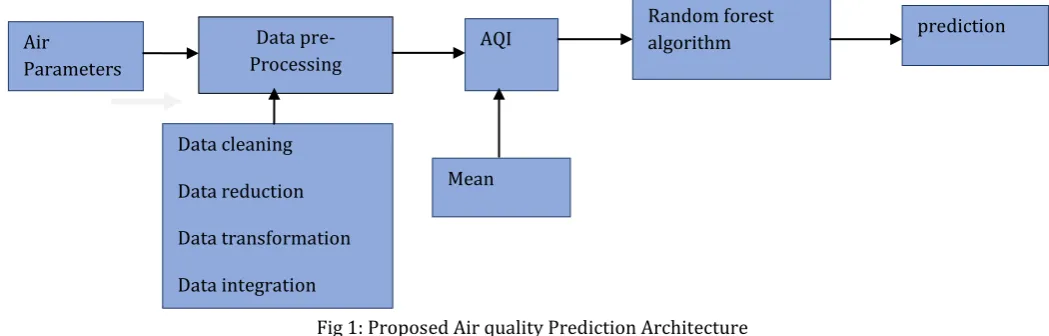
Fig 1: Proposed Air quality Prediction Architecture
3. PROPOSED WORK
As we all know air pollution is one of the major problems in urban cities, where the particulate matter is the most dangerous part of air pollution which effects human than any other substances. In order to overcome these problems many existing papers are available but those were not very much effective due to some disadvantages of the algorithms and the methods used. In this paper we are considering all the papers disadvantages and determining the best result above all the existing systems. Our proposed work consists of Data pre-processing, Random Forest algorithm and Air quality index, air Quality prediction architecture is shown in fig.1
3.1 Data Pre-processing
The datasets which are collected for the air pollution prediction are in raw data format in which there contains some unwanted data which are not necessary for analysis as it is not feasible. In order to overcome this problem data pre-processing is used where the clean dataset is obtained from the raw datasets, this process is known as data pre-processing. The data preprocessing involves several steps in order to convert a raw data into a reduced clean data of small datasets. Data pre-processing involves four steps, it includes.
• Data Cleaning
Data cleaning is the process of identifying and removing null values or unwanted values.
• Data Integration
Many different data are compared in order to get a combined view is known as data integration.
• Data Transformation
In Data transformation process data are transformed from one format to another format.
• Data Reduction
Data Reduction techniques can be applied to reduce the number of parameters of air in the dataset, so that we can use only the required attributes for the prediction.
Data pre-Processing Air
Parameters
AQI
Data cleaning
Data reduction
Data transformation
Data integration
Mean
Random forest
© 2019, IRJET | Impact Factor value: 7.211 | ISO 9001:2008 Certified Journal
| Page 5609
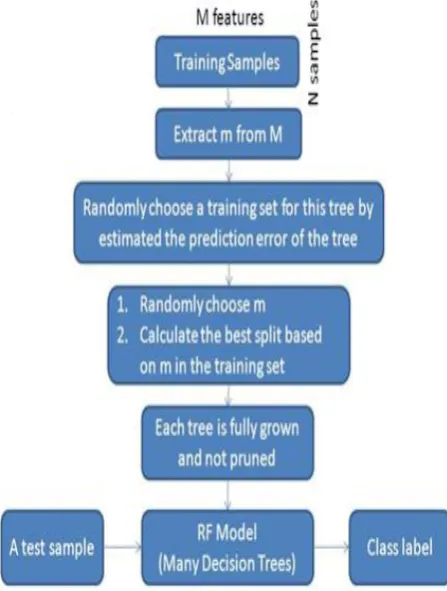
3.2 Random Forest Algorithm
The random forest algorithm is used to perform both classification and also the regression problems. Even without the hyper-parameter better results can be obtained due to its flexibility and easy to use applications. The random forest algorithm is a machine learning algorithm used for classification tasks; it is the supervised classification algorithm. As the name suggest, the algorithm creates forest with number of trees.
[image:3.595.306.562.306.573.2]The more robust the forest looks like with the greater number of trees. In the same way higher number of trees in the forest gives high accuracy results in random forest classifier. The multiple decision trees are built by random forest and merges them together to get a stable prediction with more accuracy. Proposed Random forest architecture is shown in fig 2.
Fig 2: Random forest architecture
3.3 Air quality index
Air Quality Index (AQI) is the set of tables which tells about the category and its range which is used to predict air pollution and health impacts on humans. It is implemented by the government in order to tell people how much the air is polluted. The increase in AQI will result in
more impact on human health which may led to severe health issues.
Table 1, is the AQI category and its range, where six categories are named based on seven pollutants and for all the categories certain range has been fixed to predict the result. The seven pollutants and its ranges are as shown in the table 1, such as PM2.5, PM10, NO2, O2, CO2, NH2 and PB. Based on these pollutants comparing with different categories we can determine better results. This is basically used by government agencies to determine pollution and to communicate with people about the pollution. Good air quality pertains to the degree in which it is clean, clear and free from pollutants such as smoke, dust and gaseous contents and also described by many air indicators.
Table 1: Represents the AQI category and its range
AQI PM2.5 PM10 NO2 O2 CO2 NH2 Pb
(0-50) 0-50 0-30 0-40 0-50 0-1.0 0-200 0.5
good
(51-100) 51-100 31-60 41-80 51-100 1.1-2.0 201-400 0.5-1
satisfactory
(101-200) 101-250 61-90 81-180 101-168 2.1-10 401-800 1.1-2.0
moderate
(201-300) 251-350 91-120 181-280 169-208 10-17 800-1200 2.1-3.0
poor
(301-400) 351-430 121-250 281-400 209-748 17-34 1200-1800 3.1-3.5
Very poor
(401-500) 430+ 250+ 400+ 748+ 34+ 1800+ 3.5+
Severe
4. RESULT AND DISCUSSION
We are obtaining datasets from a government organisation website known as “Central pollution control board” from this we can obtain different datasets of various air parameters which exists in the air. Only specific parameters are considered to predict the pollution, where individual parameters have their own distinct range of values for predicting pollution.
[image:3.595.48.272.332.628.2]© 2019, IRJET | Impact Factor value: 7.211 | ISO 9001:2008 Certified Journal
| Page 5610
AQI is used for labelling the datasets, for that maximumoperator system is selected.
AQI=Max (I1, I2, I3…. In)
Where I1, I2 represents maximum values for each row of data sets, a new set of AQI column is obtained which is used for labelling.
[image:4.595.316.550.99.343.2]We apply labelled datasets to Random forest classifier for the prediction. It is a type of classifier in which it can be used for both classification and regression problems, which form the majority of current machine learning systems. There also exists hyperparameters as a decision tree or a bagging classifier. Fig 3 shows how the random forest algorithm works.
Fig 3: Merging of trees in random forest
It is also very flexible to use even without hyperparameters tuning. It is widely used algorithm because of its simplicity and the fact that it can be used for both classification and regression tasks.
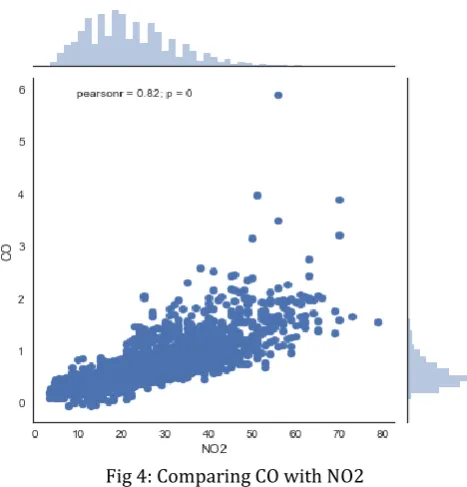
We can analyse different parameters of the air by comparing it by using graph, several graphs will be obtained. All the histograms and scattered plots from the graphs are combined which will give comparative results between parameters. Figure 4 below shows the comparison between CO and NO2.
[image:4.595.47.278.299.495.2]Fig 4: Comparing CO with NO2
Table 2: Result comparison of ST-DNN and Random forest Algorithm
Mean
Prediction
ST-DNN Hour 1 Hour 2 Hour 3 Hour 4 Hour5 Hour 6
+elevation 3.402 5.308 6.213 6.782 7.269 7.668
-elevation 3.410 5.310 6.215 6.774 7.270 7.669
Random Forest Algorithm
Hour 1 Hour 2 Hour 3 Hour 4 Hour5 Hour 6
+elevation 3.112 4.985 5.869 6.468 6.927 7.352
-elevation 3.117 4.980 5.871 6.470 6.929 7.355
Table 2, tabulates the result of the existing model where the ST-DNN (Spatio-Temporal Deep Neural Network), which considers both the time and space series variation at some given location. The results were obtained considering the PM 2.5 air attributes which are the small molecules present in air and these PM 2.5 causes human diseases. In the proposed system random forest algorithm and AQI method is used, when differentiated between random forest and ST-DNN, the results which is obtained are better than ST-DNN.
[image:4.595.305.561.389.590.2]© 2019, IRJET | Impact Factor value: 7.211 | ISO 9001:2008 Certified Journal
| Page 5611
CONCLUSION
Air pollution is a major problem in all developing cities, which causes lot of impact on human health. In this paper, air quality prediction system using Air quality Index and random forest algorithm is proposed. The basic idea is to find out the amount of particulate matter present in the air which will be further helpful to find out pollution levels in a particular city. For this large number of datasets is gathered from a particular city for example, Bengaluru. Feature selection is used to reduce the number of attributes and obtain only relevant attributes which will be helpful for prediction. We use data mining techniques for extracting and cleaning the datasets and AQI is used for labelling it. The datasets are used for training the random forest system and new set of datasets is used for testing the system. Finally, real time data is used for predicting the pollution levels. The predicted output will provide crucial information which will be helpful for pollution control in urban cities. This proposed system provides highly reliable and accurate prediction. Further research can be done to improve the system to predict more accurately and user interfaces can be implemented to provide the predicted information to individuals for pollution control and management. Furthermore, studies well be able to find out the origin of the polluted particles and experiments will provide solutions to the pollution control in urban cities.
REFERENCES
[1]. Zhu, D.; Cai, C.; Yang, T.; Zhou, X. A Machine Learning Approach for Air Quality Prediction: Model Regularization and Optimization. Big Data Cogn. Comput. 2018, 2, 5. [2]. Ping-Wei Soh, Jia-Wei Chang, And Jen-Wei Huang. Adaptive Deep Learning-based Air Quality Prediction Model Using the Most Relevant Spatial-Temporal Relations. 2018.
[3]. Y.-F. Xing, Y.-H.Xu,M.-H.Shi,andY.-X.Lian,“The impact of pm2.5 on the human respiratory system,” Journal of Thoracic Disease, vol. 8, no. 1, 2016.
[4]. Y. Hu, G. Dai, J. Fan, Y. Wu, and H. Zhang, “BlueAer: A fine-grained urban PM2.5 3D monitoring system using mobile sensing,” in Proc. IEEE Int. Conf. Comput. Commun. (INFOCOM), San Francisco, CA, USA, Jul. 2016, pp. 1–9.
[5], C. Zhao, M. van Heeswijk, and J. Karhunen, “Air quality forecasting using neural networks,” in Proc. IEEE Symp. Series Comput. Intell. (SSCI), Athens, Greece, Dec. 2016, pp. 1–7.
[6]. M. M. Dedovic, S. Avdakovic, I. Turkovic, N. Dautbasic, and T. Konjic, “Forecasting PM10 concentrations using neural networks and system for improving air quality,” in Proc. XI Int. Symp. Telecommun. (BIHTEL), Sarajevo, Bosnia and Herzegovina, Oct. 2016, pp. 1–6.
[7]. Y. Zheng, X. Yi, M. Li, R. Li, Z. Shan, E. Chang, and T. Li, “Forecasting fine-grained air quality based on big data,” in Proceedings of the 21th ACM SIGKDD International Conference on Knowledge Discovery and Data Mining. New York, NY, USA: ACM, 2015, pp. 2267–2276.
[8]. H.-P. Hsieh, S.-D. Lin, and Y. Zheng, “Inferring air quality for station location recommendation based on urban big data,” in Proceedings of the 21th ACM SIGKDD International Conference on Knowledge Discovery and Data Mining, ser. KDD ’15, 2015, pp. 437–446.
[9]. K. P. Singh, S. Gupta, and P. Rai, “Identifying pollution sources and predicting urban air quality using ensemble learning methods,” Atmospheric Environment, vol. 80, pp. 426 – 437, 2013.
[10]. Y. Zheng, F. Liu, and H.-P. Hsieh, “U-air: When urban air quality inference meets big data,” in Proceedings of the 19th ACM SIGKDD International Conference on Knowledge Discovery and Data Mining,ser. KDD ’13, 2013, pp. 1436– 1444.13
[11]. L. Li, X. Zhang, J. Holt, J. Tian, and R. Piltner, “Spatiotemporal interpolation methods for air pollution exposure,” in Symposium on Abstraction, Reformulation, and Approximation, 2011.
[12]. A. P. Tai, L. J. Mickley, and D. J. Jacob, “Correlations between fine particulate matter (pm 2.5) and meteorological variables in the united states: Implications for the sensitivity of pm 2.5 to climate change,” Atmospheric Environment, vol. 44, no. 32, pp. 3976–3984, 2010.