© 2019, IRJET | Impact Factor value: 7.211 | ISO 9001:2008 Certified Journal
| Page 1610
Improved Electrical Power Supply to Trans-Amadi Industrial Layout,
Port Harcourt
Bariakwaadoo S. Bere
1, Dikio C. Idoniboyeobu
2, Sepiribo L. Braide
31,2,3
Department of Electrical Engineering Rivers State University, Port Harcourt, Nigeria
---***---
ABSTRACT - An analysis was performed for the improvement of electrical power supply to Trans-Amadi Industrial Layout, Port Harcourt, which consists of ten feeders operating at 33KV level. Transmission and distribution transformer voltage ratings from supply station to the study case was used. Network layout from the supply to the study case with transmission and distribution feeders data were also considered. Electrical Transient Analyser Program (ETAP) was not left out. The ETAP was employed for modelling and simulation of the network. Analysis using voltage drop equations was carried out, determination of transformer loading level on different feeder and buses was also done. Also adequate design was done for the proper size (rating) of the capacity bank to be placed in the network for improvement. It was found out that the buses were operating within acceptable voltage limits. The airport and Rumuodomaya transformers with loading level of 127 and 74.76 percent respectively were overloaded. The Akani, Rainbow and Trans-Amadi transformers with 5.377, 6.49 and 1.821percent loading conditions respectively were critically underloaded. It was concluded that the system needed improvement. Therefore, it was suggested that additional transformer should be added to the overloaded feeders or buses, the existing 300KVA capacity transformers on the network should be upgraded to 500KVA. It was also recommended that critically underloaded 500KVA capacity transformer should be replaced by 300KVA capacity and that the power factor of the network be improved by placement of capacitor bank.Key words: Analysis, capacitor bank, Electrical power, improvement, supply, transformer loading, voltage drop
1.1 Introduction
According to [1], Electrical power supply system is a network of conductor and associated equipment’s over which electrical energy is transmitted from the generating station to the consumer. This may be divided into two major parts, the transmission system and distribution system.
Transmission network may further be divided into primary and secondary while distribution network may be divided into primary, secondary and tertiary. In A.C power system there may be change in voltage at each point, the change may be affected by transformation at substation; this means that there may be several operating voltage in the transmission or distribution system, these includes: Primary transmission voltage: 330KV, Secondary transmission voltage: 132KV, Primary distribution voltage: 33KV, Secondary distribution voltage: 11KV, Tertiary distribution: 415V (L – L), 240V (L –N) (as in the Nigeria power network).
That is consumer taking large amounts of power in excess of 500KVA may be supplied directly from the secondary distribution network. The bulk of consumers are however supplied from the tertiary distribution system because the load is much smaller. The conductors in line distribution system are either feeders, distributors or service main.
Evidently, electric power is produced at the generating station and it is transmitted to users through a complex network of individual components transmission lines, transformers and switching devices.
1.2 Statement of the Problem
The growing rate of population and industrialization in the Trans-Amadi Industrial Layout, Port Harcourt with attendant increase in the demand for electrical power consumption has led to decline in the transmission level voltage of 132/33KV and distribution level voltage of 33/11KV with the associated evidences of power system outages (black-out), power system collapse and failure, over-congestion of the already overstressed lines.
1.3 Aim of the Study
© 2019, IRJET | Impact Factor value: 7.211 | ISO 9001:2008 Certified Journal
| Page 1611
1.4 Objectives of the StudyThis study considers the existing network representing the activities at Trans-Amadi Industrial Layout (load centre) for purpose of:
Modelling the network via the E-tap platform
Simulating the network via the E-tap platform with respect to the existing network Implementing collected data into conventional equation for purpose of investigation
Conducting a validation test between the existing state of power system overload network and the proposed improvement for an effective performance
1.5 Scope of the Study
This study provide the analysis and design of improved power supply system to Trans-Amadi Industrial Layout of 132KV transmission network from Afam generating station to industrial layout at Trans-Amadi
2.0 LITERATURE REVIEW
2.1 Load Flow Analysis on IEEE Bus Systems
The Newton-Raphson or the Gauss Seidel methods are conventional techniques for solving the load flow problem. With the load flow studies, the voltage magnitudes and phase angles can be ascertained at each bus in the steady state and can be computed within a defined limit [2].Once the bus voltage magnitudes and their angles are computed using the load flow, the real and reactive power flow through each line can also be computed. It can be concluded that increasing the reactance loading will result in an increased voltage regulation.
2.2 Power Flow Analysis of Power System using the Power Perturbation
The Power Flow analysis is a fundamental tool in power system analysis. Some opinions are of the view that most of the existing algorithms were developed to reduce the computational burden by reducing the number of equations, approximating the Jacobian matrix and other variables A new power flow technique known as the perturbation theory of which its objective is that it attempts to enhance the convergence rate by partially linearizing the power flow equation where more attention is on the voltage magnitude and the phase angle in each iterations [3].
2.3 The General Purpose Fast Decoupled Power Flow
The general purpose fast decoupled power flow, almost all the relevant known numerical methods used for solving the nonlinear equations have been applied in developing power flow mode is. Among various methods, power flow models based on the Newton- Raphson (NR) method have been found to be most reliable. Many decoupled polar versions of the NR method have been attempted for reducing the memory requirement and computation time involved for power flow solution. Among decoupled versions, the fast decoupled load flow (FDLF) model developed [4].
2.4 The Fast Decoupled Load Flow Algorithm
A diakoptic theory based on fast decoupled load flow algorithm which is suitable for distributed computing. If computations for different subsystems of an integrated system are done concurrently using a number of processors load flow can be done in a shorter time. Moreover, if distributed processing is done real time, data is to be smaller data base is to be updated locally at regular intervals. Transmission of data over long distance to the central processing computer can thus be reduced [5].
2.5 Fast Decoupled Load Flow Method for Distribution Systems with High R/X Ratios Lines
© 2019, IRJET | Impact Factor value: 7.211 | ISO 9001:2008 Certified Journal
| Page 1612
2.6 Power Flow Solution Algorithm for Radial Distribution FeedersIn the view of [7], power flow algorithm is designed for transmission network rather than distribution networks. They said, in literature much of the algorithm have been modified. However, the solution methods have advantages and disadvantages such as time consuming and storage capacity, divergence, etc. The requirement for reliability, accuracy, less storage capacity and fast algorithm play an important role in any new proposed distribution load flow analysis. In their work, they mentioned that, new distribution power flow algorithm must consider large systems so that the storage capacity needs to be low to achieve the solution fast and in less iteration for both offline and online application [8].
2.7 Analysis of Power Losses due to Distributed Generation Increase on Distribution System
[9] presented a study on the influence of penetration level and concentration of distributed generation on power losses in the ‘network. Steady-stale power flow analysis was used to analyze the power losses variation for a variety of distributed generation penetration. Based on the power flow analysis, voltage profile and power losses due to the power plants injection were determined. The influence of various technologies used was also considered, including the use of wind power, photovoltaic and micro-hydro power plants. Four different scenarios to determine the effect of dispersed generation injection were proposed, starting from the original grid in the first scenario, being added with photovoltaic plant (0.5MVA), in the second scenario the addition of wind power plant (0.5MVA) to the grid, in the third and fourth scenario was the addition of micro-hydro power plant (1x2.5MVA) to the grid. In their work, they considered scenarios are based on the existing potential of the plants in the network system under consideration, that is the Sengkaling Substation, From the point of view of power, loss analysis, Scenario 4 also results in the smallest loss compared to the other scenarios. The least favorable losses reduction is given by Scenario using the wind power plant injection, although the injection of renewable energy power plants in this study in general is proven to improve the voltage profile and reduction of power losses in the system [2].
2.8 A Combined Approach for Loss Reduction and Voltage Profile Improvement in Distribution Systems
According to [10], in their work, the active and, reactive power losses on and voltage profile improvement in distribution system with installation of distributed generations and capacitor banks were considered. By installation DGs in distribution systems, different objectives can be pursued. The main objective of their paper is reducing the active and reactive power losses, and also improving the voltage profile. In their paper, they used sensitivity analysis to optimize the placement of DG. To reduce the search ace and more influence on the voltage profile improvement, he proposed method was applied on candidate buses. Also, to optimal sizing of DG, the plant growth simulation algorithm (PGSA) was used. For optimal placement of capacitor banks, the ETAP software was also used to improve the voltage profile and reduce power losses. To evaluate the effectiveness of the proposed method, the method was tested on the 33-bus IEEE test system were the results presented was satisfying.
3.0 MATERIALS AND METHODS
3.1 Materials Used in the Analysis
The materials used for analysis in this research work include:
(i) The Transmission and Distribution Transformers voltage rating of 132/33KV, 33/11KV and 11/0.415KV etc. respectively are required, from the supply station (Afam) to the study case (Trans-Amadi Industrial Layout). (ii) The network layout from the power supply to the study-case for purpose of simulation and analysis.
(iii) Transmission/distribution feeder data for purpose of investigation and analysis.
(iv) Electrical transient analyzer tool (ETAP 12.6) for purpose of simulation of the existing case study.
© 2019, IRJET | Impact Factor value: 7.211 | ISO 9001:2008 Certified Journal
| Page 1613
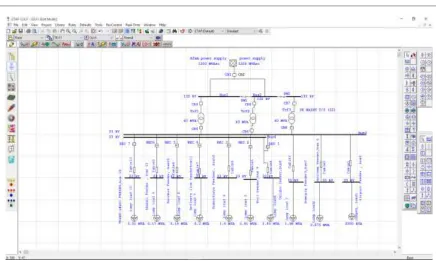
Figure 3.1: Existing Study Case (Trans-Amadi Industrial Layout of Oginigba)
3.2 Methods used for Improving the System
The methods needed for improvement in order to effectively enhance via distribution network will consider the application of:
(i) Power-flow through lines and voltage drop equations
(ii) The surge impedance loading (SIL) in terms of Transmission/Distribution line loading equation, was adopted which considers the loading of the network existing case and verify whether there is a natural reactive power balance occurrence.
(iii) The research method also considers the integration of reactive power compensation devices, especially (FACTS devices) depending on the nature of the line and its identified deficiency and need, thereby enhancing and providing the study case network performance. These will generally reduce the network losses and mismatches, in order to restore healthy voltage profile structure.
3.3 Mathematical Models used for Computation and Analysis
The voltage drop due to each section on the line is given as:
Voltage drop (Vd) √ ( ) ⁄ (3.1)
Where:
Vd: Voltage drop (V)
IL: Load Current (Amp).
R: The resistance of the conductor (Ω)
X: The reactance of the conductor (Ω)
© 2019, IRJET | Impact Factor value: 7.211 | ISO 9001:2008 Certified Journal
| Page 1614
pfV 3
KW IL
(3.2)
Where KW = Active power in watts
V = Distribution voltage in volts
Pf = Power factor of load
The relationship between active power (KW) and apparent power (KVA) is given by
pf
KVA
KW
(3.3)The determination of required number of conductor per phase is given by
No. of conductor (d)/per phase =
Conductor
of
Capacity
Carrying
Current
Current
Load
(3.4)The receiving end voltage at any point is given by
d S R
V
V
V
(3.5)Where VR = Receiving end voltage in volts
VS = Sending end voltage in volts
Vd = Voltage drop along the line
The percentage voltage operating level (%VOL) is given by
1
100
V
V
V
%
S R
OL
(3.6)The percentage voltage regulation (%VR) is given by
1
100
V
V
V
V
%
R R S
R
(3.7)The reactive power of the load is given by
2 2
(
KW
)
)
KVA
(
VKVAR
(3.8)For a transformer we have the following models:
The base impedance
( ) (3.9)
And the actual impedance = Percentage (%) Impedance x Base impedance
(3.10)
The loading condition of the transformer is given as:
Loading condition =
© 2019, IRJET | Impact Factor value: 7.211 | ISO 9001:2008 Certified Journal
| Page 1615
Or
% loading condition =
(3.12)
Where;
: The MVA rating of transformer
The operating MVA from power flow calculation
But
S
VA
3
V
3ph
I
L (3.13)Where
V
3ph
Three phase voltage in volts
L
I
Load current in Amps3.4 Analysis and Computation
As a general rule for the entire analysis (1-10), the following variables or figures (which were taken from PHED) were applicable. in all;
(i) Power factor of load pf = 0.80
(ii) Distribution voltage (V) = 33,000V (33KV)
Only transformer rating varies for each bus or feeder as follows: Airport feeder (Bus 5) = Rumuola feeder (Bus 7) = Oyigbo feeder (Bus 8) = Trnas-Amadi feeder (Bus 14) = 500KVA and Buses 6, 9, 10, 11, 12 and 13 = 300KVA
3.4.1 Analysis 1 (for Airport Feeder)
The details of this analysis are shown in the following analysis
Case 1: Determination of load current (IL1) for substation while relying on the following data:
(i) Transformer rating in KVA = 500 (ii) Active power (KW): to be determined
pf
v
3
KW
I
L
But
KVA
pf
KW
KW
500
0
.
80
400
KW
A
7478
.
8
26
.
45
400
8
.
0
KV
33
3
400
I
L1
Case 2: Determination of Required number of conductor per phase becomes;
No. of conductor (d) =
conductor
of
capacity
carrying
Current
current
Load
.
No
1
0486
.
0
180
7478
.
8
Case 3: Determination of voltage drop at point 1 becomes;
section line of Length 1000 phase conductor/ of No. I ) sin X cos R ( 3
V L1
1
d
© 2019, IRJET | Impact Factor value: 7.211 | ISO 9001:2008 Certified Journal
| Page 1616
Let1000
phase
conductor/
of
No.
I
0
)
sin
X
cos
R
(
3
K
L11
Where
R
0
.
272
;
X
0
.
112
,
cos
0
.
8
,
s
in
0
.
6
No. of conductor per phase = 1 and ILI=8.7478A
So
0
.
004315
1000
31500
.
4
1000
1
7477
.
8
)
6
.
0
112
.
0
8
.
0
272
.
0
(
732
.
1
K
1
Section
Line
of
Length
K
V
d1
1
2500
004315
.
0
10
.
7875
V
Case 4: Determination of receiving end voltage at point 1 is given as
VR1 = Sending end voltage (Vs1) - voltage drop (Vd1)
9892
.
32
7875
.
10
33000
The voltage at the receiving end = 32.9892V
Case 5: % voltage operating level =
99
.
97
%
33000
9892
.
32
100
V
V
1 S 1R
Case 6: Determination of percentage voltage regulation at point 1 is given as
% Voltage Regulation =
1
100
voltage
end
Receiving
voltage
end
Receiving
voltage
end
Sending
100
9892
.
32
9892
.
32
000
.
33
9892
.
32
08
.
1
100
9892
.
32
10
7875
.
10
3
.
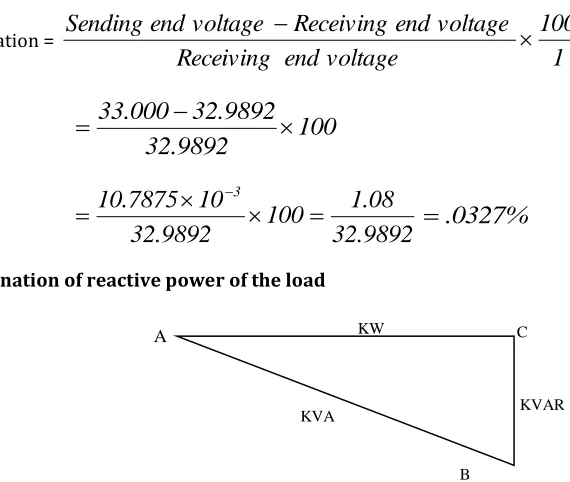
0327
%
Case 7: Determination of reactive power of the load
Applying Pythagoras theorem
( ) ( ) ( )
( ) ( )
A KW C
KVA
B
[image:7.612.108.393.419.660.2]KVAR
Figure 3.2: The power triangle showing the active power, apparent power, reactive power
© 2019, IRJET | Impact Factor value: 7.211 | ISO 9001:2008 Certified Journal
| Page 1617
√( ) ( )
Where KVA = 500KVA, KW = 400
√( ) ( ) √
√
Therefore for:
Case 1: Load Current (IL1) = 8.7478A
Case 2: No. of Conductor (d1) = 1No.
Case 3: Voltage drop (Vd1) = 10.7875V
Case 4: Receiving end voltage (VR1) = 33000 - 10.7875 = 32.9892V
Case 5: % voltage operating level = 99.97%
Case 6: % voltage regulation = 0.0327%
Case 7: Reactive power = 300KVAR
3.4.2 Analysis 2 (Abuloma Feeder)
Using the same method in as in article 3.4.1 (Analysis 1) we have
Case 1: Load Current (IL2) = 5.2486A
Case 2: No. of Conductor per phase (d2) = 1No.
Case 3: Voltage drop (Vd2) = 5.178V
Case 4: Receiving end voltage (VR2) = 33000 – 5.1789 = 32.9948V
Case 5: Percentage voltage operating level = 99.98%
Case 6: Percentage voltage regulation = 0.1576%
Case 7: Reactive power = 180KVAR
3.4.3 Analysis 3 (Rumuola Feeder)
[
Using the same method in as in article 3.4.1 (Analysis 1) we have
Case 1: Load Current (IL3) = 8.7478A
Case 2: No. of Conductor per phase (d3) = 1No.
Case 3: Voltage drop (Vd3) = 11.00325V
Case 4: Receiving end voltage (VR3) = 33000 – 11.00325 = 32.989V
Case 5: Percentage voltage operating level = 99.97%
© 2019, IRJET | Impact Factor value: 7.211 | ISO 9001:2008 Certified Journal
| Page 1618
Case 7: Reactive power = 300KVAR3.4.4 Analysis 4 (Oyigbo Feeder)
Using the same method in as in article 3.4.1 (Analysis 1) we have
Case 1: Load Current (IL4) = 8.7478A
Case 2: No. of Conductor per phase (d4) = 1No.
Case 3: Voltage drop (Vd4) = 17.26V
Case 4: Receiving end voltage (VR4) = 33000 – 17.26 = 32.9827V
Case 5: Percentage voltage operating level = 99.95%
Case 6: Percentage voltage regulation = 0.0524%
Case 7: Reactive power = 300KVAR
3.4.5 Analysis 5 (Woji Feeder)
Using the same method in as in article 3.4.1 (Analysis 1) we have
[
Case 1: Load Current (IL5) = 5.2486
Case 2: No. of Conductor per phase (d3) = 1No.
Case 3: Voltage drop (Vd5) = 8.8026V
Case 4: Receiving end voltage (VR5) = 33000 – 8.8026 = 32.991V
Case 5: Percentage voltage operating level = 99.97%
Case 6: Percentage voltage regulation = 0.0273%
Case 7: Reactive power = 180KVAR
3.4.6 Analysis 6 (Rumuodomaya Feeder)
Using the same method in as in article 3.4.1 (Analysis 1) we have
Case 1: Load Current (IL6) = 5.2486A
Case 2: No. of Conductor per phase (d6) = 1No.
Case 3: Voltage drop (Vd6) = 7.767V
Case 4: Receiving end voltage (VR3) = 33000 – 7.767 = 32.9922V
Case 5: Percentage voltage operating level = 99.98%
Case 6: Percentage voltage regulation = 0.0236%
© 2019, IRJET | Impact Factor value: 7.211 | ISO 9001:2008 Certified Journal
| Page 1619
3.4.7 Analysis 7 (Refinery Feeder)Using the same method in as in article 3.4.1 (Analysis 1) we have
Case 1: Load Current (IL7) = 5.2486A
Case 2: No. of Conductor per phase (d7) = 1No.
Case 3: Voltage drop (Vd7) = 10.356V
Case 4: Receiving end voltage (VR7) = 33000 – 10.356 = 32.989V
Case 5: Percentage voltage operating level = 99.97%
Case 6: Percentage voltage regulation = 0.0315%
Case 7: Reactive power = 180KVAR
3.4.8 Analysis 8 (Rainbow Feeder)
Using the same method in as in article 3.4.1 (Analysis 1) we have
Case 1: Load Current (IL8) = 5.2486A
Case 2: No. of Conductor per phase (d8) = 1No.
Case 3: Voltage drop (Vd8) = 10.356V
Case 4: Receiving end voltage (VR8) = 33000 – 10.356 = 32.989V
Case 5: Percentage voltage operating level = 99.97%
Case 6: Percentage voltage regulation = 0.0315%
Case 7: Reactive power = 180KVAR
3.4.9 Analysis 9 (Akani Feeder)
Using the same method in as in article 3.4.1 (Analysis 1) we have
Case 1: Load Current (IL9) = 5.2486A
Case 2: No. of Conductor per phase (d9) = 1No.
Case 3: Voltage drop (Vd9) = 10.8738V
Case 4: Receiving end voltage (VR9) = 33000 – 10.8738 = 32.989V
Case 5: Percentage voltage operating level = 99.97%
Case 6: Percentage voltage regulation = 0.033%
Case 7: Reactive power = 180KVAR
3.4.10 Analysis 10 (Trans-Amadi Feeder)
Using the same method in as in article 3.4.1 (Analysis 1) we have
© 2019, IRJET | Impact Factor value: 7.211 | ISO 9001:2008 Certified Journal
| Page 1620
Case 2: No. of Conductor per phase (d10) = 1No.Case 3: Voltage drop (Vd10) = 13.808V
Case 4: Receiving end voltage (VR10) = 33000 – 13.808 = 32.986V
Case 5: Percentage voltage operating level = 89.96%
Case 6: Percentage voltage regulation = 0.042%
Case 7: Reactive power = 300KVAR
3.5 Evaluation of Transformer Loading Condition
Scenario 1 (Airport Feeder, Bus 5) – Load Point 1
Loading Level of the Airport feeder (Bus 5) =
1
.
27
500
89
.
635
Percentage Load Level = 127% overload
Improvement on Scenario 1
Since the (Airport feeder or Bus 5) transformer is overloaded, (more than 70% which is the load limit in this work)
We share total load into two i.e. 635.89/2 = 317.945
Improved Load Level (ILL1) =
89
500
945
.
317
Percentage of Improved Load Level = 63.589%
Therefore, the load on Airport feeder should be divided into two feeders having 500KVA transformer capacity to avoid overloading one.
Scenario 2: Load Point 2
Loading Level (LL2) =
10
.
31627
300
8817
.
94
Percentage Loading Level = 31.627%. It is optimum, because it is < 70%
Scenario 3: Load Point 3
Load Level (LL3) =
0
.
46512
KVA
500
KVA
56
.
232
Percentage Loading Level = 46.512% = <70%, it is optimum
Scenario 4: Load Point 4
Load Level (LL4) =
0
.
22167
KVA
500
KVA
8358
.
110
© 2019, IRJET | Impact Factor value: 7.211 | ISO 9001:2008 Certified Journal
| Page 1621
Scenario 5: Load Point 5Load Level (LL5) =
0
.
6282
KVA
300
KVA
464
.
188
Percentage Load Level = 62.82 which is less than 70%, therefore the transformer loading level is within safety range.
Scenario 6: Load Point 6
Load Level (LL6) =
0
.
7475
KVA
300
KVA
266
.
224
Percentage Load Level = 74.75 which is greater than 70%, therefore the transformer loading level is out of safety limit.
Improvement
To improve power supply to load point 6, we replace the 300KVA with 500KVA.
Improved Load Level (ILL6) =
0
.
4485
KVA
500
KVA
266
.
224
Percentage Improved Load Level = 44.85 which is less than 70%, so it is okay.
Scenario 7: Load Point 7
Load Level (LL7) =
0
.
5755
KVA
300
KVA
650
.
172
Percentage Load Level = 57.55% which is less than 70%; therefore it is safe.
Scenario 8: Load Point 8
Load Level (LL8) =
0
.
0649
KVA
300
KVA
4838
.
19
Percentage Load Level = 6.49% the transformer is critically underloaded
Scenario 9: Load Point 9
Load Level (LL9) =
0
.
05376
KVA
300
KVA
1298
.
16
Percentage Load Level = 5.376% the transformer is underloaded
Improvement
Both transformer at load point 8 and load point 9are critically underloaded, which means economic waste to have two separate transformers dedicated to the feeders.
Combing or joining the load on both feeders to one transformer (300KVA) gives;
Improved Load Level =
0
.
1187
KVA
300
KVA
)
1298
.
16
4838
.
19
© 2019, IRJET | Impact Factor value: 7.211 | ISO 9001:2008 Certified Journal
| Page 1622
Percentage Improved Load Level = 11.87%
Scenario 10: Load Point 10
Load Level (LL10) =
0
.
01821
KVA
500
KVA
10505
.
9
Percentage Loading Level = 1.821 the transformer is underloaded or underutilized.
Therefore, a lower capacity of 300KVA is used which gives
Improved Load level =
0
.
03035
KVA
300
KVA
10505
.
9
Percentage Improved Load Level = 3.035%
3.6 Design of Capacitor Bank’s Size (or Rating)
The calculation and analysis of the size of the capacitor bank is a major tool for power system improvement, therefore power electronic controller will help control, regulate and compensate power loss, reactive power losses and voltage profile inadequacy etc. This means that power system deviation/shortage need to be calculated for purpose of compensation.
Case 1
The following data were collected:
(i) System capacity: 3x60MVA at 33KV bus bar (ii) Present load (maximum) = 30MW
(iii) Present power factor (pf) = 80.5%
(iv) Present MVA (demand) =
Factor
Power
Present
MW
Load
Present
=
37
.
267
805
.
0
MW
30
Case 2: Proposed Power Factor, being raised to 90%
(v) Desired MVA2 (demand) =
Factor
Power
Desired
MW
Present
=
33
.
333
90
.
0
30
(vi) Determination of the capacitor size required to compensate for voltage drop is given as: MVAR = size of capacitor required
From power triangle in fig. 3.2
2 1 2
1
MW
MVA
MVAR
for 80.5% power factorwhere MVA1 = 37.267
MW = 30
MVAR 37.2672 302 22.109
1
© 2019, IRJET | Impact Factor value: 7.211 | ISO 9001:2008 Certified Journal
| Page 1623
2 2 2
2
2
MVA
MW
MVAR
for 90% proposed power factorWhere MVA2 = 33.333
MW2 = 30
MVAR
2
33
.
333
2
30
2
14
.
529
Hence, capacitor ratio, (size) becomes
MVAR1 – MVAR2
= 22.109 – 14.529 = 7.56MVAR 8MVAR
Case 3: Determination of tabular result (correction factor) that will correct or improve the existing power factor with proposed or desired factor (according to appendix 26)
- The corresponding factor of the existing power factor of 80.5% to 90% is given as 21
- Multiple factor is given as
0
.
21
100
21
100
table
from
Value
- The Capacitor Bank rating becomes = multiplication factor x MW (demand) = 0.21 x 30 = 6.3 MVAR
- Therefore, recommended capacitor bank rating = 8MVAR
4.0 RESULTS AND DISCUSSION
4.1 Results
-Chart 4.1: Presentation of Existing Case Study of a single line diagram of Oginigba area of Trans-Amadi (Simulated Network)
© 2019, IRJET | Impact Factor value: 7.211 | ISO 9001:2008 Certified Journal
| Page 1624
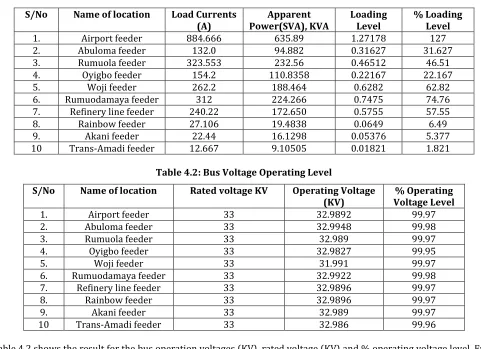
Table 4.1: Transformer Operating Level ConditionTable 4.2: Bus Voltage Operating Level
S/No Name of location Rated voltage KV Operating Voltage
(KV) Voltage Level % Operating
1. Airport feeder 33 32.9892 99.97
2. Abuloma feeder 33 32.9948 99.98
3. Rumuola feeder 33 32.989 99.97
4. Oyigbo feeder 33 32.9827 99.95
5. Woji feeder 33 31.991 99.97
6. Rumuodamaya feeder 33 32.9922 99.98
7. Refinery line feeder 33 32.9896 99.97
8. Rainbow feeder 33 32.9896 99.97
9. Akani feeder 33 32.989 99.97
10 Trans-Amadi feeder 33 32.986 99.96
[image:15.612.73.537.100.262.2]- Table 4.2 shows the result for the bus operation voltages (KV), rated voltage (KV) and % operating voltage level. From the result the buses are operating within the acceptable limits, apart from one or two buses which is a little below:
Table 4.3: Load Point of each Feeder bus with Existing and Improved Voltage Profiles
Load Point (LP) Voltage Profile 1 Voltage Profile 2
load point 1 95.89 98.77
load point 2 94.78 97.99
load point3 82.9 85.99
load point 4 89.88 93.89
load point 5 87.9 94.7
load point6 88.56 98.76
load point 7 87.08 90.45
load point 8 89.67 86.79
load point9 90.46 89.89
load point 10 92.05 94.08
S/No Name of location Load Currents
(A) Power(SVA), KVA Apparent Loading Level % Loading Level
1. Airport feeder 884.666 635.89 1.27178 127
2. Abuloma feeder 132.0 94.882 0.31627 31.627
3. Rumuola feeder 323.553 232.56 0.46512 46.51
4. Oyigbo feeder 154.2 110.8358 0.22167 22.167
5. Woji feeder 262.2 188.464 0.6282 62.82
6. Rumuodamaya feeder 312 224.266 0.7475 74.76
7. Refinery line feeder 240.22 172.650 0.5755 57.55
8. Rainbow feeder 27.106 19.4838 0.0649 6.49
9. Akani feeder 22.44 16.1298 0.05376 5.377
[image:15.612.145.467.490.663.2]© 2019, IRJET | Impact Factor value: 7.211 | ISO 9001:2008 Certified Journal
| Page 1625
-Chart 4.2: The Composite Bar Plot showing the Distribution of Existing and Improved Voltage Profile with respect to Load Points
-Chart 4.3: Rated and Operating Voltages Versus Feeder Names
70 75 80 85 90 95 100
load point 1load point 2load point3load point 4load point 5load point6load point 7load point 8load point9load point 10 v
o l a g e
p r o f i l e
load point
load points and voltage profile
voltage profile -1
voltage profile-2
32.975 32.98 32.985 32.99 32.995 33 33.005
R a t e d
v o l t a g e & o p e r a t i n
g
v o l t a g e
(
k v
)
Feeder Names and Location
Rated and operating voltages versus
Feeders names
Rated votage
© 2019, IRJET | Impact Factor value: 7.211 | ISO 9001:2008 Certified Journal
| Page 1626
4.2Discussion- Chart 4.1 gives the single line diagram of the simulated network of the study case (Trans-Amadi Industrial Layout). It consists of 132/33KV transmission sub-station and ten 33KV feeders with their respective installed capacity loads. The pink (or faint red) and red colours on the Trans-Amadi feeder (bus) and Airport feeder (bus) respectively show a deviation from normalcy.
- Table 4.1 shows transformer operating level condition. The percentage loading level of the Airport and Rumuodomaya feeders are 127% and 74.76% respectively which are greater than 70% (statutory limit for this case), therefore both transformers are overloaded. Also, considering the Rainbow, Akani and Trans-Amadi feeders with loading level of 6.49%, 5.377% and 1.821% respectively. It can be concluded that these transformers are critically underloaded and therefore amount to some economic waste.
- Table 4.2 shows the results for the bus voltage operating level reflecting rated voltage in KV, operating voltage in KV and percentage operating voltage level. From the result, it can be deduced that the buses are operating within the acceptable voltage limits.
- Table 4.3 shows the load point of each feeder bus with existing improved voltage profiles. The existing voltage profile is voltage profile 1, while the improved voltage profile is the voltage profile 2.
- Chart 4.2 is the composite bar plot showing the distribution of the existing and improved voltage profile with respect to load point.
- Chart 4.3 shows a clear composite representation of the rated and operating voltages with respect to the feeder locations. The results reveal the deviation between the two capacities, it can be strongly corrected by the placement of capacitor bank in order to enhance effective and efficient power system reliability in the study case.
5.0 CONCLUSION AND RECOMMENDATIONS
5.1 Conclusions
The research considered the existing state of electric power network for Trans-Amadi industrial layout, Port Harcourt as a load centre which consists of Ten (10) 33KV distribution feeders; Airport, Abuloma, Oyigbo, Woji, Rumuodamaya, Refinery, Rainbow, Akani, Rumuola and Trans-Amadi. The supply is taken from Afam power generating station. The distribution network is modeled and simulated in Electrical Transient Analyzer Program (ETAP) with load flow results. Power flow analysis was also conducted for the existing conditions by using collected data in conventional mathematical models with subsequent investigations. A validation test between the existing state of the power system overload network and the proposed improvement was also done for effective performance.
The results were analyzed under voltages buses, overloaded transformers, feeders and substations were identified. That is voltages level below 95% was taken as under voltages and transformer loading above 70% are taken as overload. This analysis helps to determine the voltage drop, active power and reactive power. The integration of capacitor bank was formulated to clear the affected area of the buses/feeder in order to have better reliability of power flows.
5.2 Contribution to Knowledge
1. This study applies (i) upgrading of transformers (ii) placement of relief transformers (iii) merging of feeders - combination of more than one feeder load to a transformer to improve the electric power distribution network for Trans-Amadi Industrial Layout.
2. This study also helps to improve on the electric power distribution system by the application of capacitor bank placement as optimization technique to better the power factor and voltage profile of the network in the study case.
5.3 Recommendations
From the research done, the following recommendations are highlighted to ensure optimum performance and reliability of the distribution system.
1. Additional transformer should be added to the overloaded feeder or buses like the Airport feeder.
2. The existing 300KVA capacity transformers on the network (where it is overloaded like the Rumuodomaya feeder) should be upgraded to 500KVA.
© 2019, IRJET | Impact Factor value: 7.211 | ISO 9001:2008 Certified Journal
| Page 1627
4. There should be combination of two or more feeders to one transformer where such feeder loads are extremely low to avoid economic waste. E.g. Akani and Rainbow feeders should be connected (combined) to same 300KVA for optimum transformer loading.
5. Having identified some mismatch in the network, the power factor needs to be improved by making the power factor close to unity.
REFERENCES
[1] Ibe, A.O. (2002). Power system analysis. Odus Press Printers & Publishers. Enugu.
[2] Adeniyi. A. T. (2008). Economic impacts of erratic power supply in Nigeria. Proceedings of National Engineering Conference, 175-181.
[3] Bhowmik, P.S. Bose, S.P. Rajan, D.V. & Deb, S. (2011). “Power flow analysis of power system using power perturbation method”, 2011 IEEE Power Engineering and Automation Conference.
[4] Adeyemo, S. B. (2008). Improving power stability through energy conservation in Nigeria. Proceedings of National Engineering Conference 1(1), 2008, 69- 77.
[5] Anthony, I. P. (2010). Electrical power distribution system”, 6th Edition, Pg. 166-168. Arabian Journal for Science and Engineering, 1- 11.
[6] Amadi, H. N (2015). Impact of power outages on developing countries. Evidence from Rural Households in Niger Delta, Nigeria. Journal of Energy Technologies and Policy.
[7] Aladejare, S.A. (2014). Energy, growth and economic development. A case study of the Nigerian electrical sector. American Journal of Business, Economics and Management.
[8] El-Hawary, M.E. (2007). “A new and fast power flow solution algorithm for radial distribution feeders including distributed generation”, 2007 IEEE International Conference on Systems Man and Cybernetics.
[9] Usman, E. (2014). Man electrocuted while vandalizing transformer in Lagos, Vanguard Newspapers.