Failed immune responses across multiple
pathologies share pan-tumor and circulating
lymphocytic targets
Anne Monette, … , Igor Jurisica, Réjean Lapointe
J Clin Invest. 2019;129(6):2463-2479. https://doi.org/10.1172/JCI125301.
Tumor-infiltrating lymphocytes (TILs) are widely associated with positive outcomes, yet
carry key indicators of a systemic failed immune response against unresolved cancer.
Cancer immunotherapies can reverse their tolerance phenotypes while preserving tumor
reactivity and neoantigen specificity shared with circulating immune cells. We performed
comprehensive transcriptomic analyses to identify gene signatures common to circulating
and TILs in the context of clear cell renal cell carcinoma. Modulated genes also associated
with disease outcome were validated in other cancer types. Through comprehensive
bioinformatics analyses, we identified practical diagnostic markers and actionable targets of
the failed immune response. On circulating lymphocytes, 3 genes (LEF1, FASLG, and
MMP9) could efficiently stratify patients from healthy control donors. From their associations
with resistance to cancer immunotherapies and microbial infections, we uncovered not only
pan-cancer, but pan-pathology, failed immune response profiles. A prominent lymphocytic
matrix metallopeptidase cell migration pathway is central to a panoply of diseases and
tumor immunogenicity, correlates with multi-cancer recurrence, and identifies a feasible
noninvasive approach to pan-pathology diagnoses. The differentially expressed genes we
have identified warrant future investigation into the development of their potential in
noninvasive precision diagnostics and precision pan-disease immunotherapeutics.
Research Article
Immunology
Oncology
Find the latest version:
Introduction
Pan-cancer studies have demonstrated that tumor-infiltrating lymphocytes (TILs) are prognostic determinants of intratumor-al heterogeneity (1). The failure of TILs in discriminating and eliminating neoantigen content from general tissue-specific, tumor-associated, or tumor-selective antigens should reclassify the emergence of cancer as a facet of the failed immune response (FIR). The one-size-fits-all potential for pan-cancer treatment by immune checkpoint blockade (ICB) is being investigated, but a significant fraction of patients do not respond to any single cur-rently available therapies, while others progress or develop resis-tance. To identify TIL phenotypes contributing to responses, pan-cancer studies have correlated epithelial-to-mesenchymal transition and immune activation (2), in which immune activation and CD8+ TIL landscapes are associated with favorable prognostic
genes (3). Pretreatment pan-cancer surveillance of IFN signaling and antigen presentation factors (4) or pan-cancer immunophe-noscore (5) may become adopted by mainstream oncology.
Com-prehensive multi-cancer databases vastly extend our knowledge of tumorigenesis by providing avenues for deciphering diagnos-tic pan-cancer signatures distinguishing tumor types and having prognostic, predictive, and therapeutic potential (6, 7). Integrative pan-cancer analyses elucidate tumor lineage unique signatures (8) and trace metastatic lesions to tissues of origin (9). However, the use of whole tumor data sets as precise scoring determinants of immune inference requires complex deconvolution (10), compli-cated by the influence of tumor expression programs on TILs (11). Although baseline tumor specimens provide a wealth of prospec-tive information (12), their use for routine prediction to response is challenged by specimen sizes, limits imposed by cancer heterogene-ity, and invasiveness and delays from surgical procurement (13). Liq-uid biopsies have the advantage of being easily accessible (14) where circulating tumor cells, DNA (15, 16), and pan-cancer platelets (17) have been investigated for diagnostics. However, their nonspecifici-ties and inabilinonspecifici-ties of pinpointing the nature of primary tumors have delayed adoption of these methods (18). The traceability of circulating immune cells that are targets for immunotherapies should make their shifting phenotypes superior predictive biomarkers. Pan-cancer diag-nostic and predictive biomarkers from circulating effector peripheral blood lymphocytes (PBLs) could mirror neoantigen-specific FIR TIL phenotypes, providing a “peripheral immunoscore” correlating with tumor burden or response to therapies (19, 20).
Tumor-infiltrating lymphocytes (TILs) are widely associated with positive outcomes, yet carry key indicators of a systemic failed immune response against unresolved cancer. Cancer immunotherapies can reverse their tolerance phenotypes while preserving tumor reactivity and neoantigen specificity shared with circulating immune cells. We performed comprehensive transcriptomic analyses to identify gene signatures common to circulating and TILs in the context of clear cell renal cell carcinoma. Modulated genes also associated with disease outcome were validated in other cancer types. Through comprehensive bioinformatics analyses, we identified practical diagnostic markers and actionable targets of the failed immune response. On circulating lymphocytes, 3 genes (LEF1, FASLG, and MMP9) could efficiently stratify patients from healthy control donors. From their associations with resistance to cancer immunotherapies and microbial infections, we uncovered not only pan-cancer, but pan-pathology, failed immune response profiles. A prominent lymphocytic matrix metallopeptidase cell migration pathway is central to a panoply of diseases and tumor immunogenicity, correlates with multi-cancer recurrence, and identifies a feasible noninvasive approach to pan-pathology diagnoses. The differentially expressed genes we have identified warrant future investigation into the development of their potential in noninvasive precision diagnostics and precision pan-disease immunotherapeutics.
Failed immune responses across multiple pathologies
share pan-tumor and circulating lymphocytic targets
Anne Monette,1,2,3,4 Antigoni Morou,1,3 Nadia A. Al-Banna,1,2,5,6 Louise Rousseau,1 Jean-Baptiste Lattouf,1,2,7 Sara Rahmati,8Tomas Tokar,8 Jean-Pierre Routy,9 Jean-François Cailhier,1,2,3,10 Daniel E. Kaufmann,1,3 Igor Jurisica,8,11,12,13 and Réjean Lapointe1,2,3
1University of Montreal Hospital Research Centre, Montreal, Quebec, Canada. 2Montreal Cancer Institute, Montreal, Quebec, Canada. 3Department of Medicine, Faculty of Medicine, University of Montreal, Montreal, Quebec, Canada. 4Lady Davis Institute for Medical Research, Jewish General Hospital, Montreal, Quebec, Canada. 5Faculty of Medicine, McGill University, Montreal, Quebec, Canada. 6Department of Basic Medical Sciences, College of Medicine, QU Health Cluster, Qatar University, Doha, Qatar. 7Department of Surgery, University of Montreal, Montreal, Quebec, Canada. 8Krembil Research Institute, Toronto Western Hospital, Toronto, Ontario, Canada. 9Chronic Viral Illnesses Service and Division of Hematology, McGill University Health Centre, Montreal, Quebec, Canada. 10Nephrology Division, Department of Medicine, Faculty of Medicine, University of Montreal, Montreal, Quebec, Canada. 11Department of Medical Biophysics and 12Department of Computer Science, University of Toronto, Toronto, Ontario, Canada. 13Institute of Neuroimmunology, Slovak Academy of Sciences, Slovak Republic.
Conflict of interest: The authors have declared that no conflict of interest exists. Copyright: © 2019, American Society for Clinical Investigation.
Submitted: October 5, 2018; Accepted: March 19, 2019; Published: May 6, 2019. Reference information: J Clin Invest. 2019;129(6):2463–2479.
The Journal of Clinical Investigation
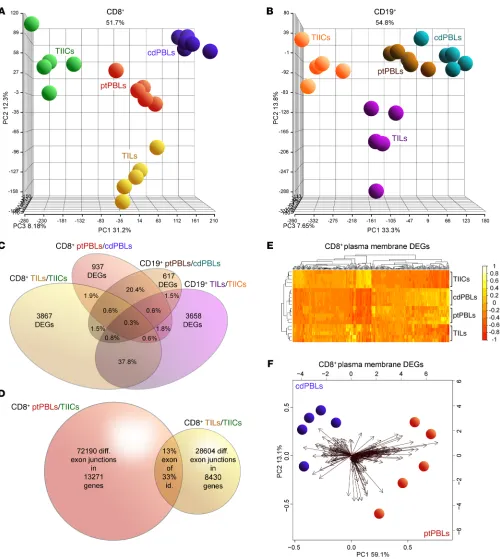
R E S E A R C H A R T I C L EFigure 1. Distinct comprehensive transcriptomics from paired CD8+ and CD19+ profiles from ccRCC blood, tumors and tissues, and control donor blood
isolates. (A and B) PCA demonstrating distinct DEG profiles from comprehensive HTA 2.0 microarray analyses of (A) CD8+ (n = 15) and (B) CD19+ (n = 15)
immune cell subsets from TILs and TIL-Bs, TIICs, and circulating ptPBLs, and cdPBLs (n = 10). (C) Four-way Venn diagram demonstrating percentage
over-laps of DEGs identified by microarrays across different source biospecimens analyzed. (D) Venn diagram showing that ptPBLs have greater numbers of
dif-ferentially represented exon-exon PSR junctions compared with TILs, relative to TIICs from paired CD8+ samples (P < 0.05; ANOVA, Transcriptome Analysis
Console v.3, Affymetrix). Thirteen percent of shared PSR junctions exist between ptPBLs and TILs, representing 33% of total genes common to ptPBLs and TILs having shared isoform identity. (E) GO PM proteins identified by Partek and unsupervised hierarchical clustering algorithm-generated heatmaps
demonstrating that the 4 different CD8+ isolates are stratified according to PM, using log
2 expression values applying the Euclidean distance metric and
complete linkage clustering method (R programming language; R-studio). Heatmaps demonstrate the unsupervised clustering of PBL isolates as most closely related, with TILs and TIICs at their boundaries, suggesting that their profiles may be influenced by the cancer microenvironment. (F) Feasibility of
using PM-associated proteins toward identifying pan-cancer DEGs that can stratify patients is demonstrated by PCA biplots of PM DEGs from CD8+ cdPBL
TILs and ptPBLs relative to TIICs and cdPBLs (Supplemental Fig-ure 2F), totaling 7300 (i.e., CD8+ and CD19+ TIL-Bs/TIICs and
ptPBLs/cdPBLs; 1.5-fold change; P < 0.05) (Supplemental Figure 1). Principal component analyses (PCAs) were generated using the Partek Genomics Suite for all paired CD8+ or CD19+ biospecimens
and PBL controls (Figure 1, A and B). Venn diagrams were gener-ated to demonstrate overlaps in DEGs represented by CD8+ and
CD19+ ptPBLs (20.4%) and TILs (37.8%) (Figure 1C) and to show
overlaps of possible splice junctions generating spliceoforms com-mon to CD8+ ptPBLs and TILs. This was made possible by using
comprehensive HTA 2.0 microarrays (Figure 1D) and suggesting that patient-inherent posttranslational modification programs generating distinct RNA isoforms may also influence the behav-ior of TILs. To assess the feasibility of pursuing DEGs more easily amenable to therapeutic interventions such as ICB (i.e., actionable targets), we used unsupervised clustering and PCA to examine DEGs coding for molecules expressed on the plasma membranes (PMs). These analyses efficiently stratified immune isolates, with the largest differences maintained between TILs and TIICs (Fig-ure 1E) and also permitted efficient stratification of ptPBLs and cdPBLs (Figure 1, E and F).
Prognostic ccRCC DEGs have pan-cancer prognostic potential.
To identify prognostically important ccRCC DEGs, we generated Kaplan-Meier plots and P values for the 7300 significant DEGs using TCGA KIRC RNA-seq and associated clinical data sets (n = 534 tumor, n = 72 healthy control donors). This step resulted in detecting 2257 prognostic DEGs (Supplemental Figure 1). To fur-ther refine prognostic DEGs and find the most feasible actionable targets, we focused on PM-associated proteins, or those having known targeting compounds. Partek and PANTHER Gene Ontol-ogy (GO) were both used to identify PM proteins, ensuring most PM-associated DEGs would be retained. ChEMBL target searches were used to identify proteins with known targeting compounds. Together, these 2 approaches reduced target DEGs to 779, which were then investigated for their pan-cancer potential using more than 11,500 patients with lung, breast, gastric, and ovarian cancer from an online Kaplan-Meier plotter, generating 467 (i.e., 62%) target DEGs with pan-cancer potential. This refined list represent-ed pan-cancer FIR biomarkers, grouprepresent-ed as either (a) agonistic tar-gets decreased in tumors relative to normal tissues and having a positive prognosis or (b) antagonistic targets increased in tumors relative to normal tissues and having negative prognosis (Sup-plemental Figure 1). PCA analyses permitted the visualization of how these pan-cancer FIR-DEGs identified from ptPBLs (Figure 2A and Supplemental Figure 3A) or TILs (Figure 2B and Supple-mental Figure 3B) were distributed across the 5 cancers and how they correlated with each other, and where many were found to be common to both CD8+ TILs and CD19+ TIL-Bs relative to their
TIIC counterparts (Figure 2C; see full gene list in Supplemental Figure 3C). A subset of pan-cancer FIR-DEGs was also found to be common between TILs and ptPBLs (Supplemental Figure 3D).
Correlograms reflected increased correlations between the 5 cancers used to refine for pan-cancer target FIR-DEGs (compare Supplemental Figure 3E and Figure 2D). Because the selected 467 pan-cancer FIR-DEGs were discovered using whole tumor TCGA data sets, we compared percentages of cor-relations between 5 cancers to that of their immune infiltrates We have overcome the limitations of tumor heterogeneity
and biospecimen and biomarker accessibility by identifying cell surface FIR pan-cancer diagnostic and actionable targets circulat-ing PBLs. Clear cell renal cell carcinoma (ccRCC) was used as the primary model for biomarker discovery for several reasons: it fea-tures the highest numbers of differentially expressed genes (DEGs) (21), observed PBL profiles correlate with TIL profiles (22), and its strong yet dysfunctional immunogenicity represents an enigma (23) despite renal cell carcinoma (RCC) trials demonstrating better responses to ICB than other targeting therapies (24).
We performed comprehensive microarray analyses on paired patient CD8+ T cells and CD19+ B cells isolated from ccRCC
tumors (TILs, TIL-Bs), normal tumor-adjacent tissue-infiltrating immune cells (TIICs), PBMCs from patients (patient peripher-al blood lymphocytes [ptPBLs]), and from age-matched heperipher-althy control donors (cdPBLs). DEGs from TILs and ptPBLs were com-pared with The Cancer Genome Atlas (TCGA) Kidney Renal Clear Cell Carcinoma (KIRC) cohort, identifying DEGs associated with patient prognosis. Both cell surface DEGs and DEGs having pre-existing targeting compounds, more amenable to antagonistic or agonistic design or drug repurposing, were retained. ccRCC prog-nostic, pan-cancer DEGs were identified in lung, breast, ovarian, and gastric cancers. A scoring system was implemented to retain DEGs whose expression (a) was restricted to lymphocytes, (b) was supported by immunology and oncology literature, and (c) had sig-nificant protein-protein interactions (PPIs) and gene expression correlations. Top-scoring DEGs were validated on a new indepen-dent RCC cohort, in which a minimum set of 3 DEGs could strat-ify patients. A central DEG, MMP-9, could also stratstrat-ify patients having pan-cancer recurrence. Effects of pan-cancer genes were investigated for splicing defects and used in pathway discovery. Our “blinded” gene discovery pipeline design is supported by identification of DEGs previously reported as biomarkers con-ferring resistance and others slated as novel immunotherapeutic targets. The demonstration that pan-cancer FIR-DEGs are essen-tial for controlling HIV-1 and other microbial infections implicates these as pan-pathology immune biomarkers with diagnostic and therapeutic potential.
Results
Distinct cell surface coding DEG profiles from ccRCC CD8+ and CD19+
PBLs and TILs. To investigate pan-cancer immunity, we performed
comprehensive microarray analyses on matched case-control pairs of CD8+ TILs and CD19+ TIL-Bs from ccRCC tumors, CD8+
and CD19+ TIICs from normal tumor-adjacent tissues, and CD8+
and CD19+ PBLs from patients with ccRCC along with CD8+ and
CD19+ PBLs from matched healthy control donors (Supplemental
The Journal of Clinical Investigation
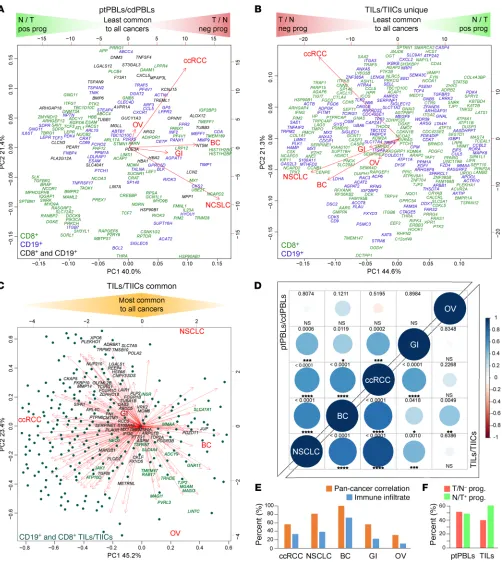
R E S E A R C H A R T I C L EFigure 2. A subset of prognostic ccRCC DEGs have pan-cancer prognostic potential. (A and B) PCAs nominal derivatives of combined modulation of
expres-sion and effects on prognosis to visualize CD8+ and CD19+ DEGs from (A) ptPBLs and (B) TILs with significant gene modulation and effect on prognosis across
the 5 cancers tested. Genes on the far left are more highly expressed in normal tissues than tumors and have positive prognostic effects (N/T pos prog), representing agonistic targets. Genes on the far right are more highly expressed in tumors than normal tissues and have negative effects on prognosis (T/N neg prog), representing antagonistic targets. PCAs also illustrate linkage between gene coexpression and cancer types, in which breast cancer (BC) ptPBLs and NSCLC TILs are most related to other cancers. In (A), all ptPBL DEGs are shown. In (B), DEGs unique to CD8+ TILs or CD19+ TIL-Bs are shown. (C) DEGs common
to CD8+ TILs and CD19+ TIL-Bs are shown, where dark highlighted gene names represent best antagonistic targets, and green highlighted gene names
repre-sent best agonistic targets. (D) Correlograms representing linkage between the 5 cancers from nominal derivatives demonstrating that NSCLC and BC are most
related to ccRCC, independently of patient sample number (Spearman method, coexpression coefficient ladder on right). (E) Graph demonstrating similar
expression patterns of pan-cancer DEGs and genes representing infiltrating immune cell subsets used: CD45, CD3, CD4, CD8, CD20, CD56, and CD68 across pan-cancers (n = 11,577). (F) Graph demonstrating distributions of relative ratios of 483 agonistic vs. agonistic pan-cancer genes, in which TILs have higher
To further refine pan-cancer FIR-DEG targets, nominal deriv-atives (binomial values) were generated to integrate quantitative and nonquantitative, and thus nonharmonizable data sets and analyses, and were used to acquire an overall score represent-ing their (a) coupled expression and effect on overall survival (n = 5 cancers, Kaplan Meier-plotter), (b) coupled RNA and protein (n > 11,500) providing similar trends, suggesting a strong
[image:6.585.44.343.58.335.2]like-lihood that global FIR-DEG signatures were immune based (Figure 2E). Of these 467 pan-cancer FIR-DEGs, proportions of agonistic and antagonistic targets derived from ptPBLs were equal, whereas those derived from TILs had increased agonis-tic target representation (Figure 2F).
Figure 3. Pan-cancer DEGs have extensive PPI. PPI
net-works of the top 200 DEGs. A high PPI enrichment value (P = 1.85 × 10⁻¹⁰) indicating interactions among these DEGs
is very significant relative to proteins drawn at random, indicating a biological connection as groups in defined pathways. Pan-cancer agonistic (red) and antagonistic (green) DEGs (nodes/circles) and their interactions (edges/ lines) demonstrate groupings of these 2 pan-cancer DEG subclasses, and gray lines highlight interactions between them. Noninteracting DEGs are on the right (NAViGaTOR v3 and IID v04-2018). DEG nodes are colored according to GO Molecular Functions listed in the top left legend. Larger node circles represent the highest degree of DEGs inter-actors within the network, and blue DEG names represent centrality of interactors (as determined by the all-pairs shortest path algorithm in NAViGaTOR).
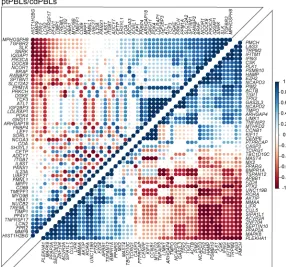
Figure 4. Pan-cancer DEGs have extensive coexpression dynamics. Correlograms of the top 200 selected prognostic
pan-cancer DEGs demonstrate extensive coexpression dynam-ics in CD8+ ccRCC isolates (Spearman method, expression
ladder on right) (n = 20). Predominant pathways of the 4 most highly correlating pan-cancer gene groups included GO biologi-cal processes — cellular responses to stimulus, receptor signal-ing, and regulation of metabolic processes and Kegg pathways — adherens junctions and colorectal, endometrial, blood and pancreatic cancers for the top right correlating ptPBL gene group. The bottom left ptPBL gene groups had extracellular matrix disassembly. For TILs, the bottom left gene group was stronger for GO biological processes such as receptor signaling, developmental processes, cell communication, and signal transduction, while the top right TIL gene group was dominat-ed by cell cycle regulation processes (P = 4.98 × 10–05) and also
[image:6.585.260.546.462.729.2]The Journal of Clinical Investigation
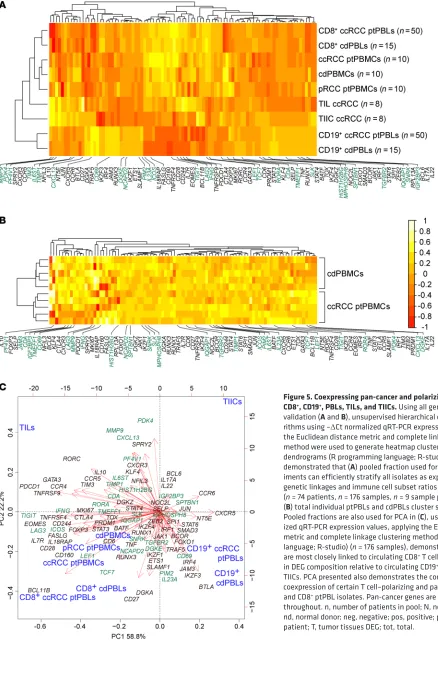
R E S E A R C H A R T I C L EFigure 5. Coexpressing pan-cancer and polarizing DEGs stratify CD8+, CD19+, PBLs, TILs, and TIICs. Using all genes from qRT-PCR
validation (A and B), unsupervised hierarchical clustering
algo-rithms using –ΔCt normalized qRT-PCR expression values applying the Euclidean distance metric and complete linkage clustering method were used to generate heatmap clustering and associated dendrograms (R programming language; R-studio). Heatmaps demonstrated that (A) pooled fraction used for validation
exper-iments can efficiently stratify all isolates as expected from their genetic linkages and immune cell subset ratios of PBL populations (n = 74 patients, n = 176 samples, n = 9 sample pools) and that (B) total individual ptPBLs and cdPBLs cluster separately (n = 10). Pooled fractions are also used for PCA in (C), using –ΔCt normal-ized qRT-PCR expression values, applying the Euclidean distance metric and complete linkage clustering method (R programming language; R-studio) (n = 176 samples), demonstrating that PBLs are most closely linked to circulating CD8+ T cells and are different
in DEG composition relative to circulating CD19+ B cells, TIL-Bs, and
TIICs. PCA presented also demonstrates the common and differing coexpression of certain T cell–polarizing and pan-cancer DEGs in TIL and CD8+ ptPBL isolates. Pan-cancer genes are highlighted in green
expression in myeloid and lymphoid cells relative to 12 other can-cers, (c) modified in expression levels in cancers relative to normal tissues (n = 17 cancers; The Human Protein Atlas), and (d) direct published literary evidence of DEG expression in the immune subtypes from which they were identified (Supplemental Table 2). The top 200 scoring pan-cancer ptPBLs and TIL FIR-DEGs were subjected to PPI analyses using the rudimentary search engine (STRING) (Supplemental Figure 3F and ref. 25), providing a PPI enrichment value (P = 1.85 × 10⁻¹⁰) warranting further
investiga-tion. For more comprehensive PPI analyses, we used IID, pathDIP, and NAViGaTOR, providing new evidence of interactions (Figure 3), with most the highly associated pathways to antagonistic tar-gets including the immune system, TNF signaling, NF-κB, and agonistic pathways WNT signaling, chemokine signaling, proteo-glycans, and GPCRs (P < 1 × 10⁻¹⁰) (Supplemental File 1A). Finally,
the top-scoring 200 ptPBLs and TIL pan- cancer FIR-DEGs were further refined by retaining those that were the most correlated in differential pan-cancer gene expression toward discovery of nov-el mechanistic pathways not deciphered from the above analyses (Figure 4). The combination of these scoring methods was used to select pan-cancer FIR-DEG for validation on a new RCC patient cohort (Supplemental Figure 1).
Pan-cancer and polarizing DEGs stratify CD8+, CD19+, PBLs,
TILs, and TIICs. Twenty-eight pan-cancer FIR-DEGs and 62
commonly used T cell–polarizing genes defining known T cell subsets were selected for validation on a new, indepen-dent 74-patient RCC cohort, using TaqMan Gene Expression Assays on 96.96 microfluidic BioMark HD Real-Time PCR system dynamic arrays (Fluidigm), providing the advantage of DEG coexpression analysis. Total CD8+ ptPBL RNA from 41
patients with ccRCC, 8 with RCC, and 6 patients with papil-lary renal cell carcinoma (pRCC), and CD8+ cdPBL RNA from
control donors were analyzed, with 3 ccRCC patient dupli-cates added as inter-assay RNA extraction controls. Five total ptPBMC and five total ndPBMC RNA preparations were also included. Finally, to maximize use of the microfluidics chip and to determine whether these could provide a baseline for DEG expression, pooled total RNA samples from CD8+ (n =
50 patients) and CD19+ (n = 50 patients) ptPBLs, CD8+ (n = 15
patients) and CD19+ (n = 15 patients) cdPBLs, ccRCC PBMCs
(n = 10 patients), pRCC PBMCs (n = 10 patients), ndPBMCs (n = 10 control donors), and paired ccRCC TILs (n = 8) and TIICs (n = 8) were also included. BioMark HD–generated heat-maps, housekeeping genes, and loading controls are shown in Supplemental Figure 4, A–D.
Following normalization, correlograms were used to visu-alize coexpression dynamics between all DEGs (Supplemental Figure 4E). Unsupervised clustering demonstrated that pooled RNA fractions were stratified as expected, with CD8+ and CD19+
isolates stratifying furthest apart, and total PBMC isolates stratify-ing independently, but remainstratify-ing closer to CD8+, as a function of
T cells (7%–24%) representing a larger frequency of total PBMCs than B cells (1%–7%) (Figure 5A). Also expected, TILs stratified closest to total PBMCs, yet remained close to TIICs—reflecting tissue-infiltrating immune profiles. Finally, ccRCC ptPBLs and cdPBLs from either CD19+ or CD8+ isolates clustered closely, at
opposite ends of the heatmap. Unsupervised clustering was also
used to observe that individual ccRCC ptPBMCs were efficiently stratified from ndPBMCs (Figure 5B). PCA was used to visualize coupling of pooled RNA fractions and DEG coexpression, here demonstrating that patient TILs, PBMCs, and CD8+ ptPBLs were
distantly stratified from both TIICs and CD19+ ptPBLs (Figure 5C).
This 3-dimensional view also provided evidence of coexpressing groups of pan-cancer FIR-DEGs and polarizing genes.
Pan-cancer DEGs stratify patients with RCC from control donors.
Differential expression and correlation analyses were coupled to identify pan-cancer FIR-DEG combinations most efficiently stratifying patients. Several pan-cancer FIR-DEGs (ICOS, PF4V1,
IFNG, LAG3, TIGIT, CDA, PDK4, KLF4, PIM2, TIMP1, IGF2BP3, IL23A, LEF1, and TCF7), in combination with other T cell genes,
efficiently stratified patients from control donors to an accuracy of 90.1% (Figure 6, A and D). The absence of novel discovered pan-cancer FIR-DEGs uncommon to T cell polarization caused loss of patient stratification (Supplemental Figure 5A); however, control donors still stratified with an LEF1- and NT5E-expressing population, which included other biomarkers of activation, and immune checkpoint BTLA, which we and others believe marks T cells having enhanced survival properties (26, 27).
Combination testing revealed that a smaller set of these patient-stratifying pan-cancer genes (IFNG, CDA, PDK4, KLF4,
IGF2BP3, and LEF1) could also stratify patients to an accuracy of
89.1% (Figure 6, B and D), which could not be met in their absence (Supplemental Figure 5, B and C). Additional combination testing identified a minimal set of 3 DEGs (MMP9, FASLG, and LEF1) stratifying patients to an accuracy of 79.3% (Figure 6, C and D). Interestingly, aside from stratifying patients from control donors, pan-cancer FIR-DEG PCAs revealed 2 dominant CD8+ ptPBL
pop-ulations containing either FASLG or LEF1 together responsible for triggering cell death or cell activation. In addition, the 3 internal patient duplicates remained closely clustered throughout PCAs, whereas pooled RNA factions were centralized among their coun-terparts (Figure 6, A–C). Further correlation analyses performed on patients with RCC populating yellow PCA quadrants occupied by control donors demonstrated these to have increased CXCR3 (P = 0.0021; r = 0.4898; CI, 0.1874–0.7074) and CXCR5 (P = 0.0029; r = 0.4764; CI, 0.1705-0.6988) (Spearman method), sug-gesting that these may be 2 key RCC fitness genes, also recently linked to increased abilities of broadly neutralizing antibody pro-duction by HIV-1 elite controllers (28).
Pan-cancer FIR-DEGs common to RCC and HIV. This link
From PCA analyses demonstrating that pan-cancer DEGs stratified 2 CD8+ T cell pools in addition to individual patients
(Fig-ure 6), along with observations of their ability to stratify patients according to pan-cancer recurrence (Figure 7A), we applied cor-relograms to observe whether their combined expression could tip the balance between tolerant/anergic and activated/effector T cell profiles. The merging of correlograms providing a split in DEG populations, expression levels of DEGs between isolates, and balance of DEGs formerly documented in the literature as being associated to activation or tolerance phenotypes, suggested existence of a dominant activated effector CD8+ ptPBL population
(Figure 7B). The majority of these effector DEGs (69.2%) provid-ing an activation phenotype were downregulated in patients with pan-cancer recurrence, suggesting these patients may lack the ability to mount an immune response.
Pan-cancer DEGs synergize toward prognosis and are subject to splicing defects. The TCGA KIRC–probing prognostic
algo-rithm was modified to test all combinations of additive effects of pan-cancer FIR-DEGs on patient prognosis. The only DEGs with marked additive effects on patient survival were MMP9, LEF1,
PF4V1, and TIMP-1 — this observation gained additional support
from correlograms providing evidence of their coexpression (Fig-ure 7C). Additionally, relative to the 3-DEG signat(Fig-ure stratifying patients (Figure 6C), although FASLG was not associated with prognosis (P = 0.401), patients categorized as MMP9hi LEF1hi
FASLGhi KIRC had reduced survival rates (HR, 0.0988-0.6324;
P = 3.71 × 10–05). While the TCGA KIRC data set represents whole
tumor RNA expression, the Human Protein Atlas showed that unlike the others having additive effects on prognosis, expression of MMP9 RNA and protein is strictly associated with lymphoid and myeloid systems, thus, possibly enhancing prognostic effects by identifying immune-relevant signature populations from whole tumor data sets. Inverse correlation observed between oncostatic melatonin receptor 1A (MTNR1A), extensively expressed by lym-phocytes and MMP-9 expression in RCC as a plausible mecha-nism for our findings (33), prompted us to reexamine microarray data sets to see that MTNR1A was reduced in ccRCC CD8+ TILs
(P = 8.3 × 10–04) and CD19+ TIL-Bs (P = 1.4 × 10–04).
To gain insight on other possible mechanisms behind effects of pan-cancer FIR-DEGs on patients, and because we used the Human Transcriptome Array (HTA) 2.0 microarray able to dis-tinguish between differential gene expression and transcript isoform modulation, we used the microarray data set to observe whether these differed at the isoform level. In paired patient CD8+ ptPBLs and TILs, with the exception of HIST1H2BG, ICOS,
and IFNG, all other validated pan-cancer FIR-DEGs had modified isoforms, and 47.36% of these were found to be mirrored between CD8+ ptPBLs and TILs relative to TIICs (Figure 7D)
(Supplemen-tal Table 8). Additionally, as determined by Affymetrix Transcrip-tome Analysis Console software, there were many more distinct transcript isoforms present and heightened splicing indices for ptPBLs than for TILs, relative to TIICs (i.e., ptPBLs vs. TIICs, 71.97%; avg. splicing index = 18.432, avg. splicing event score = 0.224; TILs vs. TIICs, 28.57%, avg. splicing index = 1.727, avg. splicing event score = 0.306). Thus, the transcript isoform reper-toire of CD8+ ptPBLs is much larger than that of CD8+ TIL, likely
due to similarities for tissue infiltrates but with a few notable dif-identifying pan-pathology genes. We thus compared our
pan-can-cer DEGs to data sets from another study aimed at identifying frontline biomarkers common to numerous pathologies (30). Strikingly, 82.1% of our ptPBL-based and 42.8% of our TIL-based top 200 pan-cancer FIR-DEGs were confirmed by their find-ings, with 51% of 467 pan-cancer DEGs and 59% of the top 100 pan-cancer DEGs present (Figure 6F). A total of 71.1% of DEGs were commonly reflected by bacterial infection data sets. Poten-tially revealing pan-pathology T cell biomarkers, we then com-pared our lists to cancer patient data sets of response to anti–PD-1 immunotherapy (31, 32), highlighting a few of our pan-cancer FIR-DEGs (Supplemental Table 6), notably including our MMP9,
FASLG, and LEF-1 minimal triad stratifying patients with ccRCC
from control donors (Figure 6C; see Supplemental Table 7 for a summary of validated DEGs common to other data sets).
Pan-cancer DEGs are associated with pan-cancer recurrence and T cell activation. Within the validation cohort, 10 of 28 patients
with ccRCC (35.7%) were recorded as having been previously treated for other malignancies including kidney, bladder, blood, breast, colon, liver, melanoma, ovary, prostate, rectal, and uterine cancers, in which a few had suffered from 3 different malignancies with no recorded metastases. We used this opportunity to compare validated DEGs across control donors, patients with RCC, and those positive or negative for pan-cancer recurrence. Strikingly,
MMP9 expression best stratified patients with pan-cancer
recur-rence (P < 0.0001, t test; P = 0.007, 2-way ANOVA with Tukey’s post test) (Figure 7A). All patients categorized as MMP9hi had
pre-viously suffered from RCC, along with blood, breast, colon, mel-anoma, ovarian, prostate, or uterine cancers with a high propor-tion of adenocarcinomas (80.0%). A disproporpropor-tionatenumber of patients categorized as MMP9lo had previously suffered from
blad-der or prostate cancer (66.6%). Other DEGs stratifying patients with recurring pan-cancer were KLF4, RORC, PDK4, and CCR4; yet these genes were decreased in these patients with recurrence.
Figure 6. Iterative DEG combination testing defining minimal gene sets required for stratifying patients from control donors according to circu-lating CD8+ T cells. Normalized –ΔCt qRT-PCR DEG expression values from
individual and pooled CD8+ ptPBLs and cdPBLs were used for PCA using
applying the Euclidean distance metric and complete linkage clustering method (R programming language; R-studio) (n = 69). (A) Patients are
stratified using 32 DEGs including pan-cancer (ICOS, PF4V1, IFNG, LAG3,
TIGIT, CDA, PDK4, KLF4, PIM2, TIMP1, IGF2BP3, IL23A, LEF1,and TCF7), T cell–polarizing (FASLG, ZEB2, EOMES, CCR5, TOX, PRDM1, BATF, FOXO1,
CD28, and CD27), adhesion (JAM3, SELP), and immune checkpoint DEGs (CD160, CD244, PDCD1, TIM-3, BTLA, and NT5E). (B) Patients are
strati-fied using 12 DEGs including pan-cancer (CDA, PDK4, KLF4,and IGF2BP3) and adhesion (JAM3, SELP) DEGs. (C) Patients are stratified using 3 DEGs
(pan-cancer, MMP9, and LEF1; T cell polarizing, FASLG). Boxes with a pale yellow background highlight PCA-stratified control donors used to calculate the percentage of patient stratification. (D) Graph representing
the percentage of patient stratification from DEG groups in (A–C) and in
Supplemental Figure 5, with representative numbers of pan-cancer genes among groups at the bottom (n = 66, nonduplicate samples). (E and F)
Venn diagrams demonstrating overlaps between (E) CD8+ ccRCC ptPBL
DEGs, CD8+ ccRCC TIL DEGs, CD8+ HIV elite controllers, and PBMC from
patients infected with bacteria and (F) effect of pan-cancer pipeline on
enhancing CD8+ DEG identity. dupe, duplicate sample; misclas.,
let activation, sirtuin (SIRT) and histone deacetylase (HDAC) activation, leukocyte transendothelial migration, alcoholism, SUMOylation, androgen receptor, and TNF-α (P < 1 × 10⁻¹⁰); all
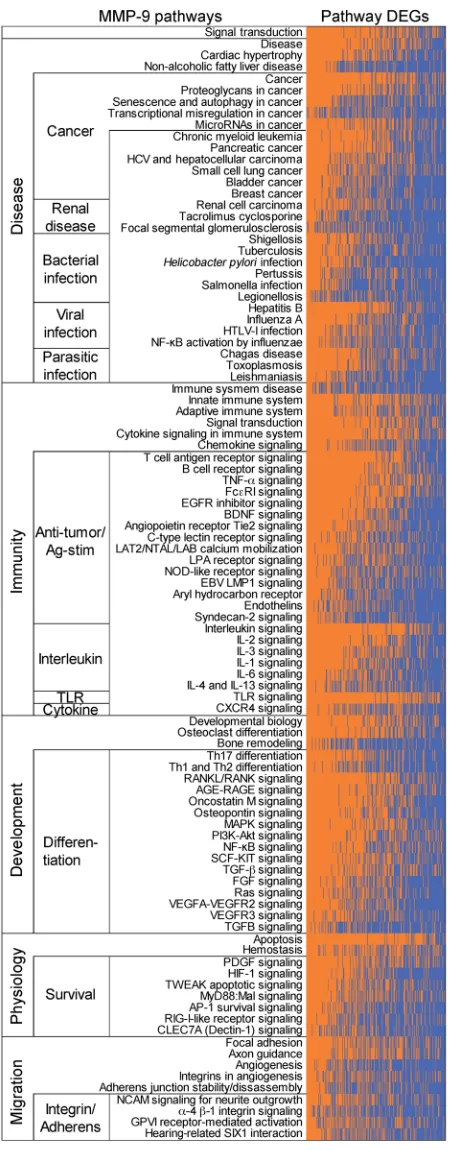
had links to MMP9 regulation (Supplemental File 1B). To iden-tify the most relevant MMP-9 pathways of the 235 revealed by pathDIP in ccRCC ptPBLs, we performed correlation analyses revealing that 216 of the 1036 DEGs were significantly correlat-ed with MMP-9–positive pathways (Supplemental Table 9). Generating physical PPI networks using NAViGaTOR demon-strated that all but 6 of these 216 DEGs (97.71%) do interact (Figure 8A, see Supplemental Figure 7 for full PPI). From path-way-enrichment analysis using pathDIP, many disease, cancer, and immunity pathways could be repeatedly observed in MMP-9–significant DEG-associated pathways (Figure 8B, see Supple-mental Figure 8 for full analyses). Tissue-specific disrupted PPI networks among MMP-9 interactors in 13 cancers were exam-ined. The majority of identified genes represented in cell/leuko-cyte migration and adhesion processes and extracellular matrix disassembly and collagen metabolism (Supplemental Figure 8) as recently reported represent pretreatment serum biomarkers in response to ICB (34). Genes common to ccRCC ptPBLs are involved in immune response and activation, apoptosis regula-tion, and migration in response to bacteria (35). Interestingly, cancers having the highest MMP-9 gained and lost PPIs were colon, mouth, and lung (Figure 8C). Finally, an independent differential correlation analysis and organization of MMP-9 pathways and their significantly associated DEGs was used to validate that although extracted from ccRCC ptPBL expression signatures, the majority of MMP-9 pathways filtered on ccRCC DEGs were most linked to a variety of renal diseases; numer-ous viral, bacterial, and parasitic infections; numernumer-ous cancers; immunity and antigen recognition and activation; differentia-tion; and cellular survival pathways (Figure 9; see Supplemental Figure 9 for expanded pathway DEG names).
Discussion
The importance of combining TIL and ptPBL profiles, large patient data sets, and bioinformatics to resolve singular predictive biomarkers representing pan-pathology personalized immuno-therapeutic targets cannot be understated. We set out to elucidate novel pan-cancer targetable immune biomarkers using a non-biased approach in which we discovered numerous pan-cancer FIR-DEGs correlating with patient survival, several of which have also been identified as immunotherapy-resistance, HIV-control-ler, and bacterial infection biomarkers. In developing an assay for RCC patient stratification, we found that this was possible with as few as 3 CD8+ ptPBL DEGs (i.e., MMP9, LEF1, and IFNG). We
dis-covered that MMP9 was increased among patients with recurring pan-cancer, with some suffering from as many as 3 malignancies without recorded metastases. PPI networks placed MMP9 as a central node of interaction matrices amid other pan-cancer FIR-DEGs identifying cell migration and cytokine pathways.
MMP-9 (leukocyte gelatinase B) is a type IV collagenase (36) belonging to the MMP family of more than 25 secreted and trans-membrane-bound, zinc-dependent endopeptidases controlling tissue remodeling by degrading components of the extracellular matrix, proteinases, adhesion molecules, chemokines, and cyto-ferences including higher isoform numbers for immune
check-points TIGIT and LAG3. Both MMP9 and TCF7 common isoforms were further increased in ptPBLs relative to TILs, and both CD69 and IQGAP1 common isoforms were modified in pt PBLs relative to cdPBLs. For MMP9, TIMP1, IQGAP1, MPHOSPH8, CD69,
TCF7, LAG3, and TIGIT, the same isoforms are repeatedly
repre-sented among isolate types (i.e., CD8+ ptPBLs and TILs, relative
to CD8+ TIICs and cdPBLs) (Supplemental Table 8). Together,
these results suggest that prognostic effects of pan-cancer FIR-DEGs may also be the result of deficiencies in transcript isoforms required for optimal T cell fitness.
Enrichment of pan-cancer–disrupted MMP9 pathways in ccRCC ptPBLs. Our initial strategy to use PPI analyses for refining ccRCC
DEGs for validation was only partially useful. Now armed with validation experiments and strength in statistics for individu-al DEGs by repeating PPI anindividu-alysis using a rudimentary search engine (STRING), the importance of MMP9 having the highest combined interaction annotation score (14.91) and its positioning as a central interacting node of pan-cancer FIR-DEGs (TIMP1,
PDK4, LEF1, CDA, KLF4, PF4V1, SELF, PIM2, ICOS, IFNG, IL23A, IL6ST, TCF7, SELL, SERPINE1, OSM, CXCL5, HBA1, COLA1, MAB2, LIFR, IQGAP1, MAPK8, PIK3CA, BLC2, LAG3,
and TIGIT) with associated cytokine production and immune cell migration and adhesion cellular processes held more weight (Supplemental Figure 6).
MMP9 in CD8+ PBLs was 1 of 3 DEGs able to stratify patients
with RCC from control donors, and MMP9 was increased in patients with RCC who had recurring pan-cancer. We thus used advanced PPI and pathway analyses (IID and pathDIP, using NAViGaTOR) to reexamine the microarray data sets with the aim to decipher the significant role of MMP-9 in signaling cas-cades at play in patients with ccRCC. A comprehensive pathway enrichment analysis using all 1036 nonredundant ptPBL DEGs identified pathways including amyloid fiber formation,
plate-Figure 7. Additive prognostic pan-cancer DEGs stratify multi-cancer recur-ring ccRCC patients having activated CD8+ T cell profiles. (A) DEGs from
the validation cohort were compared among cdPBLs (n = 12) and ptPBLs with (n = 10) or without (n = 18) recurring multi-cancers. P, 2-way ANOVA with Tukey post test; *, P < 0.05; **, P < 0.01; ****, P < 0.0001; boxes, upper and lower quartiles; whiskers, all points maxima to minima; +, mean; line, median. Functional classifications of DEG groups are listed above and below, and the literature was used to (B) segregate DEGs according
to tolerance or activation phenotypes. Correlograms (Spearman method) using normalized –ΔCt qRT-PCR expression values for visualization of 2 groups of pan-cancer and T cell–polarizing DEGs, with differences observed between all patients with ccRCC vs. control donors and patients with vs. without recurring cancers (Student t test, P < 0.05) (red, increased expres-sion; green, decreased expression). Only MMP9 is significantly increased in multi-cancer patients relative to all others. (C) Pan-cancer DEG
combina-tions tested for additive prognostic effects using TCGA KIRK data set. Only
MMP9, LEF1, PF4V1, TIMP1, and TMEFF1 demonstrate additive prognostic effects, and these cluster in correlograms (as above) enquiring pan-cancer DEGs with combinatorial effects on prognosis. Kaplan-Meier plots P, log-rank. (D) Venn diagram illustrating that ptPBLs have more differentially
invasive phenotype, supporting a role for MMP-9, upregulated in response to cytokines, and facilitating migration of PBLs from the vasculature into sites of inflammation. Induced by adhesion-mol-ecule interactions between APCs and lymphocytes, MMP-9 is considered a pure effector molecule, amplifying immune function by catalyzing innate and acquired immunity (58) and is critical for antigen-specific, activation-induced proliferation of T cells (59). We observed increased MMP9 expression in both CD8+ and
CD19+ ccRCC ptPBLs, and other genes we find correlating with
MMP9 expression are implicated in CD8+ cross-priming and
anti-gen-mediated activation and proliferation (CD69, STAT4, NFIL3,
IL10, and JAK1) (40, 59, 60). In patients with recurring
pan-can-cers, MMP9 was inversely correlated with its regulator STAT3, which restricts tumor penetration of anti-tumor CD8+ T cells (61,
62). In pooled RNA PCA analyses, MMP9 expression correlated with TILs and CXCL13, which induces MMP-9 expression toward leukocyte migration in perivascular spaces (63, 64). BATF was the only pan-cancer FIR-DEG negatively correlating with MMP9 in patients with RCC, ccRCC, and recurring pan-cancer, and it is known to suppress MMP-9 and effector molecules for CD8+
T cell differentiation and survival (65). Other DEGs in patients with recurring pan-cancer (KLF4, RORC, CCR4, and PDK4) are implicated in MMP-9 regulation for cell migration (66–69). Some DEGs stratifying patients with RCC and correlating with MMP9 have been associated with response to immunotherapies (MMP9,
IL10, NFIL3, LEF1, FASLG, MKI67, STAT4, CD244, and JAK1). In
a recent study examining correlates with the response of ccRCC to ICB, despite an underpowered discovery cohort, increased
MMP9 correlated with progressive disease relative to low MMP9
in partial responders or patients with stable disease (70). Another study demonstrated that reduction of MMP-9 on monocytes from combination immunotherapies led to conversion of tumor micro-environments from “cold” to “inflamed” states eliciting protective T- cell responses (71). Finally, MMP9 and numerous other extra-cellular matrix pan-cancer genes we have identified, have also just recently been shown to be differentially expressed between ICB responders and nonresponders (72), and where, notably, we identify almost half (44%) of their defined immunotherapy failure signature as gained PPIs of MMP-9 during cancer.
Possible mechanisms of MMP-9 regulation in cancer are sup-ported by our observations of alternative MMP9 RNA isoforms in RCC CD8+ ptPBLs and TILs and by previous association of
MMP-9 polymorphisms with disease (36). Another possible mechanism stems from reports of pharmacologic concentrations of melatonin inhibiting MMP-9 through melatonin receptor 1A (MTNR1A), as an oncostatic agent inhibiting tumor growth and invasiveness of renal, breast, gastric, hematological, prostate, bone, skin, liver, and brain tumors (33). MTNR1A, extensively expressed by splen-ic, thymic and circulating CD4+, CD8+, and B+ lymphocytes (73),
was found to be significantly reduced in ccRCC TILs and TIL-Bs and thus less likely to respond to melatonin or to regulate MMP-9. Thus, representing an attractive target for the treatment of numer-ous diseases, a specific MMP-9 inhibitor, JNJ0966, has been developed for clinical utility in immune disorders (74) and could be repurposed to control numerous cancers and pathologies. Finally, another possible MMP-9 cancer-onset mechanism stems from our observations of its gained and disrupted PPIs that were kines (37). Following its activation by cleavage, secreted
pro-MMP-9 is regulated by tissue inhibitor of metalloproteinases 1 (TIMP-1), also identified as a pan-cancer FIR-DEG. MMP-9 is a biomarker of pathogenesis and progression of various diseases, including heart disease, atherosclerosis, hypertension, chronic obstructive pulmonary disease, blood–brain barrier disorders, endometriosis, Down syndrome, and streptococcal pneumonia (38, 39). MMP-9 is important for productive infection by numer-ous viruses, including hepatitis viruses, vesicular stomatitis virus, respiratory syncytial virus, and HIV-1 (40).
Although many MMPs are associated with poor prognoses, MMP-9 is the most extensively studied and is associated with aggressive phenotypes and poor prognoses in several solid malig-nancies (41). In cancer, MMP-9 is associated with genetic instabil-ity, tissue remodeling, tumor cell proliferation, invasion and motil-ity, progression, extravasation, metastasis, epithelial-mesenchymal transition, angiogenesis, apoptosis, inflammation, and immunosur-veillance (36). MMP-9 in PBLs, serum, and tumors predicts prog-nosis, invasiveness, grade and differentiation, recurrence, metas-tasis, and treatment resistance, for bladder, lung, blood, colorectal, prostate, and liver cancers (42–49). In patients with RCC, MMP-9 is increased in tumors and plasma (50) and correlates with histologi-cal grade (51), poor prognosis, and lowered survival (52), metastasis, decreased time to progression, and poor response to sunitinib (53).
Although many studies have examined MMPs facilitating epi-thelial cancer invasion via migration toward chemokines (54), oth-ers indicate MMPs shape the aggressive stromal compartment of the tumor microenvironment (55). MMPs are expressed by various immune subsets within stromal compartment across cancers, and TILs are the highest MMP-9 producers (56). MMP-9 expression disproportionately correlates with immune response genes rath-er than extracellular matrix genes in lung adenocarcinomas (57). MMP-9 is constitutively expressed at higher levels in splenic T cells and TILs than tumor cells (56). Immunosurveillance requires an
Figure 8. Enrichment of disrupted MMP9 pathways in ccRCC patient circulating cells and various cancers. (A) PPI network linking
pan-can-cer proteins from significant MMP-9 pathways-associated ccRCC ptPBL DEGs. DEGs (nodes/circles) and their interactions (edges/lines) are shown in red (high expression) and green (low expression), and gray edges
highlight interactions between them (NAViGaTOR v3 and IID v04-2018). Noninteracting proteins are listed on the top right. DEG nodes are colored according to GO Molecular Functions listed in the legend. Larger node circles, represent the high degree of interactions with all other DEGs, and blue DEG names represent centrality of interactors. (B) Pathway
enrich-ment analysis graphs depicting results of pathDIP analysis for MMP-9 pathway interactors from correlation analyses. Upper panel shows sig-nificance of enrichment obtained for individual pathways (P value, –log10) adjusted for multiple testing using FDR and Bonferroni methods. Lower bar plot shows overlap between query genes and members of individ-ual pathways. Respective numbers of known and predicted pathway members are distinguished by opacity, and fill color indicates source of given pathway. Plots are restricted to the top 100 most significant (see Supplemental Figure 7A for the full pathways). (C) Tissue-specific
The Journal of Clinical Investigation
R E S E A R C H A R T I C L Emost significant in colon, mouth, and lung cancers. Thus, deregu-lation of MMP-9 roles in maintaining colonic microbiota (75) may have profound effects on cancers in these systems.
We have focused on MMP-9 because this molecule efficient-ly stratifies patients with RCC via both CD8+ and CD19+ immune
cells, yet extends itself beyond pan-cancer. It is an attractive pan-pathology immune biomarker and target for the treatment of numerous diseases and is a central interactor for numerous other pan-cancer biomarkers we have identified herein. MMP-9 is an attractive pan-pathology biomarker because its elevated expression can be detected in tumors but also by less invasive methods examining blood and by completely noninvasive meth-ods examining urine, fecal samples, tears, and exhaled breath condensate (76–78). Because MMP-9 expression is controlled by circadian rhythm, diurnal variations may be responsible for its initial immune deregulation in patients. With the possibility of its expression causing varied responses among patients, MMP-9 monitoring may be valuable over the course of treatment, whether it is radio-, chemo-, or immunotherapeutic. Further work deter-mining the precise polarity of T cell subsets expressing MMP-9 and its function permitting their infiltration into tumors may resolve imminent questions of the field concerning tumor immu-nogenicity. Aside from MMP9, however, numerous other identi-fied pan-cancer FIR-DEGs warrant further investigation.
In the discovery of how pan-cancer FIR-DEGs may have pan-pathology effects, we observed that blinded refining of the target list using informatics without previous knowledge of their oncostatic or -promoting abilities increased the identity of pan-cancer DEGs also important for HIV-1 controllers. As the first data-driven suggestion, these may actually represent pan-pathol-ogy markers. To be certain of this link to HIV-1 fitness correlated by our pan-cancer FIR-DEGs, we performed extensive literature reviews indicating that the majority shared similar effects of pro-motion or inhibition of HIV-1 infection. Other PBL DEGs shared by many infectious and autoimmune diseases are common to those discovered here (e.g., MMP9, IGF2BP3, TIMP1, CDA, IFNG,
PFAV1, LAG3, PIM2, ICOS, TIGIT, and IL23A).
To our knowledge, we are the first to present a pan-patholo-gy biomarker pipeline starting from CD8+ and CD19+ DEGs from
paired cancer patient PBLs, TILs, and TIICs. Prognostic DEGs were validated across 5 cancers and as few as 3 could stratify patients and pan-cancer recurrence. We focused on DEGs that could be easily detected as biomarkers or targeted by therapies. The resulting pan-cancer genes are of additional interest, as they may reflect a pan-pathology state of the FIR, with numerous DEGs similarly modulated and important for resistance to immunother-apy and unresolved viral and bacterial infections. The noninvasive FIR-DEGs we have identified warrant future investigation toward the development of their potential in precision diagnostics and precision pan-disease immunotherapeutics.
Methods
Complete detailed methods are in the supplemental materials.
Statistics. For the training ccRCC cohort, a sample size of n =
5 paired patient TILs, TIICs, and PBLs was determined as having above 0.9 power according to the GeneChip Human Transcriptome Array 2.0 manufacturer guidelines (Affymetrix, Thermo Fisher Sci-Figure 9. MMP-9 pathway DEGs are linked to a variety of renal diseases,
cancers, microbial infections, and immune activation. MMP-9 pathways
[image:15.585.37.262.53.628.2]validation genes, performed microfluidics qRT-PCR validation experiments, and normalized and analyzed the data. IJ performed integrative analysis, interaction network, pathway enrichment analysis, and suggested experiments and analyses. SR performed the pan-cancer analyses. TT performed pathway enrichment anal-ysis. A. Monette and RL organized, harmonized, analyzed and interpreted the data, created figures, and wrote the manuscript. A. Monette, IJ, DEK, and RL supervised the study. IJ, A. Morou, DEK, NAAB, JPR, and RL critically reviewed the manuscript. All authors revised the final manuscript.
Acknowledgments
We thank all study participants and patients; The Cancer Genome Atlas; Mathieu Latour and Roula Albadine and sup-porting staff of the CHUM pathology department; Manon de Ladurantaye and Anne-Marie Mes-Masson from the CRCHUM for RNA quality profiling, Geneviève Cormier and Fred Saad from the CRCHUM for drawing blood from control donors; Gilles Corbeil of the CRCHUM genomics department for RNA quality testing and microarray profiling; Francois Harvey of the CRCHUM bioinformatics department; Peter Graf and Pat-rick Sabourin from Affymetrix for providing reagents and tech-nical assistance; Zeeshan Farroq and Ofir Goldberger from Fluidigm; Erika Diaz from StemCell; Andrew Mouland from McGill University; Simon Turcotte from University of Montre-al; and Sascha Ring from Biostars for their advice. This work was partially performed at the Institut du Cancer de Montréal CRCHUM and University of Montreal, in Montreal, Quebec, Canada. This work was supported by a Canadian Cancer Soci-ety Research Institute grant (CCSRI) (702036, to RL and IJ) and a Biomedical Research Grant from the Kidney Foundation of Canada (KFOC130019 to RL). RL is supported by the Quebec Cell, Tissue and Gene Therapy Network—ThéCell (a thematic network supported by the Fonds de recherche du Québec–Santé [FRQS]), the FRQS, and the Immunotherapy Network (iTNT) from the Terry Fox Research Institute (TFRI), A. Monette is supported by Mitacs, Merck, l’Institut du cancer de Montréal (ICM), the Society for Immunotherapy of Cancer, and the Lady Davis Institute for Medical Research. NAB is supported by the FRQS post-doctoral award and Qatar University. JBL is sup-ported by l’Institut du Cancer de Montréal. JPR holds the Louis Lowenstein Chair, McGill University. DEK is supported by an FRQS Research Scholar Award (grant 31035), CIHR 377124, NHLBI RO1-HL-092565, and the Canada Foundation for Inno-vation (CFI) (grant 31756). IJ and computational analysis were supported by the Canada Research Chair Program (CRC) (grant 225404), Ontario Research Fund (grant 34876), the Natural Sciences Research Council (NSERC) (grant 203475), the CFI (grants 203373 and 30865), the Krembil Foundation, and IBM.
Address correspondence to: Réjean Lapointe, Centre de recherche du CHUM (CRCHUM), 900 rue St-Denis, Tour Viger, Montreal, Quebec, Canada, H2X 0A9. Phone: 011.514.890.8000; Email: [email protected]. Or to: Anne Monette, Lady Davis Institute for Medical Research, 3755 ch. Côte Ste-Catherine Road, Montreal, Quebec, Canada, H3T 1E2. Phone: 011.514.340.8222. Email: [email protected].
entific). Training set microarrays power calculations by the manu-facturer used an inference of means calculation (https://www.stat. ubc.ca/~rollin/stats/ssize/n2). Multiple hypothesis test correction was performed using the FDR Benjamini–Hochberg step-up proce-dure. For the RCC validation cohort (n = 74), power analysis deter-mined that a minimal sample size of n = 62 was needed to reach a power of 0.80 at α = 0.05 (2-tailed) (G*Power ver. 3.1.9.2; Universitat Düsseldorf, Germany). For algorithms used, statistical methodology for algorithms is described within scripts and https://www.biostars. org/p/153013/. Limma and survival packages for R are used for sin-gle and synergistic ccRCC prognostic algorithms. Dendrogram, heat-map, and PCA unsupervised algorithms used the Euclidean distance metric and complete linkage clustering method. Correlogram algo-rithm uses the R corrplot library, and was created from http://www. sthda.com/, using R-project corrplot and vignette packages. Bino-mial correlations for testing validated DEGs against clinical patient parameters used 2-tailed nonparametric Spearman correlation with 95% CI (Prism V6.01, GraphPad). An unpaired 2-tailed student’s
t test with FDR of 1% was used to compare the 2 groups, and 2-way
ANOVA (with Sidak’s multiple-comparisons test) and 95% CI was used for multiple comparisons. Pathway enrichment analysis results were adjusted for multiple testing by applying FDR and Bonferroni methods. P values of less than 0.05 were considered to indicate a sta-tistically significant difference.
Study approval. Patients with renal cancer underwent resection
for stage I–IV RCC between 2013 and 2017 at the CHUM (Montreal, Canada). Study approval and written and informed consent procedure approval was granted by the CHUM Research Ethics Board. Written informed consent was received from all study participants prior to inclusion in the study. All methods were performed in accordance with the relevant guidelines and regulations. Clinical participant data was randomly numbered for complete anonymity.
Data availability. TCGA KIRC RNA-seq data sets and associated
clinical data sets are available at the cBioPortal for Cancer Genomics (http://gdac.broadinstitute.org/). Pan-cancer testing patient cohort GEO, the EGA and TCGA data sets are available at http://kmplot. com/. DEG protein profiles in cells and across 17 cancers are available from https://www.proteinatlas.org/. Transcriptomic data sets from patients with melanoma and non–small-cell lung cancer (NSCLC) treated with anti–PD-1 therapy are available from Hugo et al. (31) and Rizvi et al. (32). The HIV-1 elite controllers data set is available from Zhang et al. (29), and the bacterial data sets are listed in Song et al. (30). Comprehensive pathway enrichment analysis and PPI analyses are available as Supplemental Data. The microarray data are pub-lished at the National Center for Biotechnology Information Gene Expression Omnibus (http://www.ncbi.nlm.nih.gov/geo) under GEO accession number GSE117230.
Author contributions
The Journal of Clinical Investigation
R E S E A R C H A R T I C L E1. Morris LG, et al. Pan-cancer analysis of intratu-mor heterogeneity as a prognostic determinant of survival. Oncotarget. 2016;7(9):10051–10063. 2. Mak MP, et al. A patient-derived, pan-cancer
EMT signature identifies global molecular alter-ations and immune target enrichment following epithelial-to-mesenchymal transition. Clin
Can-cer Res. 2016;22(3):609–620.
3. Gentles AJ, et al. The prognostic landscape of genes and infiltrating immune cells across human cancers. Nat Med. 2015;21(8):938–945. 4. Budczies J, et al. Mutation patterns in genes
encoding interferon signaling and antigen presentation: a pan-cancer survey with implications for the use of immune check-point inhibitors. Genes Chromosomes Cancer. 2017;56(8):651–659.
5. Charoentong P, et al. Pan-cancer immunogenomic analyses reveal genotype-immunophenotype rela-tionships and predictors of response to checkpoint blockade. Cell Rep. 2017;18(1):248–262. 6. Li Y, et al. A comprehensive genomic
pan-can-cer classification using The Canpan-can-cer Genome Atlas gene expression data. BMC Genomics. 2017;18(1):508.
7. Kaczkowski B, et al. Transcriptome analysis of recurrently deregulated genes across multiple cancers identifies new pan-cancer biomarkers.
Cancer Res. 2016;76(2):216–226.
8. Akbani R, et al. A pan-cancer proteomic perspec-tive on The Cancer Genome Atlas. Nat Commun. 2014;5:3887.
9. Xu Q, et al. Pan-cancer transcriptome analysis reveals a gene expression signature for the identification of tumor tissue origin. Mod Pathol. 2016;29(6):546–556.
10. Li B, et al. Comprehensive analyses of tumor immunity: implications for cancer immunothera-py. Genome Biol. 2016;17(1):174.
11. Tirosh I, et al. Dissecting the multicellular eco-system of metastatic melanoma by single-cell RNA-seq. Science. 2016;352(6282):189–196. 12. Gnjatic S, et al. Identifying baseline immune-
related biomarkers to predict clinical outcome of immunotherapy. J Immunother Cancer. 2017;5:44.
13. Lim C, et al. Biomarker testing and time to treatment decision in patients with advanced nonsmall-cell lung cancer. Ann Oncol. 2015;26(7):1415–1421.
14. Crowley E, Di Nicolantonio F, Loupakis F, Bardelli A. Liquid biopsy: monitoring cancer-genetics in the blood. Nat Rev Clin Oncol. 2013;10(8):472–484. 15. Haber DA, Velculescu VE. Blood-based analyses
of cancer: circulating tumor cells and circulating tumor DNA. Cancer Discov. 2014;4(6):650–661. 16. Shen SY, et al. Sensitive tumour detection and
classification using plasma cell-free DNA methy-lomes. Nature. 2018;563(7732):579–583. 17. Best MG, et al. RNA-seq of tumor-educated
platelets enables blood-based pan-cancer, multi-class, and molecular pathway cancer diagnostics.
Cancer Cell. 2015;28(5):666–676.
18. Alix-Panabières C, Pantel K. Challenges in cir-culating tumour cell research. Nat Rev Cancer. 2014;14(9):623–631.
19. Gros A, et al. Prospective identification of neoantigen-specific lymphocytes in the
periph-eral blood of melanoma patients. Nat Med. 2016;22(4):433–438.
20. Farsaci B, et al. Analyses of pretherapy peripheral immunoscore and response to vaccine therapy.
Cancer Immunol Res. 2016;4(9):755–765.
21. Mishra S, Kaddi CD, Wang MD. Pan-cancer anal-ysis for studying cancer stage using protein and gene expression data. Conf Proc IEEE Eng Med
Biol Soc. 2016;2016:2440–2443.
22. MacFarlane AW, et al. PD-1 expression on periph-eral blood cells increases with stage in renal cell carcinoma patients and is rapidly reduced after surgical tumor resection. Cancer Immunol Res. 2014;2(4):320–331.
23. Fridman WH, Pagès F, Sautès-Fridman C, Galon J. The immune contexture in human tumours: impact on clinical outcome. Nat Rev Cancer. 2012;12(4):298–306.
24. Motzer RJ, et al. Nivolumab plus Ipilimumab versus Sunitinib in Advanced Renal-Cell Carci-noma. N Engl J Med. 2018;378(14):1277–1290. 25. Szklarczyk D, et al. STRING v10: protein-pro-tein interaction networks, integrated over the tree of life. Nucleic Acids Res. 2015;43(Database issue):D447–D452.
26. Haymaker CL, et al. BTLA marks a less-differ-entiated tumor-infiltrating lymphocyte subset in melanoma with enhanced survival properties.
Oncoimmunology. 2015;4(8):e1014246.
27. Monette A, et al. Immune-enrichment of non-small cell lung cancer baseline biopsies for mul-tiplex profiling define prognostic immune check-point combinations for patient stratification.
J Immunother Cancer. 2019;7(1):86.
28. Martin-Gayo E, et al. Circulating CXCR5+
CXCR3+PD-1lo Tfh-like cells in HIV-1 controllers
with neutralizing antibody breadth. JCI Insight. 2017;2(2):e89574.
29. Zhang LL, Zhang ZN, Wu X, Jiang YJ, Fu YJ, Shang H. Transcriptomic meta-analysis identi-fies gene expression characteristics in various samples of HIV-infected patients with nonpro-gressive disease. J Transl Med. 2017;15(1):191. 30. Song F, et al. The frontline of immune
response in peripheral blood. PLoS One. 2017;12(8):e0182294.
31. Hugo W, et al. Genomic and transcriptomic features of response to anti-PD-1 therapy in met-astatic melanoma. Cell. 2016;165(1):35–44. 32. Rizvi NA, et al. Cancer immunology.
Mutation-al landscape determines sensitivity to PD-1 blockade in non-small cell lung cancer. Science. 2015;348(6230):124–128.
33. Lin YW, et al. Melatonin inhibits MMP-9 trans-activation and renal cell carcinoma metastasis by suppressing Akt-MAPKs pathway and
NF-κB DNA-binding activity. J Pineal Res.
2016;60(3):277–290.
34. Jensen C, et al. Non-invasive biomarkers derived from the extracellular matrix associate with response to immune checkpoint blockade (anti-CTLA-4) in metastatic melanoma patients.
J Immunother Cancer. 2018;6(1):152.
35. Rahmati S, Abovsky M, Pastrello C, Jurisica I. pathDIP: an annotated resource for known and predicted human gene-pathway associations and pathway enrichment analysis. Nucleic Acids Res. 2017;45(D1):D419–D426.
36. Farina AR, Mackay AR. Gelatinase B/MMP-9 in Tumour Pathogenesis and Progression. Cancers
(Basel). 2014;6(1):240–296.
37. Goetzl EJ, Banda MJ, Leppert D. Matrix metalloproteinases in immunity. J Immunol. 1996;156(1):1–4.
38. Liu H, et al. Correlation between matrix metal-loproteinase-9 and endometriosis. Int J Clin Exp
Pathol. 2015;8(10):13399–13404.
39. Vissers M, Hartman Y, Groh L, de Jong DJ, de Jonge MI, Ferwerda G. Recognition of Streptococ-cus pneumoniae and muramyl dipeptide by NOD2 results in potent induction of MMP-9, which can be controlled by lipopolysaccharide stimulation.
Infect Immun. 2014;82(12):4952–4958.
40. Chen J, et al. Matrix metalloproteinase 9 facili-tates hepatitis B virus replication through binding with type I interferon (IFN) receptor 1 to repress IFN/JAK/STAT signaling. J Virol. 2017;91(8):null. 41. Kunz P, Sähr H, Lehner B, Fischer C, Seebach E,
Fellenberg J. Elevated ratio of MMP2/MMP9 activity is associated with poor response to chemotherapy in osteosarcoma. BMC Cancer. 2016;16:223.
42. Wieczorek E, et al. MMP, VEGF and TIMP as prognostic factors in recurring bladder cancer.
Clin Biochem. 2015;48(18):1235–1240.
43. Sun Y, et al. NanoVelcro-captured CTC number concomitant with enhanced serum levels of MMP7 and MMP9 enables accurate prediction of metastasis and poor prognosis in patients with lung adenocarcinoma. Int J Nanomedicine. 2017;12:6399–6412.
44. Ramón de Fata F, Ferruelo A, Andrés G, Gim-bernat H, Sánchez-Chapado M, Angulo JC. The role of matrix metalloproteinase MMP-9 and TIMP-2 tissue inhibitor of metalloproteinases as serum markers of bladder cancer. Actas Urol Esp. 2013;37(8):480–488.
45. Gusella M, et al. Plasma matrix metalloprotease 9 correlates with blood lymphocytosis, leuke-mic cell invasiveness, and prognosis in B-cell chronic lymphocytic leukemia. Tumour Biol. 2017;39(2):1010428317694325.
46. Alonso S, et al. Peripheral blood leucocytes show differential expression of tumour progression- related genes in colorectal cancer patients who have a postoperative intra-abdominal infection: a prospective matched cohort study. Colorectal Dis. 2017;19(5):O115–O125.
47. Marín-Aguilera M, et al. Molecular profiling of peripheral blood is associated with circulating tumor cells content and poor survival in meta-static castration-resistant prostate cancer.
Oncotarget. 2015;6(12):10604–10616.
48. Shah K, Patel S, Mirza S, Rawal RM. Unravelling the link between embryogenesis and cancer metastasis. Gene. 2018;642:447–452.
49. Tang D, et al. PSC-derived Galectin-1 inducing epi-thelial-mesenchymal transition of pancreatic duc-tal adenocarcinoma cells by activating the NF-κB pathway. Oncotarget. 2017;8(49):86488–86502. 50. Lein M, et al. Matrix-metalloproteinases and
their inhibitors in plasma and tumor tissue of patients with renal cell carcinoma. Int J Cancer. 2000;85(6):801–804.