http://www.scirp.org/journal/ojap ISSN Online: 2169-2661
ISSN Print: 2169-2653
DOI: 10.4236/ojap.2018.71001 Jan. 5, 2018 1 Open Journal of Air Pollution
An Evaluation of Air Pollution Tolerance Index
and Anticipated Performance Index of Some
Tree Species Considered for Green Belt
Development: A Case Study of Nandesari
Industrial Area, Vadodara, Gujarat, India
Dhruti Patel
*, J. I. Nirmal Kumar
Department of Environmental Science & Technology (DEST), Institute of Science and Technology for Advanced Studies & Research (ISTAR), Vallabh Vidyanagar, India
Abstract
It is well renowned that trees have capacity to reduce the air pollution. It is mandatory to expand tree plantation in industrial area to minimize the threat of pollutants. For green belt development, it is necessary to use plants that are tolerant to air pollution. The present study includes Air pollution tolerance index (APTI) of selected plant species with the help of biochemical analysis. On the basis of APTI and some other socioeconomic and biological parame-ters of plants, Anticipated Performance Index (API) was calculated. Out of twelve species, Ficus benghalensis showed to be the most efficient among oth-ers. As per classification of API, Ficus religiosa tree species is classified into the moderate category. Based on the APTI and API, appropriate plant species for green belt development in industrial area were identified and recommended for mitigating the pollution.
Keywords
Air Pollution, APTI, API, Nandesari, Green Belt
1. Introduction
The status of air quality in every part of the world always parallels the changes in development of surrounding area [1]. Industrial area exhibits major sources of Particulate Matter, SOx and NOx. Depending upon the type of raw material used emission of one or more of these pollutants is obvious. The problem of declining How to cite this paper: Patel, D. and
Nir-mal Kumar, J.I. (2018) An Evaluation of Air Pollution Tolerance Index and Antic-ipated Performance Index of Some Tree Species Considered for Green Belt Devel-opment: A Case Study of Nandesari Indus-trial Area, Vadodara, Gujarat, India. Open Journal of Air Pollution, 7, 1-13.
https://doi.org/10.4236/ojap.2018.71001
Received: June 13, 2017 Accepted: January 2, 2018 Published: January 5, 2018
Copyright © 2018 by authors and Scientific Research Publishing Inc. This work is licensed under the Creative Commons Attribution International License (CC BY 4.0).
DOI: 10.4236/ojap.2018.71001 2 Open Journal of Air Pollution air quality is mainly the result of anthropogenic emissions from traffic, industry and domestic heating, especially affecting the world’s urban residents [2][3]. Air pollution can have profound effects on the health of the entire planet. Increasing human population with decreasing green environment has produced ambient air polluted. Mainly increasing number of industries, vehicular exhaust, and fossil fuels to nuclear energy produces air heavily polluted day by day [4]. The air pol-lution causes health problems in the workers and residents in places near the industrial area, therefore it is essential to study the air quality in the surround-ings of the industries [5] [6]. To terminate the impact of air pollutants, envi-ronmentalists and decision makers have long been emphasizing the need for a “perennial green envelop” in and around industrial areas as well as along road-sides [7][8]. The plant has capacity to provide one of the natural ways of clean-ing the atmosphere by absorption, reflection, diffusion of gaseous through their leaves. Heumann (2002); Psaras and Christodoulakis (1987) have shown the in-teractions between plant and different types of pollutants with the influence of environmental pollution on physiological and ultrastructural aspects [9][10].
Based on responses of plants towards a particular stress as well as gaseous stress, they can be categorized into “sensitive” and “tolerant”. Sensitive species are early indicators of pollution, and the tolerant species help in reducing the overall pol-lution load [11]. Moreover, the present investigation is based on identification of stress tolerant plant species (noise and air pollution) from the study area to de-velop green belt. By the help of the Natural processes, air pollution level can be reduced by precipitation, Chemical reaction and sedimentation [12].
DOI: 0.4236/ojap.2018.71001 3 Open Journal of Air Pollution Table 1. Air pollution tolerance index of tree species studied in Nandesari industrial area, Gujarat.
Sl. no. Name of species A P T R APTI
1 Michelia champaca L. 7.31 5.68 6.2 56 13.26
2 Polyalthia longifolia Sonn. 6.42 6.89 5.78 60.25 15.68
3 Azadirachta indica A. Juss. 6.79 6.2 3.87 54.21 12.98
4 Ficus religiosa 6.98 6.98 9.87 60.54 14.42
5 Ficus benghalensis 6.65 5.93 6.54 55.65 18.65
6 Cassia fistula L. 6.07 5.43 4.44 54.24 13.65
7 Spathodea campanulata P. Beauv. 5.54 6.65 4.65 55.24 11.46
8 Adina cordifolia Hook. f. 5.05 6.87 3.98 51.35 12.05
9 Cassia siamea Lamk. 6.19 5.68 4.55 52.18 12.05
10 Nerium odorum Sonnad. 4.08 6.54 3.52 53.54 8.65
11 Alstonia scholaris (L.) R.Br. 5.26 6.05 3.81 50.42 9.01
12 Cascabela thevetia L. 5.9 5.98 4.73 50.15 9.54
A = Ascorbic Acid , P = pH, T = Total Chlorophyll, R = Relative Water Content (Average mean value).
Table 2. Gradation of plant species based on air pollution tolerance index (APTI) as well as biological parameters and socio-economic importance.
Grading characters Pattern of assessment Grade allotted
1) Tolerance APTI 9.0 - 12.0 +
12.1 - 15.0 ++
15.1 - 18.0 +++
18.1 - 21.0 ++++
21.1 - 24.0 ++++
2) Biological and socio-economic Plant habit Small -
Medium +
Large ++
Canopy structure Sparse/irregular/globular - Spreading
crown/open/semi-dense +
Spreading dense ++
Type of plant Deciduous -
Evergreen +
3) Laminar structure Size Small -
Medium +
Large ++
Texture Smooth -
Coriaceous +
Hardiness Delineate -
Hardy +
Economic value Less than three uses -
Three or four uses +
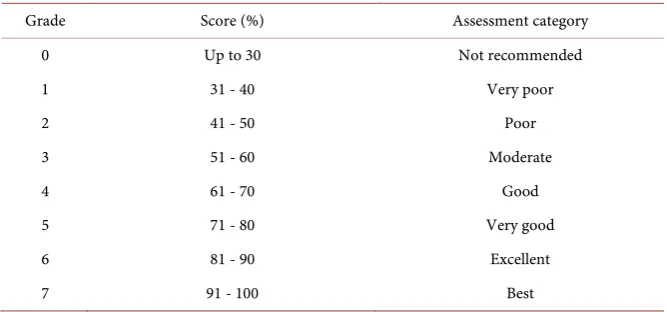
[image:3.595.203.540.363.733.2]DOI: 10.4236/ojap.2018.71001 4 Open Journal of Air Pollution Table 3. Anticipated performance index (API) of plant species.
Grade Score (%) Assessment category
0 Up to 30 Not recommended
1 31 - 40 Very poor
2 41 - 50 Poor
3 51 - 60 Moderate
4 61 - 70 Good
5 71 - 80 Very good
6 81 - 90 Excellent
7 91 - 100 Best
2. Materials and Methods
2.1. Study Area
The study was carried out in and around the Nandesari industrial area, which is situated in the Vadodara district. Nandesari has a large notified industrial area comprising of large amount of chemical factories. It homes Gujarat first GIDC (Gujarat Industrial Development Corporation) with concrete roads and storm water drains. Nandesari is a small town of Gujarat, located at 22.4103˚ north lati-tude and, 73.0913˚ east longilati-tude. It has an average elevation of 34 meters. Cli-mate is subtropical, with mild winters and warm summers. The city is situated between 18˚96' north latitude and 72˚81' east longitude. The weather is typical coastal sultry and humid. The city receives average rainfall in the range of 1500 mm to 2000 mm. The place experiences the onset of the monsoon in the month of June and experiences monsoon till the end of September. The average mini-mum temperature is recorded between 25˚C to 37˚C.
2.2. Air Pollutants Sampling and Measurement
DOI: 0.4236/ojap.2018.71001 5 Open Journal of Air Pollution Figure 1. Map showing study area of Nandesari industrial area.
2.3. Biochemical Characteristics Analysis
In order to collect the plant leaf samples, a plant survey was made at the three selected sites, i.e., Site 1, Site 2, Site 3 and on that basis twelve common plants of same age were elected for the foliar biochemical studies. The matured leaves from each plant species were plucked from individual sites. These leaves were placed into the polythene bags and brought to the laboratory to preserve at 25 ± 0.5◦C until analysis. The plant samples were analyzed for different parameters within 24 hours of their harvesting. The leaf samples were analyzed for pH (P) of leaf extract [13], Chlorophyll (T), Ascorbic acid (A) [17][18], and Relative Wa-ter Content (R) [19]. The APTI, an empirical value representing tolerance level of a Plant to air pollution, was used to interpret the impact of pollution on the plants [13]. The APTI was calculated by using the following formula for a given plant species.
(
)
APTI
10
A T+P +R
=
where, A = Ascorbic acid content (mg∙gm−1), T = total chlorophyll (mg∙g−1),
P = pH of leaf extract, and
R = Relative water content of leaf (%).
2.4. Evaluation of API
DOI: 10.4236/ojap.2018.71001 6 Open Journal of Air Pollution of their API. The API values were calculated by using various biological and so-cioeconomic, as well as some biochemical characteristics, such as APTI, plant habit, canopy structure and economic value (see Table 1). The method to calcu-late API value is in the table. Based on this pattern grading of 12 plant species, promising plants were recommended for green belt development.
3. Result and Discussion
As shown in Table 1, the highest chlorophyll content (mg∙g−1 dry weight) was observed in Ficus religiosa (9.87) followed by Ficus benghalensis (6.54), Michelia champaca (5.45). Chlorophyll estimation is an important tool to evaluate the ef-fects of air pollutants on plants as it plays an important role in plant metabolism so that any drop in chlorophyll content indicates direct impact on plant growth [20]. In the present investigation, the total chlorophyll content was found com-paratively higher at control site and lower at polluted site. The higher the level of pollutants, the lower the chlorophyll content as certain pollutants diminishes the total chlorophyll content [21]. Many previous APTI studies have shown similar findings [22]. Agbaire et al., (2014) & Prabhatkumar et al. (2013) also suggested that high levels industrial pollution reduces chlorophyll content of plant leaves around the industrial area [19][23].
3.1. Biochemical Analysis of Plants
Results from biochemical analysis of plants revealed that higher ascorbic acid contents were recorded in Michelia champaca (7.31), followed by Ficus religiosa (6.98), Azadirachta indica (6.79), Polyalthia longifolia (6.42), Cassia siamea (6.19), Cassia fistula (6.09)) [19]Table 1 Ascorbic acid is concentrated mostly in chloroplasts that act as an antioxidant. It is mostly found in growing parts of the plant and enhances resistance to adverse environmental conditions, including air pollution [23][24]. Earlier Air pollution and soil contamination results have showed a decrease in leaf ascorbic acid content in exposed Tibouchina pulchra samplings [25].
In this study, Ficus religiosa has the maximum relative water content of 64% and followed by Polyalthia longifolia 60%, Spathodea campanulata 55%, Ficus benghalensis 55%. High water content within a plant body helps to maintain its physiological balance under stressful conditions, such as exposure to air pollu-tion [26] (Table 1). The highest Relative Water Content (RWC) was found in response to the high availability of soil, water content and lower evaporation and transpiration rate. RWC of a leaf is the water present in response to its full tur-gidity. Under air polluted conditions, transpiration rates are frequently high, which leads to dryness. Therefore, the maintenance of RWC by the plant may determine its relative tolerance to pollution. Therefore, the high RWCs of plants in an industrial area sample may be responsible for the normal function of plant biological processes [27].
DOI: 0.4236/ojap.2018.71001 7 Open Journal of Air Pollution presence of certain air pollution in the atmosphere. As leaf pH values increased in the polluted area compared with that of control. Similarly, rise in pH values in polluted site was observed [27]. The lowest pH concentration was found in case of Michelia champaca (5.68) followed by Cassia fistula (5.43), Cassia siamea (5.68), Cascabela thevetia (5.98). The plants were observed to have lower pH as washing of leaves lowers dust accumulation. On unalike, where dust accumula-tion is more, dust particle dissoluaccumula-tion in cell sap is higher which results in rise in the pH [28]. It has been reported that the lower leaf pH is due to presence of acidic pollutants [29]. Swami et al., (2004) also observed similar results. The changes in leaf-extract pH might influence the stomata sensitivity in presence of air pol-lutants. Consequently, sensitive plants had higher leaf-extract pH than tolerant plants. Low leaf pH extract showed good correlation with sensitivity to air pollu-tion and also reduces photosynthetic process in plants [30].
The NOx, SO2 and PM2.5 content estimated in the ambient air of the study sta-tions were within the NAAQS limits for residential area and industrial areas [31]. The main air pollutants in Nandesari industrial area are SO2, NO2, PM2.5. The concentrations of all of these pollutants were within the limits prescribed by CPCB. The average concentrations of three study area were SO2, NO2, PM2.5 in the Nandesari industrial area are 52, 46, and 35 μg/m3, correspondingly. Higher concentrations in winter season may be credited to the atmospheric inversion [32].
During inversion the normal atmospheric conditions i.e. cool air above and warm air below gets inverted. This condition leads to trap an intense layer of cold air under a layer of warm air. This dormant condition of atmosphere traps the pollutants close to the surface of the earth. Dust interception ability of plants depends on their surface geometry, phyllotaxy, leaf external characteristics (such as hairs, cuticle, etc.), and height and canopy of trees [6][13]. The methodology of APTI and API can be used globally as they are based on parameters and un-iversally significant biological and socio-economic characters. The planting of larger tree has been avoided because of their thick canopy structures and too close with each other, as this may lead to chances of obstructing the scattering of pollutants, thus provoking the pollution problem. Leaf petioles have more capacity to eliminate particulate than either twigs (stem) or leaf lamina [33]. Green belts offer one of the natural ways of cleaning the atmosphere by absorption of gaseous pol-lutants, particulates and noise through their leaves. Plants with bulky leaves can act as efficient pollutant trapping device.
3.2. Air Pollution Tolerance Index
DOI: 10.4236/ojap.2018.71001 8 Open Journal of Air Pollution found to follow this order; Ficus benghalensis showed the highest APTI value at all the sites followed by Polyalthia longifolia > Ficus religiosa > Cassia fistula > Michelia champaca > Azadirachta indica > Adina cordifolia > Cassia siamea > Cascabela thevetia > Alstonia scholaris > Nerium odorum. Different plant spe-cies show substantial variation in their susceptibility towards air pollution. The plants with high and low APTI can serve as tolerant and sensitive species respectively. All other plants were found to be sensitive and accommodating as air pollution indicator [34].
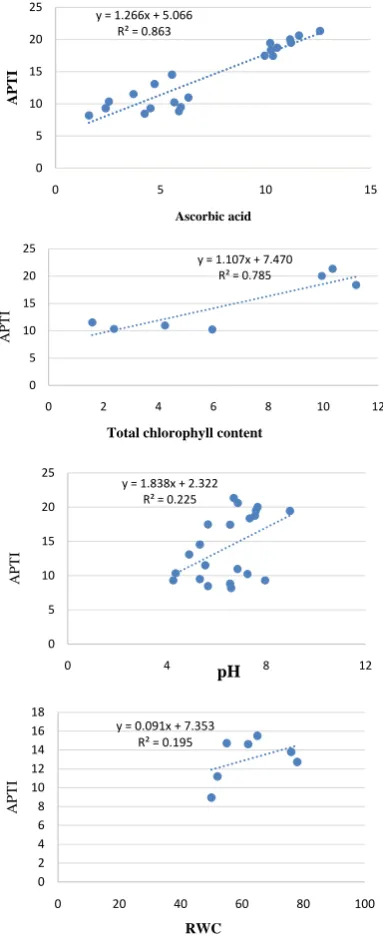
[image:8.595.278.470.220.689.2]The linear regression plots of individual variables with APTI (Figure 2) show
Figure 2. Linear regression plots of APTI with individual variables like ascorbic acid, chlo-rophyll content, PH and relative water contents.
y = 1.266x + 5.066 R² = 0.863
0 5 10 15 20 25
0 5 10 15
A
P
TI
Ascorbic acid
y = 1.107x + 7.470 R² = 0.785
0 5 10 15 20 25
0 2 4 6 8 10 12
AP
T
I
Total chlorophyll content
y = 1.838x + 2.322 R² = 0.225
0 5 10 15 20 25
0 4 8 12
AP
T
I
pH
y = 0.091x + 7.353 R² = 0.195
0 2 4 6 8 10 12 14 16 18
0 20 40 60 80 100
AP
T
I
DOI: 0.4236/ojap.2018.71001 9 Open Journal of Air Pollution that a significant correlation exists between APTI and ascorbic acid content (R2 = 0.86387) while a positive correlation was found between APTI and total chlo-rophyll content (R2 = 0.7853). On the contrary, a non-significant & low correla-tion with leaf extract pH (R2 = 0.2254) and relative water content (R2 = 0.1952) were observed. It brings to knowledge that ascorbic acid and chlorophyll content of the leaf are responsible factors on which the APTI relies [35].
3.3. Estimation of API
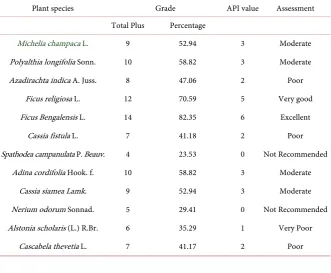
[image:9.595.207.539.462.735.2]Out of above mentioned Ficus benghalensis rank first among all plants studied and is a keystone species [24]. Keystone species can be expressed as species which play a key role in the sustenance of ecosystems; it has a consistent effect on its environment relative to its abundance. An ecosystem may experience a remarkable shift if a keystone species is removed, even if that species is a minute part of the ecosystem on account of productivity. Henceforth, it will be highly appropriate for planting this in industrial area to assist improvement in pollu-tion. F. religiosa was judged to be in the “Very Good” category and was recom-mended for plantation (Table 4). These species have an intense canopy of ever-green foliage and is well known for its economic and aesthetic value [16] [36]. Apart from this investigation, 4 of the 13 tree species drops in the moderately suitable category, but can be recommended for plantation due to their aesthetic value (Table 4). The rest of the naturally growing species in the study area was not recommended for planting due to their particularly poor pollution tolerance indices or their very low API values (Table 5).
Table 4. Anticipated performance index (API) of different tree species in Nandesari in-dustrial area.
Plant species Grade API value Assessment
Total Plus Percentage
Michelia champaca L. 9 52.94 3 Moderate
Polyalthia longifolia Sonn. 10 58.82 3 Moderate
Azadirachta indica A. Juss. 8 47.06 2 Poor
Ficus religiosa L. 12 70.59 5 Very good
Ficus Bengalensis L. 14 82.35 6 Excellent
Cassia fistula L. 7 41.18 2 Poor
Spathodea campanulata P. Beauv. 4 23.53 0 Not Recommended
Adina cordifolia Hook. f. 10 58.82 3 Moderate
Cassia siamea Lamk. 9 52.94 3 Moderate
Nerium odorum Sonnad. 5 29.41 0 Not Recommended
Alstonia scholaris (L.) R.Br. 6 35.29 1 Very Poor
DOI: 10.4236/ojap.2018.71001 10 Open Journal of Air Pollution Table 5. Assessment of plant species based on their APTI values and some biological and socio-economic characters.
S. No. Name of Plant APTI Tree Habit Structure Canopy Type of Tree Laminar Importance Economic Hardiness Grade Allotted Grade API
Size Texture Total Plus (+) % scoring
1 champace L. Michelia ++ + + + + + + - + 9 52.94 3
2 longifolia Sonn. Polyalthia ++ + + + + + - + + 10 58.82 3
3 indica A. Juss. Azadirachta + ++ + + - - - + + + 8 47.06 2
4 Ficus religiosa ++ ++ + + + + + + + + 12 70.59 5
5 benghalensis Ficus ++++ ++ + + + + + + + + 14 82.35 6
6 Cassia fistula L. ++ + + - + - + + 7 41.18 2
7 campanulata P. Spathodea
Beauv. + + - + + - - - 4 23.53 0
8 Adina cordifolia Hook. f. + ++ ++ - ++ + + + 10 58.82 3
9 Cassia siamea Lamk. ++ + + + + + + + 9 52.94 3
10 Nerium odorum Sonnad. + + + - + + - - 5 29.41 0
11. Alstonia scholaris (L.) R.Br. + + + + - - + + 6 35.29 1
12. thevetia L. Cascabela + - + + + + + + 7 41.17 2
4. Conclusion
For the green belt development in the industrial area, our study reveals that evalu-ation of anticipated performance of plants might be very useful in the selection of appropriate tree species. Some plants have been classified according to their degree of sensitivity and tolerance towards various air pollutants. The present study indicated that Ficus benghalensis L.species is most suitable sink for air pollution, which acts as key stone species. These plants can be utilized for green belt develop-ment in industrial area for reduction of the level of the air pollution. Further recommended species were of high aesthetic and socio-economic values. Plants with high APTI and API values are suggested for the development of green belts in the area. Therefore, these plant species may be integrated into a green belt design to assist in the long term air pollution planning of this industrial area.
References
[1] Agarwal, S.K. (1986) A New Distributional Function of Foliar Phenol Concentra-tion in the EvaluaConcentra-tion of Plants for Their Air PolluConcentra-tion Tolerance Index. Acta Ecol-ogy, 1986, 29-36.
[2] Rayfield, D., Longhurst, J., Watson, A., Hewison, T., Raper, D.W., Conlan, D.E. and Owen, B. (1998) A Methodology for Estimation of Vehicle Emissions in an Urban Environment: An Example from Greater Manchester. Environmentalist, 18, 175-182.
DOI: 0.4236/ojap.2018.71001 11 Open Journal of Air Pollution
[3] Moreno, T., Lavín, J., Querol, X., Alastuey, A., Viana, M. and Gibbons, W. (2009) Controls on Hourly Variations in Urban Background Air Pollutant Concentrations.
Atmospheric Environment, 43, 4178-4186.
https://doi.org/10.1016/j.atmosenv.2009.05.041
[4] Foley, J.A. (2005) Global Consequences of Land Use. Science, 309, 570-574.
https://doi.org/10.1126/science.1111772
[5] Sarasamma, J.D. and Narayanan, B.K. (2014) Air Quality Assessment in the Sur-roundings of KMML Industrial Area, Chavara in Kerala, South India. Aerosol and Air Quality Research, 146, 1769-1778.
[6] Nowak, D. (1994) Air Pollution Removal by Chicago’s Urban Forest. Chicago’s Ur-ban Forest Ecosystem: Results of the Chicago UrUr-ban Forest Climate Project. 63-81. [7] Chaulya, S.K., Chakraborty, M.K. and Singh, R.S. (2001) Air Pollution Modelling
for a Proposed Limestone Quarry. Water, Air, & Soil Pollution, 126, 171-191.
https://doi.org/10.1023/A:1005279819145
[8] Rao, P.S., Gavane, A.G., Ankam, S.S., Ansari, M.F., Pandit, V.I. and Nema, P. (2004) Performance Evaluation of a Green Belt in a Petroleum Refinery: A Case Study.
Ecological Engineering, 23, 77-84. https://doi.org/10.1016/j.ecoleng.2004.06.013
[9] Heumann, H.-G. (2002) Ultrastructural Localization of Zinc in Zinc-Tolerant Ar-meria maritima ssp. halleri by Autometallography. Journal of Plant Physiology, 159, 191-203. https://doi.org/10.1078/0176-1617-00553
[10] Psaras, G.K. and Christodoulakis, N.S. (1987) Air Pollution Effects on the Ultra-structure of Phlomis fruticosa Mesophyll Cells. Bulletin of Environmental Conta-mination and Toxicology, 38, 610-617. https://doi.org/10.1007/BF01608593
[11] Rao, D.N. (1983) Sulphur Dioxide Pollution versus Plant Injury with Special Refer-ence to Fumigation and Precipitation. Proceedings Symposium on Air Pollution Control, 1, 91-96.
[12] Rasmuseen, K.H., Taheri, M. and Kabel, R.L. (1974) Source of Natural Removal Processes for Some Atmospheric Pollutants. PA Publication, Washington DC. [13] Singh, S.K. and Rao, D.N. (1983) Evaluation of Plants for Their Tolerance to Air
Pollution. Symposium on Air Pollution Control, 1983, 218-224.
[14] Tambussi, E.A., Bartoli, C.G., Beltrano, J., Guiamet, J.J. and Araus, J.L. (2000) Oxidative Damage to Thylakoid Proteins in Water-Stressed Leaves of Wheat ( Tri-ticum aestivum). Physiologia Plantarum, 108, 398-404.
https://doi.org/10.1034/j.1399-3054.2000.108004398.x
[15] Prajapati, S.K. and Tripathi, B.D. (2008) Anticipated Performance Index of Some Tree Species Considered for Green Belt Development in and around an Urban Area: A Case Study of Varanasi City, India. Journal of Environmental Management, 88, 1343-1349. https://doi.org/10.1016/j.jenvman.2007.07.002
[16] Pathak, V., Tripathi, B.D. and Mishra, V.K. (2011) Evaluation of Anticipated Per-formance Index of Some Tree Species for Green Belt Development to Mitigate Traf-fic Generated Noise. Urban Forestry & Urban Greening, 10, 61-66.
https://doi.org/10.1016/j.ufug.2010.06.008
[17] Sadasivam, S. and Manickam, A. (1996) Biochemical Methods. New Age Interna-tional.
[18] Patel, A.M. and Kousar, H. (2011) Assessment of Relative Water Content, Leaf Ex-tract pH, Ascorbic Acid and Total Chlorophyll of Some Plant Species Growing in Shivamogga. Plant Archives, 11, 935-939.
DOI: 10.4236/ojap.2018.71001 12 Open Journal of Air Pollution
Erhoike-Kokori Oil Exploration Site of Delta State, Nigeria. International Journal of Physical Sciences, 4, 366-368.
[20] Joshi, P.C. and Swami, A. (2009) Air Pollution Induced Changes in the Photosyn-thetic Pigments of Selected Plant Species. Journal of Environmental Biology, 30, 295-298.
[21] Allen, L.H., et al. (1987) Response of Vegetation to Rising Carbon Dioxide: Photo-synthesis, Biomass, and Seed Yield of Soybean. Global Biogeochemical Cycles, 1, 1-14.
https://doi.org/10.1029/GB001i001p00001
[22] Bakiyaraj, R. and Ayyappan, D. (2014) Air Pollution Tolerance Index of Some Ter-restrial Plants around an Industrial Area. International Journal of Modern Research and Reviews, 2, 1-7.
[23] Chen, Y.M., Lucas, P.W. and Wellburn, A.R. (1990) Relative Relationship between Foliar Injury and Change in Antioxidants Levels in Red and Norway Spruce Ex-posed to Acidic Mists. Environmental Pollution, 69, 1-15.
https://doi.org/10.1016/0269-7491(91)90159-T
[24] Keller, T. and Schwager, H. (1977) Air Pollution and Ascorbic Acid. Forest Pathol-ogy, 7, 338-350.https://doi.org/10.1111/j.1439-0329.1977.tb00603.x
[25] Klumpp, G., Furlan, C.M., Domingos, M. and Klumpp, A. (2000) Response of Stress Indicators and Growth Parameters of Tibouchinapulchra Cogn. Exposed to Air and Soil Pollution near the Industrial Complex of Cubatão, Brazil. Science of the Total Environment, 246, 79-91.https://doi.org/10.1016/S0048-9697(99)00453-2
[26] Innes, J.L. and Haron, A.H. (2000) Air Pollution and the Forests of Developing and Rapidly Industrializing Regions. Report No. 4 of the IUFRO Task Force on Envi-ronmental Change. CABI, Wallingford.
[27] Rai, P., Panda, L., Chutia, B. and Singh, M. (2007) Comparative Assessment of Air Pollution Tolerance Index (APTI) in the Industrial (Rourkela) and Non-Industrial Area (Aizawl) of India: An Eco Management Approach. African Journal of Envi-ronmental Science and Technology, 7, 944-948.
[28] Katiyar, V. and Dubey, P.S. (2001) Sulphur Dioxide Sensitivity on Two Stage of Leaf Development in a Few Tropical Tree Species. Indian Journal of Environment and Toxicology, 11, 78-81.
[29] Scholz, F. and Reck, S. (1977) Effects of Acids on Forest Trees as Measured by Ti-tration in Vitro, Inheritance of Buffering Capacity in Piceaabies. Water, Air, & Soil Pollution, 8, 41-45.
[30] Yan, D. and Hui, J. (2008) Variation in Air Pollution Tolerance Index of Plants near a Steel Factory. Implications for Landscape-Plant Species Selection for Industrial Areas. Wseas Transactions on Environment and Development, 1, 24-30.
[31] C. Pollution C. B. and Ministry of Forest and Climate Change (2014) Revised Na-tional Ambient Air Quality Standards (NAAQS).
[32] Wong, N.H., et al. (2010) Thermal Evaluation of Vertical Greenery Systems for Building Walls. Building and Environment, 45, 663-672.
https://doi.org/10.1016/j.buildenv.2009.08.005
[33] Ingold, C.T. (1971) Fungal Spores: Their Liberation and Dispersal.
[34] Seyyednjad, S.M., Majdian, K., Koochak, H. and Niknejad, M. (2011) Air Pollution Tolerance Indices of Some Plants around Industrial Zone in South of Iran. Asian Journal of Biological Sciences, 4, 300-305.https://doi.org/10.3923/ajbs.2011.300.305
Tropi-DOI: 0.4236/ojap.2018.71001 13 Open Journal of Air Pollution
cal City. Landscape and Urban Planning, 144, 119-127.
https://doi.org/10.1016/j.landurbplan.2015.08.014
[36] Shannigrahi, A.S., Fukushima, T. and Sharma, R.C. (2004) Anticipated Air Pollu-tion Tolerance of Some Plant Species Considered for Green Belt Development in and around an Industrial/Urban Area in India: An Overview. International Journal of Environmental Studies, 61, 125-137.