http://www.scirp.org/journal/jsip ISSN Online: 2159-4481
ISSN Print: 2159-4465
DOI: 10.4236/jsip.2018.91004 Feb. 28, 2018 63 Journal of Signal and Information Processing
A Multiple Random Feature Extraction
Algorithm for Image Object Tracking
Lan-Rong Dung
1, Shih-Chi Wang
1, Yin-Yi Wu
21Institute of Electrical and Control Engineering, National Chiao Tung University, Taiwan 2Chung-Shan Institute of Science Technology, Taiwan
Abstract
This paper proposes an object-tracking algorithm with multiple randomly- generated features. We mainly improve the tracking performance which is sometimes good and sometimes bad in compressive tracking. In compressive tracking, the image features are generated by random projection. The result-ing image features are affected by the random numbers so that the results of each execution are different. If the obvious features of the target are not cap-tured, the tracker is likely to fail. Therefore the tracking results are inconsis-tent for each execution. The proposed algorithm uses a number of different image features to track, and chooses the best tracking result by measuring the similarity with the target model. It reduces the chances to determine the target location by the poor image features. In this paper, we use the Bhattacharyya coefficient to choose the best tracking result. The experimental results show that the proposed tracking algorithm can greatly reduce the tracking errors. The best performance improvements in terms of center location error, bounding box overlap ratio and success rate are from 63.62 pixels to 15.45 pixels, from 31.75% to 64.48% and from 38.51% to 82.58%, respectively.
Keywords
Object Tracking, Feature Extraction, Image Processing
1. Introduction
Object tracking is an application in the field of computer vision. It is commonly used in monitoring systems or human-computer interaction. A variety of track-ing algorithms have been proposed. In the IVT method [1], the incremental principal component analysis is used to reduce the image space. The IVT me-thod learns a target model that can be continually updated to adapt to track the How to cite this paper: Dung, L.-R.,
Wang, S.-C. and Wu, Y.-Y. (2018) A Mul-tiple Random Feature Extraction Algo-rithm for Image Object Tracking. Journal of Signal and Information Processing, 9, 63-71.
https://doi.org/10.4236/jsip.2018.91004
Received: November 27, 2017 Accepted: February 25, 2018 Published: February 28, 2018
Copyright © 2018 by authors and Scientific Research Publishing Inc. This work is licensed under the Creative Commons Attribution International License (CC BY 4.0).
http://creativecommons.org/licenses/by/4.0/
DOI: 10.4236/jsip.2018.91004 64 Journal of Signal and Information Processing changing target. In [2], the target model is decomposed into several basic target models constructed by sparse principal component analysis. The tracker tracks the target with a set of additional basic motion models. It can deal with appear-ance transformation or movement. However, these methods have a huge amount of computation and make it difficult to run in real time.
The compressive tracking method [3] is a fast tracking algorithm using com-pressed sensing theory. It projects the high-dimensional image features into the lower-dimensional image space by a very sparse projection matrix, and tracks the target with the low-dimensional image features generated by random projec-tion. It reduces a lot of image features needed to compare and greatly reduces the computational complexity of the algorithm. However, the image features generated by the projection matrix are completely random. Even in the same testing video, each time the image features have a considerable change. It makes the results of each execution sometimes good and sometimes bad and difficult to use effectively.
To solve the problem, an object-tracking algorithm with multiple randomly- generated features is proposed in the present paper. Tracking with the additional and different image features can produce a number of different tracking results. If we choose the most ideal tracking result as the final target position, there will be more opportunities to produce a better result than the original algorithm.
2. Proposed Method
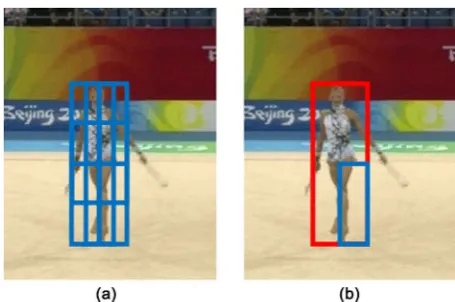
In this paper, the proposed tracking algorithm is showed in Figure 1. In order to solve the drift problem caused by occlusion, we refer to [4] and apply the sub- region classifiers to our algorithm. We reduce the number of sub-region classifi-ers to speed up the algorithm. Only nine sub-region classificlassifi-ers are used for tracking. In addition to this, the locations of the sub-region classifiers are evenly distributed in order to avoid excessive concentration or excessive dispersion of the sub-region classifiers. In the process of tracking, each sub-region classifier independently tracks the specified part of the target. If the target is partially oc-cluded, only the occluded part of the tracking will be affected. As a result, the drift problem due to occlusion can be avoided. In the classifier update phase, each sub-region classifier is decided whether to update based on the respective classifier scores in order to prevent the target model from being updated by oc-clusions. If the score of the classifier is less than zero, it indicates that the proba-bility of the region being judged as belonging to a non-target object is relatively large. Therefore, the target model of the sub-region is not updated to retain the object information.
DOI: 10.4236/jsip.2018.91004 65 Journal of Signal and Information Processing
Figure 1. Flowchart of the proposed algorithm.
Figure 2. The distribution of sub-regions. (a) All sub-regions; (b) a single sub-region.
and Tij is the coordinates of the upper left corner of the sub-regions.
, , 0 ~ 2, 0 ~ 2
2 2
s s
ij
w h
T =x i+ × y+ ×j i= j=
(1) [image:3.595.258.486.425.576.2]
DOI: 10.4236/jsip.2018.91004 66 Journal of Signal and Information Processing background model. p y
(
=1 |v1j)
is the posterior probability for sample v1j. N is the number of positive samples and L is the number of negative samples. is the location function and c is a normalization constant. w is a constant.(
)
1(
)
0 1 1
0
1 | 1 |
N
j j
j
p y w p y v
− +
=
= V =
∑
= (2)( )1 ( )10
0
1
e l vj l v
j w
c
− −
= (3)
(
)
1(
)
0 0
1 | 0 |
N L
j j N
p y wp y v
+ − −
=
= V =
∑
= (4)In the proposed tracking algorithm, we use multiple sets of randomly-generated and different image features to track respectively. After each time the highest classifier scores for candidate positions are calculated, we select the optimal tracking result as the final target location. Because of the multiple sets of image features, there are additional opportunities to produce the better results than the original. Therefore, if the best candidate can be selected from the candidate im-ages, it is possible to obtain a better tracking performance than the conventional one. In the proposed tracking algorithm, the optimal tracking result is deter-mined by calculating the Bhattacharyya coefficient between the candidate image and the reference image. The Bhattacharyya coefficient is defined as Equation (5), where N is the total number of indices of the histogram. The target image and the candidate image model are proposed in [6] and shown in Equations ((6) and (8)). Where δ is the Kronecker delta function. C and Ch are the
normaliza-tion constants. The large value of the Bhattacharyya coefficient indicates that the candidate image has high similarity with the target image. Therefore, after the end of each tracking we select the largest Bhattacharyya coefficient correspond-ing to the candidate image position as the trackcorrespond-ing result.
[ ]
( ) ( )1
, uN u u
p q p q
ρ =
∑
= (5)
( )
2(
( )
)
1
n
u i i
i
q C k x∗ δ b x∗ u
=
=
∑
− (6)( )
21 1 n i i C
k x∗
=
=
∑
(7)
( )
2(
( )
)
1 h n
i
u h i
i
y x
p y C k b x u h δ
=
−
= −
∑
(8)
2 1 1 h h n i i C y x k h = = −
∑
(9)
de-DOI: 10.4236/jsip.2018.91004 67 Journal of Signal and Information Processing tected, we use an additional target model for scale detection and tracking. The second target model is updated less frequently and will not be updated until the end of every fifth frame. Slower update frequency is intended to preserve the target image information before the five frames. The detected image will be more different from the second target model and it is relatively easy to detect changes in the target size.
[image:5.595.209.543.199.711.2]The proposed multi-scale tracking algorithm is showed in Figure 3. Multi- scale detection is performed at the end of the trace phase and executes once
DOI: 10.4236/jsip.2018.91004 68 Journal of Signal and Information Processing every five frames. If scale detection is required, the image features of different scales and the second target model are used to track again. If the highest classifi-er score is dclassifi-erived from a largclassifi-er or smallclassifi-er scale image feature, it represents a change in size of the target. Therefore, the target position is determined by the highest classifier score obtained in the final tracking. If the highest classifier score is derived from the invariant scale image features, the tracking result ob-tained before the scale detection is taken as the target position. Because the pre-vious result is tracked with the first target model updated each frame, it is more accurate than the result tracked with the second target model.
In addition, the dramatic change in the size of the object is usually the case in the distance between the target and the observer has a huge change. The color of the target will change due to the influence of the medium between the target and the observer. Therefore, the target model used in the multi-scale detection needs to be updated to reduce the impact of target color changes. The updating me-thod is proposed in [7] and shown in Equation (11). Where ( )u
t
q is the updated target model in frame t, λ is learning parameter and ( )u
p is the model of the final tracing results in frame t.
( )
(
)
( ) ( )1 1
u u u
t t
q = −λ q− +λp (10)
3. Experimental Results
The experiment parameters used in this paper are consistent. There are 10 weak classifiers in each sub-region. The learning parameter λ is set to 0.85. The scale change parameter δ is set to 0.1. Twenty experiments are tested for each testing video. Measurements are averaged over 20 experiments. Tables 1-3 show the results of the experiment with three metrics. It can be observed from the expe-rimental data that the proposed two sets of feature tracking algorithm have a significant improvement, regardless of which metric is used.
Table 4 shows the results of the multi-scale tracking experiment. The left side is the result of tracking with single feature. The right side is the result of tracking with two features. It can be observed from the above table that in most of the test videos, the tracking results with two sets of features are better. There is signifi-cant progress in the difficult examples, such as testing video Bus, Car_silver and
Table 1. Center location error (CLE) (in pixels) of the single-scale tracking experiments.
Testing video Single feature Two features Testing video Single feature Two features
Campus 6.73 5.21 Ball 62.12 28.25
T-junction 14.69 7.37 Hand 16.05 8.92
Station 24.14 14.26 Person crossing 46.76 26.31
Fighting 10.53 6.15 Gym 63.62 15.45
Fighting disappearance 35.96 9.05 Basketball 62.26 22.54
Police 14.76 11.40 Person floor 43.80 20.02
DOI: 10.4236/jsip.2018.91004 69 Journal of Signal and Information Processing
Table 2. Bounding box oveerlap ratio (BBOR) (%) of the single-scale tracking experi-ments.
Testing video Single feature Two features Testing video Single feature Two features
Campus 73.16 80.31 Ball 29.07 52.94
T-junction 55.77 57.86 Hand 53.88 63.95
Station 50.02 59.88 Person crossing 48.19 68.21
Fighting 67.47 76.38 Gym 31.75 64.48
Fighting disappearance 60.01 76.00 Basketball 43.83 67.78
Police 71.21 73.82 Person floor 44.75 67.93
Worker 69.19 69.49 Skating 42.41 59.60
Table 3. Success rate (SR) (%) of the single-scale tracking experiments.
Testing video Single feature Two features Testing video Single feature Two features
Campus 92.57 99.37 Ball 24.26 59.13
T-junction 55.23 63.53 Hand 62.76 78.81
Station 51.34 73.25 Person crossing 55.06 74.81
Fighting 84.98 97.37 Gym 38.51 82.58
Fighting disappearance 69.19 93.25 Basketball 50.04 87.37
Police 91.54 89.07 Person floor 52.75 81.25
[image:7.595.209.540.437.623.2]Worker 75.40 89.80 Skating 47.30 71.36
Table 4. The multi-scale tracking experiments.
Testing video Single feature Two features
CLE BBOR SR CLE BBOR SR
Bus 28.67 56.37 68.66 23.44 61.59 76.64
Car_silver 27.76 59.60 71.87 10.20 63.03 81.65
Car_boulevard 5.78 69.58 90.78 5.38 72.89 93.88
Van 10.59 79.18 98.15 7.65 81.80 99.99
Car_blue 18.67 66.80 84.61 6.12 68.33 86.76
Car_scooter 4.61 74.79 90.82 3.72 78.00 95.31
Car_white 7.10 81.57 99.97 4.02 90.01 97.99
Car_red 4.80 81.51 98.81 5.62 80.11 99.58
Freeway 6.60 78.05 99.68 27.23 46.78 30.15
re-DOI: 10.4236/jsip.2018.91004 70 Journal of Signal and Information Processing sults with single feature. Because we use the image color as a discriminant me-thod, It is easy to select an erroneous candidate image when a similar color ap-pears in the background. Testing video Freeway is an obvious example. The tracker drifts away because of the interference caused by the background color. It causes the classifier to update by the background image, so there are poor re-sults.
Table 5 shows the speed of the proposed tracking algorithm. The experimen-tal results show that the speed of the algorithm is related to the image size, and the larger the image size, the slower the speed. The proposed single scale track-ing algorithm can achieve near real-time speed when the image size is not too large. In addition, the speed of the multi-scale tracking algorithm is not reduced to one third of the speed of the single scale algorithm.
4. Conclusion
The tracking algorithm proposed in this paper is mainly aimed at improving the tracking resulting in compressive tracking. We use a number of different sets of image features to track and produce better tracking performance by selecting the best tracking results. For the choice of tracking results, we experiment with the Bhattacharyya coefficient. According to the experimental results, using the Bhattacharyya coefficient to judge the results can produce very good experi-mental results. The color information of the object is usually no dramatic change. Therefore, most tracking such as occlusion, deformation, or similar background can be overcome by selecting best tracking result. Significant im-provements can be seen in the three metrics used to measure performance. The
Table 5. Average frame per second (FPS) of the single-scale tracking experiments.
Testing video Single feature Two features Image size
Campus 18.4077 15.4067 1280 × 480
T-junction 24.3139 19.5400 768 × 576
Station 34.7422 19.4261 720 × 576
Fighting 28.5837 21.4797 640 × 480
Fighting disappearance 28.5216 21.5955 640 × 480
Police 36.2956 25.3854 640 × 360
Worker 40.5832 27.9352 528 × 360
Bus 34.7153 20.5242
640 × 360
Car_silver 35.3681 21.3057
Car_boulevard 35.2754 21.7842
Van 35.6460 19.9841
Car_blue 34.9502 22.1828
Car_scooter 35.0141 20.4013
DOI: 10.4236/jsip.2018.91004 71 Journal of Signal and Information Processing experimental results show that the proposed tracking algorithm can greatly re-duce the tracking errors. The best performance improvements in terms of center location error, bounding box overlap ratio and success rate are from 63.62 pixels to 15.45 pixels, from 31.75% to 64.48% and from 38.51% to 82.58%, respectively. Moreover, when the image size is not large, it will be able to achieve real-time computing.
Acknowledgements
The authors would like to thank the Editor and the referee for their comments. This work was supported in part by the National Science Council, Taiwan, under Grant No.98-2221-E-009-138.
References
[1] Ross, D.A., Lim, J., Lin, R.S. and Yang, M.H. (2008) Incremental Learning for Ro-bust Visual Tracking. International Journal of Computer Vision, 77, 125-141.
https://doi.org/10.1007/s11263-007-0075-7
[2] Kwon, J. and Lee, K.M. (2010) Visual Tracking Decomposition. IEEE Conference on Computer Vision and Pattern Recognition, 1269-1276.
https://doi.org/10.1109/CVPR.2010.5539821
[3] Zhang, K., Zhang, L. and Yang, M.H. (2014) Fast Compressive Tracking. IEEE Transactions on Pattern Analysis and Machine Intelligence, 36, 2002-2015.
https://doi.org/10.1109/TPAMI.2014.2315808
[4] Zhu, Q., Yan, J. and Deng, D. (2013) Compressive Tracking via Oversaturated Sub-Region Classifiers. IET Computer Vision, 7, 448-455.
https://doi.org/10.1049/iet-cvi.2012.0248
[5] Wang, W., Xu, Y., Wang, Y., Zhang, B. and Cao, Z. (2013) Effective Weighted Compressive Tracking. The 17th IEEE International Conference on Image and Graphics, 353-357. https://doi.org/10.1109/ICIG.2013.77
[6] Comaniciu, D., Ramesh, V. and Meer, P. (2000) Real-Time Tracking of Non-Rigid Objects Using Mean Shift. IEEE Conference on Computer Vision and Pattern Rec-ognition, 2, 142-149. https://doi.org/10.1109/CVPR.2000.854761