Assessment of Rural Road
Simulation Modelling Tools
Glen Koorey
Opus Central Laboratories
ISBN 0-478-25355-9 ISSN 1174-0574
© 2003, Transfund New Zealand
PO Box 2331, Lambton Quay, Wellington, New Zealand Telephone 64-4-473 0220; Facsimile 64-4-499 0733
Koorey, G.F. 2002. Assessment of Rural Road Simulation Modelling Tools. Transfund New Zealand Research Report No.245. 124 pp.
Glen Koorey, Opus Central Laboratories, PO Box 30-845, Lower Hutt, New Zealand. Email: Glen.Koorey@opus.co.nz.
An Important Note for the Reader
The research detailed in this report was commissioned by Transfund New Zealand.
Transfund New Zealand is a Crown entity established under the Transit New Zealand Amendment Act 1995. Its principal objective is to allocate resources to achieve a safe and efficient roading system. Each year, Transfund New Zealand invests a portion of its funds on research that contributes to this objective.
While this report is believed to be correct at the time of its preparation, Transfund New Zealand, and its employees and agents involved in the preparation and publication, cannot accept any liability for its contents or for any consequences arising from its use. People using the contents of this document should apply, and rely upon, their own skill and judgement. They should not rely on its contents in isolation from other sources of advice and information. If necessary they should seek appropriate legal or other expert advice in relation to their own circumstances.
EXECUTIVE SUMMARY ... 7
ABSTRACT ... 11
1. INTRODUCTION... 12
1.1 BACKGROUND... 12
1.2 OBJECTIVES... 13
1.2.1 Task 1: Study Scoping and Site Selection... 13
1.2.2 Task 2: Field Data Collection and Simulation ... 13
1.2.3 Task 3: Review of IHSDM and Related Safety Models... 14
1.3 REPORT OUTLINE... 14
2. STUDY SCOPING AND SITE SELECTION ... 15
2.1 DESIRABLE KEY FEATURES OF RURAL SIMULATION MODELS... 15
2.1.1 Practical Features of Simulation Models... 17
2.2 LITERATURE REVIEW OF TECHNICAL THEORY... 18
2.2.1 Road Alignment Effects ... 18
2.2.2 Vehicle Bunching and Overtaking ... 19
2.2.3 Roadside Development and Speed Limits... 20
2.2.4 Road Width Effects ... 21
2.2.5 Side Road Interaction ... 22
2.2.6 Safety Effects ... 22
2.2.7 Other Issues ... 23
2.3 POTENTIAL MODELLING PACKAGES AVAILABLE... 24
2.3.1 TRARR... 24
2.3.2 TWOPAS ... 28
2.3.3 PARAMICS... 32
2.3.4 Other Simulation Models ... 34
2.4 ASSESSMENT OF PACKAGES IN TERMS OF DESIRED FEATURES... 36
2.5 COMPARISON OF MODELS WITH FIELD DATA SURVEY INFORMATION... 38
2.6 DEVELOPMENT OF SURVEY PLAN... 40
2.6.1 Curve Speed Prediction ... 41
2.6.2 Vehicle Performance and Gradient Speed Prediction ... 42
2.6.3 Two-Lane Bunching/Overtaking... 42
2.6.4 Passing Lane and Four-Laning Operations ... 43
2.6.5 Speed Limits and Roadside Development... 43
2.6.6 Road Width Effects ... 43
2.6.7 Assessment of Delays and Conflicts from Side Road Traffic ... 44
2.6.8 Delays at Constraints (roadworks, one-lane bridges)... 44
2.6.9 Estimation of Fuel Consumption... 44
3. FIELD DATA COLLECTION AND SIMULATION... 46
3.1 SIMULATION MODEL DEVELOPMENT... 46
3.1.1 TRARR... 46
3.1.2 TWOPAS ... 47
3.1.3 PARAMICS... 49
3.2 ANALYSIS OF MODEL ATTRIBUTES... 55
3.2.1 Curve Speed Prediction ... 55
3.2.2 Vehicle Performance and Gradient Speed Prediction ... 57
3.2.3 Two-Lane Bunching/Overtaking... 59
3.2.4 Passing Lane and Four-Laning Operations ... 60
3.2.5 Speed Limits and Roadside Development... 64
3.2.9 Estimation of Fuel Consumption ... 69
3.3 COMPARISON OF PACKAGES... 69
3.3.1 Accuracy of Prediction... 70
3.3.2 Ease of Use... 70
3.4 DISCUSSION... 72
4. REVIEW OF IHSDM AND RELATED SAFETY MODELS ... 76
4.1 LITERATURE REVIEW OF SAFETY MODEL RESEARCH... 76
4.1.1 Effects of Road Geometry and Environmental Features... 77
4.1.2 Speed and Safety... 78
4.1.3 Traffic Conflicts Research ... 78
4.1.4 Relating Crash History with Crash Predictions... 80
4.2 AVAILABLE ROAD SAFETY MODELS... 81
4.2.1 Interactive Highway Safety Design Model (IHSDM)... 81
4.2.2 SafeNET... 86
4.2.3 Road Safety Risk Manager... 90
4.2.4 Other Safety Models ... 95
4.3 APPLICATIONS FOR NEW ZEALAND... 97
4.3.1 Existing Crash Reduction Evaluation in New Zealand... 97
4.3.2 Crash Type Incidence on New Zealand Rural Highways ... 98
4.4 ASSESSMENT OF ROAD SAFETY MODELS... 100
4.4.1 Potential Key Indicators of Relative Safety ... 101
4.4.2 Development of Local Road Safety Models ... 101
5. CONCLUSIONS ... 103
5.1 STUDY SCOPING AND SITE SELECTION... 103
5.2 FIELD DATA COLLECTION AND SIMULATION... 104
5.3 REVIEW OF IHSDM AND RELATED SAFETY MODELS... 105
6. RECOMMENDATIONS... 107
REFERENCES... 109
APPENDICES ... 115
A.1 SITES SURVEYED FOR FIELD DATA COLLECTION... 115
A.2 PARAMICSROAD LINK CATEGORIES... 118
A.3 PARAMICSLINK ATTRIBUTES FOR VARIOUS ROAD SECTIONS... 119
Figure 2.1 Rural Road Modelling – Suggested Framework... 16
Figure 2.2 Screenshot of TRARR 4 road editor... 25
Figure 2.3 Screenshot of TRARR 4 Outputs ... 26
Figure 2.4 Data Files used in TRARR ... 27
Figure 2.5 Screenshot from TWOPAS Front-End (UCBRURAL)... 29
Figure 2.6 Typical outputs from TWOPAS ... 30
Figure 2.7 Screenshot of beta TWOPAS Windows version ... 31
Figure 2.8 3D Screenshot from PARAMICS... 33
Figure 3.1 TWOPAS 98 Road Editor ... 48
Figure 3.2 PARAMICS road link categories ... 50
Figure 3.3 Road Alignment in PARAMICS using Automatic Road Geometry Creation... 51
Figure 3.4 PARAMICS vehicle type definition... 52
Figure 3.5 Example of PARAMICS "stalling" error... 54
Figure 3.6 Comparison of PARAMICS Link Curve Speeds with Field Surveys ... 57
Figure 3.7 Speed-Flow Field Data from SH1 near Burnham... 62
Figure 3.8 Speed-Flow Data Modelled by TRARR... 62
Figure 3.9 Speed-Flow Data Modelled by TWOPAS... 63
Figure 3.10 Speed-Flow Data Modelled by PARAMICS... 63
Figure 3.11 PARAMICS One-Lane Bridge Model... 68
Figure 4.1 IHSDM Main Program Window ... 82
Figure 4.2 IHSDM Policy Review Module... 83
Figure 4.3 IHSDM Highway Editor... 83
Figure 4.4 IHSDM Crash Prediction Module ... 84
Figure 4.5 IHSDM Design Consistency Module Results ... 86
Figure 4.6 Network Editor in SAFENET... 87
Figure 4.7 Typical Summary Accident Predictions in SAFENET... 88
Figure 4.8 Road Section Editor in SAFENET ... 88
Figure 4.9 Typical Detailed Casualty Results for Road Section in SAFENET ... 89
Figure 4.10 Intersection Editor in SAFENET... 90
Figure 4.11 Main Menu Screen for Road Safety Risk Manager... 91
Figure 4.12 RSRM General Crash Risk Factor for different road types... 92
Figure 4.13 RSRM Relative Risk Factor for different road features ... 92
Figure 4.14 RSRM Influencing Factors that affect relative risk ... 93
Figure 4.15 RSRM Relative Severity for different safety problems... 94
Figure 4.16 RSRM Overall Hazard Risk Score for safety problem... 94
Figure 4.17 RSRM Risk Cost Ratio for proposed treatment of safety problem ... 95
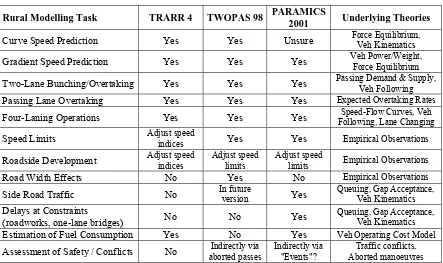
List of Tables Table 2.1 Summary of Capabilities of Selected Simulation Models ... 38
Table 2.2 Proposed Surveys for Validating Simulation Models ... 41
Table 3.1 Comparison of Curve Mean Speed Predictions... 56
Table 3.2 Comparison of Modelled Gradient Speeds at SH75 Takamatua ... 58
Table 3.3 Proportion of Vehicles Overtaking at Start of Passing Lane ... 61
Table 3.4 Mean free speeds near small urban centres ... 64
Table 3.5 Mean free speeds near rural railway crossing (xing)... 65
Table 3.6 Mean free speeds near a narrow bridge ... 66
Table 3.7 Mean travel times through an Intersection ... 67
Table 3.8 Assessment of Correctness of Selected Simulation Model Features ... 70
Table 3.9 Comparison of Selected Simulation Models for Ease of Use... 71
Table 3.10 Suitability of Selected Simulation Models for various Rural Project Types... 74
Table 4.1 Crash Type Numbers on NZ Rural State Highways 1996-2000 ... 98
Executive Summary
This research investigated the relative merits of a number of different simulation packages for modelling vehicle interactions on rural highways. A review was also made of models of rural crash risks and their application in New Zealand was considered. The main objectives of the research, carried out in 2001/02, were:
• To identify suitable software packages for rural road simulation and assess their features. • To compare the performance of different packages in assessing vehicle speed prediction,
vehicle interaction, and relative crash risks.
• To consider the potential future application of such packages in New Zealand. Survey Scoping and Site Selection
A review of local and international literature on relevant topics revealed:
• Horizontal and vertical alignments have the greatest influences on driver speed selection and therefore need to be modelled with some precision.
• Estimation of undesired vehicle-following and congestion delays is another important use of modelling, and is affected by traffic volume and composition, available passing sight distance, and traffic speed distributions.
• Predicting speed changes due to roadside development and changes in speed limits is particularly difficult, and site-specific measurements are recommended.
• Narrow road widths do not appear to have as much influence on vehicle operations as other factors, particularly for modelling on State Highways. Other features that can affect modelling of highway traffic, both in terms of delays and safety problems, include side roads, one-lane bridges, and roadworks with traffic control.
• Most simulation models developed to date have been designed specifically for evaluation of efficiency issues (e.g. travel time savings and reductions in time spent following) rather than assessment of safety benefits. Analysis of both within the same package would be preferable for project development purposes.
• At present, most detailed rural simulation in New Zealand is carried out using TRARR (ARRB Transport Research, Australia). However a number of existing concerns and limitations have been identified with this package, and no further upgrading is planned. • TWOPAS 98 (FHWA, US) is a similar tool and current ongoing development makes it
an attractive long-term proposition. However, its appropriateness and practicality for New Zealand use needs to be confirmed.
• Network micro-simulation packages like PARAMICS 2001 (SIAS, Scotland), commonly used for urban and motorway modelling, may also have the potential for rural simulation, subject to appropriate underlying driver behaviour models.
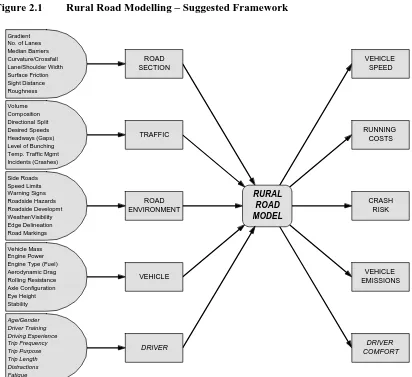
• A desirable rural road model for New Zealand project evaluation should be able to take in a range of road, environment, traffic, vehicle and driver attributes and accurately predict vehicle speeds, running costs, crash risk, emissions, and driver comfort.
• A practical model ideally requires a number of other "efficiency" features, such as an intuitive graphical interface, easy creation/editing of input data, incorporation of field data, customised outputs for project evaluation, and good documentation.
• Incorporation of road-modelling features into existing road design packages could enable built-in assessment of designs in terms of road user benefits and costs, resulting in more immediate feedback on the most optimal designs.
Field Data Collection and Simulation
Following field surveys at over 20 rural highway locations, subsequent analysis and modelling showed:
• While some project types (e.g. passing lanes) are well served by modelling tools, others are still not well supported. There may be scope for further research to develop suitable analysis tools for the industry.
• Each of the three main models investigated appears to have particular strengths over the others when considering different project applications, and therefore have a part to play in New Zealand rural modelling.
• TRARR still has a significant advantage in terms of familiarity to many New Zealand practitioners, and well-established support tools to enhance its use for project evaluation. • TWOPAS generally has modelling features at least as comprehensive as TRARR.
However at the moment it is limited when bringing in road alignment data automatically. The forthcoming update of TWOPAS offers more promise.
• PARAMICS provides considerable flexibility to model non-traditional rural simulation situations, however it is more difficult to quickly set up. The applicability of the model's underlying theory to rural New Zealand roads is also unclear.
• There are existing usability and software problems with both TWOPAS and PARAMICS that need to be addressed in future versions to make them more practical for rural highway use in New Zealand.
From these findings, an initial ranking of suitability for different project types was produced.
Review of IHSDM and Related Safety Models
A review of local and international rural crash risk modelling revealed:
• Most existing crash analysis procedures are "static" models, i.e. they predict crash numbers by combining typical crash rates for a certain facility, traffic volumes, and maybe additional site-specific modifying factors.
• Micro-simulation could be used to observe traffic "conflict" events and assess likely crash rates. The application of this approach to mid-block situations is still relatively untapped, particularly where the measured conflicts are fairly rare.
• On rural routes, road features (e.g. curvature, roadside hazards, sight distance) are more important in determining crash likelihood and severity, whereas urban drivers are usually more constrained by either speed limits or other road users.
• Research has found increasing crash risks related to increases in horizontal curvature and absolute gradient as well as reductions in available sight distance.
• Higher mean speeds, speed variances, and speed environment differences increase crash rates and severities. An accurate means of predicting vehicle speeds is therefore necessary.
• Interactive Highway Safety Design Model (FHWA, US) is a suite of tools for assessing the safety impacts of design decisions on two-lane rural highways. Its use in New Zealand, using local design standards, is a promising approach although considerable road design data is required for input.
• Some road safety models examined could provide a reasonable estimate for New Zealand of the relative change in crashes between two situations, but not absolute crash prediction, due to roading, social and legislative environment differences.
• Inclusion of actual historical crash data should greatly help adjust crash predictions for local effects that are otherwise difficult to account for, and should allow a relatively simple but effective model to be developed and used fairly quickly.
• In New Zealand, typical rural crash rates are available for broad terrain/volume categories, as well as predicted crash changes for specific treatments, curve speeds, and different cross-section attributes. However there is little specific guidance on how combined roading changes might be dealt with, or the effect on different crash types. • New Zealand's relatively well-integrated systems for collating highway and crash data
provide valuable sources of data on the effectiveness of various road safety treatments. These advantages should be maximised in both developing and using any crash models here, with detailed on-site data collection where required.
• Head-on/lost-control curve crashes curves comprise 49% of all reported rural two-lane crashes in New Zealand, followed by similar crashes on straights (21%). Less common are rear-end/obstruction (11%), intersection (9%) and overtaking (8%) crashes, although they play a much greater role on three/four-lane highways.
• Rural crash models that are more sophisticated than the existing evaluation procedures in New Zealand may be required to identify the often minor effects of changing small aspects of roading design for incremental safety improvements.
Recommendations
The following items are recommended for further investigation or action:
• Undertake further examination of the potential for incorporating safety assessment into future development of existing "travel efficiency" simulation models.
• Undertake further surveys as described in the survey plan to further validate the accuracy of the various simulation tools, particularly "before and after" surveys.
• Encourage the use of different simulation packages on rural roading projects, particularly those more suited to a certain application, to obtain the most appropriate project evaluation and to develop experience by practitioners.
• Arrange technical workshops introducing the various modelling options to practitioners, and providing guidance on how to use them for various applications.
• Continue to monitor developments in models such as TWOPAS and PARAMICS, and trial them further in New Zealand on suitable rural highway projects.
• Where possible, investigate further the suitability of other potential simulation models identified overseas such as HUTSIM, VTI, AIMSUN, and DRACULA.
• Continue to monitor the development of IHSDM and trial its use in New Zealand. Also keep track of other applicable overseas road safety models.
• Scope the required needs for road safety models in New Zealand at various levels (national/regional strategies, project option scoping, detailed project design, highway audit).
• Focus rural crash model research in New Zealand initially on curve-related crashes, with more sophisticated development of other crash types later.
• Undertake statistical analysis of the relative correlation between crash numbers and potential key indicators of safety, such as mean/percentile travel speeds, sight distances, vehicle lane positions, and overtaking/intersection manoeuvres/conflicts.
Abstract
This research investigated the relative merits of various simulation packages (in particular TRARR, TWOPAS and PARAMICS) for modelling vehicle interactions on rural highways. It assessed their suitability for use as tools for evaluating crash risk and travel efficiency, particularly in the prediction of vehicle speeds and bunching in typical highway situations. All were found to have some strengths over the others for particular project applications. A review was also made of recent or developing models of rural crash risks (including IHSDM) and their potential application in New Zealand considered. Although the underlying methodologies appear promising, most would require further adaptation for the New Zealand environment.
Acknowledgement
1. Introduction
This research investigates the relative merits of a number of different simulation packages for modelling vehicle interactions on rural highways. The research was carried out in New Zealand during 2001-02. It assessed their suitability for use as tools for evaluations of crash risk and travel efficiency. A review was also made of recent or developing models of rural crash risks, particularly those incorporating simulation techniques, and their application in New Zealand was considered.
1.1 Background
New Zealand relies largely on two-lane rural highways for its inter-regional land transport network. Many of these highways are less than optimal when considering consistency of speed environment, safety hazards, and minimisation of delays. To counter this, various ongoing improvements have been investigated and constructed, including realignments, passing-lanes, black-spot removal, and four-laning.
Previous research in New Zealand (detailed later in this report) has focused on small elements of the overall rural roading picture, such as free speeds as a function of road alignment, efficiency and safety benefits of passing opportunities, and the relationship between crashes and road geometry. There is a need to consider the overall impacts of changes to road alignments and cross-sections for both safety and efficiency in a unified manner.
To assist in prioritising funding for future upgrading work, detailed simulation modelling is required to firstly identify sections requiring improvement and secondly to determine the likely effect of improvement projects. There is currently little guidance for analysts on the most suitable simulation tools available to use, and how to use them appropriately for various projects. Although more simplified procedures are being introduced to replace some simulation work and to make things easier for both analysts and Transfund (e.g. passing lane procedures), there is still a need to validate such procedures, prior to their general usage.
A number of simulation packages are candidates for investigation. Most detailed rural simulation in New Zealand is currently carried out using TRARR (described in detail later). However, other options are beginning to look promising, such as alternative rural simulation packages (like TWOPAS) and more general micro-simulation software (like PARAMICS), and these are investigated further. The appropriateness of more simplified vehicle evaluation models, such as the 2000 HCM, are also worth investigating.
1.2 Objectives
The main objectives of this research were:
• To identify suitable software packages for rural road simulation and assess their features.
• To compare the performance of different packages in assessing project evaluation measures, such as vehicle speed prediction, vehicle interaction, and relative crash risks.
• To consider the potential future application of such packages in New Zealand. To meet these objectives, extensive literature was reviewed to identify the key performance measures of interest, and potentially suitable models available. Field survey data was then collected to provide relevant information for assessing various packages, and the results were analysed. For assessment of crash risk models, a separate search was made to identify promising evaluation tools. These are discussed in more detail below.
1.2.1 Task 1: Study Scoping and Site Selection Task 1 had the following main sub-tasks:
• Determination of desirable key features of rural simulation models, both in terms of technical accuracy and model usability.
• Background literature review of technical theory underlying the features to be modelled
• Identification of potential modelling packages available and selection of models for investigation.
• Basic assessment of the selected packages in terms of desired features (i.e. the ability of the package to allow for them)
• Identification of information needed to compare actual field data with modelled outputs
• Development of survey plan (sites, methodologies) to collect required suitable data for testing models and validating them.
The outputs from this task were fed into Task 2 where the required field data was collected and equivalent simulation models were set up for comparison.
1.2.2 Task 2: Field Data Collection and Simulation Task 2 had the following main sub-tasks:
• Undertaking field surveys to collect suitable traffic data • Collation and analysis of collected data
• Development of highway models in simulation packages to replicate surveyed sites
From this analysis, conclusions were drawn as to the applicability of each model for New Zealand conditions.
1.2.3 Task 3: Review of IHSDM and Related Safety Models Task 3 had the following main sub-tasks:
• Background literature review of safety-related models and similar research • Review and assessment of documentation and software from IHSDM programme • Assessment of other safety models identified elsewhere in the world
• Discussion of applications for safety models in New Zealand
The review considered what aspects of these models (and their underlying research) could be relevant here and what may need to be changed to make them suitable for use here.
1.3 Report Outline
Section 2 of this report summarises literature reviewed on rural highway modelling, and develops a survey plan.
Section 3 then details the results of site surveys on rural highways, data analysis, and modelling of the sites using simulation packages.
Section 4 reviews some road safety prediction models from around the world and assesses their usefulness in New Zealand.
2. Study Scoping and Site Selection
An assessment of simulation packages involves two main issues:
• The technical ability of each package to model a wide range of real-life situations with reasonable accuracy
• The functional ability of each package to enable relatively easy set-up, calibration, and production of results
Before proceeding further with our review of rural road models, these issues need to be explicitly defined. This section discusses these matters and identifies a methodology for proceeding.
Firstly the desired features for rural road simulation models were identified and background literature on these areas was reviewed. This report presents a range of possible simulation tools and describes their key attributes. The features of the proposed software tools were assessed and compared with regard to their general ability to model rural highways. Based on the desired features, a list of possible scenarios to test was finalised. To test these scenarios against actual vehicle/driver behaviour, suitable field surveys were identified for field data collection.
Having confirmed:
• which software packages would be used; • which scenarios would be investigated; and • which sites would be surveyed and modelled, a project survey plan was then developed.
2.1 Desirable Key Features of Rural Simulation Models
Figure 2.1 Rural Road Modelling – Suggested Framework
Gradient No. of Lanes Median Barriers Curvature/Crossfall Lane/Shoulder Width Surface Friction Sight Distance Roughness Vehicle Mass Engine Power Engine Type (Fuel) Aerodynamic Drag Rolling Resistance Axle Configuration Eye Height Stability ROAD SECTION VEHICLE VEHICLE EMISSIONS DRIVER COMFORT RURAL ROAD MODEL TRAFFIC Volume Composition Directional Split Desired Speeds Headways (Gaps) Level of Bunching Temp. Traffic Mgmt Incidents (Crashes) Side Roads Speed Limits Warning Signs Roadside Hazards Roadside Developmt Weather/Visibility Edge Delineation Road Markings ROAD ENVIRONMENT Age/Gender Driver Training Driving Experience Trip Frequency Trip Purpose Trip Length Distractions Fatigue VEHICLE SPEED CRASH RISK RUNNING COSTS DRIVER
The above framework provides an over-arching basis for specification of a model that provides all of the required information for project evaluation in New Zealand, using as wide a set of information as possible. The diagram does not indicate the relative importance of each input, and it may be that some inputs can be ignored without significant effect on the final results (or at least on some outputs). In practical terms, reduction of the input data (or certainly the accuracy of some of it) may be necessary to minimise the costs in obtaining the data. There is little point in an improved model if the required effort and cost of populating and calibrating it is excessive.
Some of the road and traffic factors may have influences in both the short and long term. For example, an isolated horizontal curve will affect driving speed at that site; however, a series of horizontal curves will also have an effect on the overall desired speed along a route. Similarly the presence of other traffic will affect the ability to overtake, but continuous traffic may also start to affect the gaps that drivers will accept for overtaking, if they become frustrated and take more risks.
existing models. This framework provides an initial starting point to help identify these “gaps” in knowledge.
While considering the merits of various simulation models, it is important to bear in mind the appropriateness of using such a model in the first place. The most recent version of the US Highway Capacity Manual (TRB 2000) contains some information on assessing simulation and other models. Amongst the shortcomings of simulation models listed, it includes the following.
• There may be easier ways to solve the problem.
• Simulation models require considerable input characteristics and data. • Simulation models may require verification, calibration and validation.
• Some users may apply simulation models and not understand what they represent.
• Some users may not know or appreciate model limitations or assumptions.
It may be that, with the introduction of more simplified approaches (e.g. passing lane procedures), the use of modelling will become less common in specific project work. The level of accuracy gained from a simulation model may not justify the additional effort probably required to achieve it.
Although the simplified procedures make things easier for both analysts and Transfund, there is still a need to validate such procedures using more robust analyses, prior to their general usage. Modelling is likely to be able to continue to provide that validation. Therefore the development of more sophisticated future models may be more for policy and research work rather than for general use by practitioners. The exception may be for very large construction projects, where accuracy of results is important before committing to a significant amount of funding.
2.1.1 Practical Features of Simulation Models
As well as having the underlying theory sufficiently correct, a practical model for use in New Zealand and elsewhere ideally requires a number of other features to make it efficient to use. Koorey & Gu (2001) provided a list of desirable features including:
• Adequate capacity to model very long highways and very high traffic volumes. • Ability to create or import road data using a number of formats, particularly
using either fixed-interval (e.g. 10 m) or element-based geometry data.
• Easy editing of roadway information, particularly in relation to RCA route position systems.
• Ability to specify (or import) a range of time periods and traffic flow distributions/compositions.
• Ability to derive default or typical information where field data is not available (note: this approach needs to be treated with care).
• Customisation of outputs to produce desired information in specified format. • Relating outputs to Transfund project evaluation benefits.
• Use of field data for more automatic and efficient calibration. • Text-based input/output files for external editing if desired.
• Facility to change distributions used for some values (including using constant deterministic values).
• Ability to expand data requirements where desired (e.g. more vehicle types or longer road sections).
• A modern graphical interface (e.g. MS Windows or Unix X-Windows) that uses standard features (buttons, drop-down lists, etc).
• Ability to graphically display on plan and longitudinally the analysed routes and overlay various data sets (speeds, bunching, sight distances, etc).
• Adequate documentation (both on-line help and written).
It must be emphasised that, while a model with all of these features would greatly ease the workload for the user and assist with minimising data errors, this is of little consequence if the underlying model is not sufficiently robust.
2.2 Literature Review of Technical Theory
New Zealand relies largely on two-lane rural highways for its inter-regional land transport network. Many of these highways are less than optimal when considering consistency of speed environment and minimisation of delays. To counter this, various ongoing improvements have been investigated and constructed, including realignments, passing-lanes, black-spot removal, and four-laning. All of these projects require justification via analysis of the expected benefits, generally in terms of travel times, vehicle operating costs, crash savings, and reduced driver frustration (determined by willingness-to-pay).
The following discussion reviews some of the main factors that can affect the evaluation of a highway project, as previously published.
2.2.1 Road Alignment Effects
and Bennett recommended that work be done to incorporate his model into a vehicle interaction model.
Horizontal curve free speed is primarily dictated by the actual curvature, with superelevation and sideways friction coefficient at the site less crucial to driver speed selection. Bennett found that approach speed also had a significant effect on curve speeds, and this relates back to the surrounding speed environment. As a result he favoured a linear regression model for curve speed prediction that could incorporate this, rather than the traditional mechanistic model used for design speed determination (Austroads 1989). Sight distances through the curve may also have a minor effect and it is not clear whether on-site curve warning or advisory speed signage have a significant effect (Koorey et al 2001).
Free speeds on gradients are largely controlled by the mechanical performance parameters of each particular vehicle. Upgrade speeds are limited by the maximum power-to-weight ratio (PWR) that a vehicle can use to counteract the gravitational force (with aerodynamic and rolling resistance forces generally being of much lesser magnitude). This is generally not a significant problem for modern passenger cars until the gradient is fairly steep (>4%). Long, steep downgrades can also affect speeds of heavy vehicles in particular, which have to ensure that sufficient braking power is available to them. Bennett (1994) however identified that the vertical alignment following a downgrade can also affect driver behaviour, with drivers perhaps less likely to brake in advance of another upgrade. Because trucks have a very wide range of performances, their impact on traffic along grades can vary enormously. Therefore it is important to get a very accurate representation of the heavy commercial vehicle (HCV) population when modelling.
Bennett used a form of "probabilistic limiting velocity model" (PLVM) to develop his free speed prediction model. This system, used as the basis of the World Bank's Highway Development & Management (HDM) Model (Kerali 2000), involves determining a vehicle's constrained speed from the minimum of speeds limited individually by curvature, grades, roughness, etc. This allows a more realistic interaction between the various factors that can influence driver speed selection. It is important to recognise however that this approach is only relevant for "free" speeds; traffic interaction is not accounted for.
2.2.2 Vehicle Bunching and Overtaking
Passing facilities can help to break up platoons1 and reduce instances of following behind slower vehicles. Generally the "effective length" of such a facility, i.e. the length over which it improves traffic flow, extends some distance downstream of the facility itself, sometimes over 10 km further. This length is also dictated by the previously mentioned factors of traffic, sight distance, and speeds, as they determine the likelihood of faster vehicles catching up with slower vehicles again.
McLean (1989) provides a very comprehensive summary of research and methods used for analysing traffic operations on two-lane highways. In terms of overtaking, a key factor is the identification of typical gaps accepted in the opposing traffic stream or clear sight distances accepted. This will vary depending on the accelerative performance of each vehicle, the length of the vehicle to be overtaken, the surrounding road environment (including road width), and whether the vehicle is already travelling at a higher speed than the overtaken vehicle (a "flying" acceleration). Even after accounting for these, a wide variation of accepted gaps exists among drivers and a log-normal distribution is often used to represent the probability of drivers accepting particular gaps. This driver mix may also vary for different roads, with older drivers and tourists, for example, often being less aggressive.
A concept difficult to reconcile when observing vehicles in the field is that of "happy following", i.e. drivers who do not wish to overtake vehicles travelling only slightly slower than their desired speed. Most models examined tend to allow for this behaviour, but it does have to be factored in when relating bunching levels in the field to theoretical models of passing demand.
2.2.3 Roadside Development and Speed Limits
Although this project is primarily concerned with rural highway environments, many such routes in New Zealand also have a number of smaller urban localities (sometimes called "semi-rural") and other roadside developments such as "lifestyle blocks", produce stalls and tourist attractions. Often it is not practical to model around these, so they need to be incorporated somehow into any assessment of rural routes. This is particularly important when proposals involve further development of a rural area and the relevant road controlling authority wants to determine the likely operational effects on an adjacent arterial route.
Many small towns have speed limits below 100 km/h, ranging between 50 and 80 km/h depending on the location. Although driver speeds are generally affected by these limits, they are more likely to be dictated by the drivers’ perception of the level of development and constriction. It is not entirely clear how much influence a posted speed sign has on the desired speeds. Most studies have focused on changes to the open road speed rather than site-specific local changes (Barnes & Edgar 1987, NHTSA 1989). While this is important should further changes in open road speed policy be considered here, it is not an effect likely to be of significance for typical project evaluations.
speed limits were increased (e.g. from 50 to 60 km/h) and that they fell ~1-2 km/h per 10 km/h reduction in posted speed. However mean speeds at control sites fell ~1-2 km/h over the same period, suggesting that speed limit increases counteracted this local trend. It is not entirely clear why the control sites had reduced mean speeds (e.g. the stated level of enforcement did not change), although the better consistency of speed limits may have improved driver behaviour in general. 85th percentile speeds followed similar trends, and standard deviations of speed distributions generally reduced. McLean (1989) reported similar findings, with speed limits having a greater effect on high percentile speeds and hence reducing the coefficient of variation.
Away from speed-restricted areas, other developments may also have a limiting effect on vehicle speeds. This may be a function of the density of accesses in the area, the scale of the development visually, or perhaps the level of vehicles parked alongside the road. Although some effects on speeds by these factors have been found in studies (e.g. Fildes & Lee 1993), the unique nature of some developments may mean that only on-site surveys can identify the true effect on vehicle speeds.
2.2.4 Road Width Effects
Narrow road widths have potentially two important effects in terms of traffic operations on rural roads. Firstly, they may cause a reduction in mean speeds and subsequent travel time losses (slightly balanced by reduced vehicle operating costs). Secondly, they may produce a reduction in the likelihood of overtaking, especially overtaking large wide vehicles, again with travel time losses. It is important that the modelling process captures these effects.
There is no clear consensus from past research on the effects of road widths on these outcomes. Bennett (1994) summarised ten studies that suggested increases in car speeds of between 0.7-8.1 km/h (average increase 4.7 km/h) per metre of sealed road. However, whereas some researchers applied a width effect across a wide range of road widths, many only found a pronounced effect on very narrow pavements (e.g. <5m). Other researchers have not been able to find a significant width effect at all.
Standard capacity/speed analysis methods such as the US Highway Capacity Manual (TRB 2000) impose substantial penalties on roads with less than the "ideal" 3.7 m lanes and 1.8 m shoulders. However McLean (1989) found no empirical evidence for these reductions, particularly for minor reductions (e.g. 3.4 m lanes). Based on a review of available literature, he suggested that only when lane widths fell below ~3m is it reasonable to suppose that opposing vehicle interference begins to affect free speeds.
Troutbeck (1984) collected overtaking rate data on two similar highways of 7.4 m and 6.0 m widths respectively. He found that the narrower road produced slightly longer mean overtaking times and a much-reduced acceptance of smaller (<20 s) overtaking gaps. Questions remain however whether these differences are entirely due to the road width or also reflect the different functions of each road.
accordingly, with up to 6.7 km/h reduction for negligible shoulders compared with 1.8m shoulders. However the data collected on narrow lanes did not show consistent results, and so no conclusion was reached.
A key problem stated in the reviewed research has been in trying to compare "apples with apples". Surveying different width roads introduces additional effects such as local alignment, speed environment and traffic composition. For example, a wider road probably has a better likelihood of also being designed and maintained to a better standard. A more ideal research approach would be to survey some locations before and after seal widening.
Compared with the effects of other features, such as horizontal alignment and vertical grade, road width certainly does not appear to have as much influence on vehicle operations. On very narrow roads, however, the influence is much greater. For example most State Highways, with 3.5m lanes, would probably not be greatly affected, even with no shoulder present. It is important to remember however that the effect on wider trucks will be different from that on typical passenger cars. Isolated constraints such as narrow bridges may also inhibit overtaking or speeding.
2.2.5 Side Road Interaction
In many locations around New Zealand, side roads present an additional challenge for rural highway users. Conflicts may occur between through traffic and vehicles trying to enter or leave the side roads. These can cause both delays and safety problems. An adequate model needs to identify the expected effects of these on traffic operation.
Previous work has tried to relate observed traffic flows, speed distributions, manoeuvre times and accepted gaps in traffic with predicted traffic conflicts. This can then be used as a proxy for estimating the likelihood and severity of crashes at different sites. McDowell et al (1983) developed a simulation model to take the above field data and estimate various conflict types, and found a good correlation between these and the true crash histories at ten urban sites.
Data on gap acceptance is an important element of modelling rural side roads. Parsonson et al (1996) studied New Zealand drivers approaching rural intersections and found that drivers tended to judge safe gaps according to distance rather than by time, with fairly consistent minimum gaps of 150-200 m. As a consequence, they allowed shorter time gaps for vehicles approaching at higher speeds, a finding with important safety implications.
2.2.6 Safety Effects
How simulation models might assess safety is unclear. Most existing crash analysis procedures are "static" models, i.e. they simply predict crash numbers by combining typical crash rates for a certain facility, traffic volumes, and maybe additional site-specific modifying factors. In theory, using micro-simulation to model driver/vehicle behaviour, situations that put road users at more risk than others could be identified. There are however a number of methodological issues associated with this concept, which are discussed in more detail in Section 4 (Task 3).
Simulation models are generally best at predicting vehicle speeds, so evaluating safety issues related to speed seems a promising approach, e.g. the consistency of vehicle speed profiles in relation to the surrounding speed environments. A typical problem is a low-speed curve out of character with the surrounding high-speed alignment. This has been shown to have significant effects on the overall safety of a rural route (Koorey & Tate 1997). Currently research in the US is developing an Interactive Highway Safety Design Model (IHSDM) that will, among other things, address consistency of vehicle speeds along a route (FHWA 2001). This is also investigated further in Section 4 (Task 3).
2.2.7 Other Issues
Rural highways may also be subject to isolated constraints on capacity, for example one-lane bridges and roadworks with traffic control. It should be feasible to model these effects with reasonable accuracy. For example, Saunders (1988) used a SIMSCRIPT simulation to produce delay tables for one-lane bridges of varying lengths, traffic volumes, and cruise speeds.
Tate & Major (1993) derived similar theoretical measures to replicate observed delays during resealing operations. They identified effects due to temporary speed limits, the nature of the road surfacing, adjacent roadwork activity, and enforcement. Delays due to traffic control (such as STOP-GO controllers) could be modelled in a similar way to intersections, with queuing and capacity measures able to be derived.
There is some evidence that New Zealand drivers are more aggressive in some aspects than overseas drivers (Hughes 1998, Dunn & Tan 1992). This will need to be taken into account when calibrating driver performance parameters of overseas simulation models.
Another useful output of modelling is an accurate assessment of vehicle running costs. Fuel consumption models are available in some complexity these days (e.g. Biggs 1988), so incorporation of this facility is becoming more commonplace.
2.3 Potential Modelling Packages Available
A literature search was made of potentially suitable simulation modelling packages. One recent useful source of relevant information was the SMARTEST project in Europe (ITS Leeds, 2000), the objective of which was to review existing micro-simulation models and identify gaps in situations modelled. The project however was very much focused on urban and freeway applications and interestingly did not identify two-lane rural simulation as a significant gap.
Based on the findings of the literature review we identified the following models as being worthy of comparison for evaluating rural highways in terms of efficiency and safety:
• TRARR 4 software (ARRB Transport Research Ltd, Australia) • TWOPAS 98 software (FHWA, US)
• PARAMICS 2001 software (SIAS Ltd, Scotland)
As well as a general assessment of each model, field data would also be collected for calibrating and validating the models against real-life situations. Simplified theoretical models (either existing or to be developed, perhaps using generic simulation software, e.g. Simulink, SimScript) would also be considered as alternatives where feasible.
The three specified software packages were selected due to a combination of appropriateness and availability. Their attributes are discussed in more detail below. A number of similar models were also identified and are discussed in Section 2.3.4. However, difficulties in obtaining access to these models, coupled with the limited resources of this project, precluded further investigation for now. We suggest that some of these be revisited in more detail at a later stage.
2.3.1 TRARR
At present, most detailed rural simulation in New Zealand is carried out using ARRB Transport Research’s TRARR software (Shepherd 1994), a microscopic simulation package. TRARR ("TRAffic on Rural Roads") was originally developed in the late
1970s and 1980s by the Australian Road Research Board. Originally run on mainframe computer systems, the program was ported to a PC version (3.0) in 1986. The most recent version (4.0) was produced in 1994 and included a (DOS) graphical interface (albeit with reduced functionality) and the ability to import road geometry data for the creation of road sections.
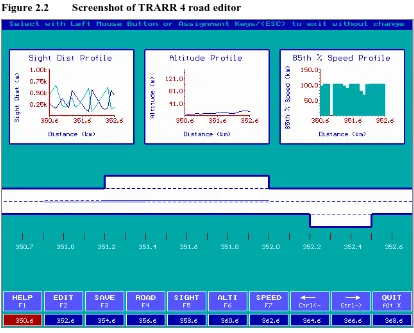
Figure 2.2 Screenshot of TRARR 4 road editor
TRARR is a micro-simulation model; i.e. it models each vehicle individually. Each vehicle is randomly generated, placed at one end of the road and monitored as it travels to the other end. Various driver behaviour and vehicle performance factors determine how the vehicle reacts to changes in alignment and other traffic. Because of this, it is important that these factors are appropriately set.
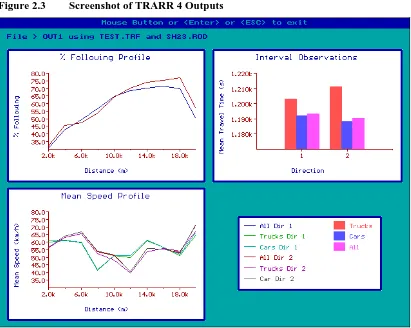
Figure 2.3 Screenshot of TRARR 4 Outputs
TRARR is designed for two-lane rural highways, with occasional passing lane or four lane sections (slow vehicle bays can also be modelled). As a result, it is ideal for modelling most of New Zealand’s rural State Highway network. TRARR can be used to obtain a more precise calculation of travel time, frustration (via time spent following), and VOC benefits resulting from passing lanes or road realignments. For strategic assessment of road links, TRARR can also be used to evaluate the relative benefits of passing lanes at various spacings.
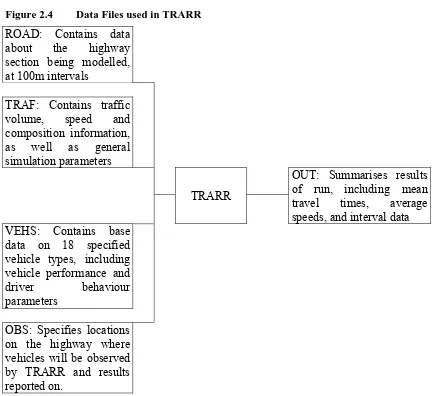
Figure 2.4 Data Files used in TRARR
ROAD: Contains data about the highway section being modelled, at 100m intervals
TRAF: Contains traffic volume, speed and composition information, as well as general simulation parameters
TRARR
OUT: Summarises results of run, including mean travel times, average speeds, and interval data
VEHS: Contains base data on 18 specified vehicle types, including vehicle performance and
driver behaviour parameters
OBS: Specifies locations on the highway where vehicles will be observed by TRARR and results reported on.
TRARR is largely based on deterministic modelling, i.e. it uses fixed parameters for various inputs (e.g. vehicle power, overtaking behaviours, etc). Desired speeds for each vehicle however are randomly generated using a specified distribution (usually a normal distribution). More use of probabilistic or stochastic modelling (whereby parameters can take on a number of random values within a distribution) may improve the reality of the outputs, although it is not clear whether this additional complexity would produce significant benefits.
As a modelling tool for evaluation of rural passing lanes and realignments, TRARR has proved to be an adequate package. In particular, the ability to import RGDAS (road geometry) data from our State Highway network has been particularly effective. However a number of potential drawbacks have been identified through practical experience, limiting TRARR’s use for rural simulation work in New Zealand. Koorey & Gu (2001) identified a number of concerns with TRARR. More detail is provided in their report but, in summary, these included:
• Inability to handle varying traffic flows down the highway, particularly due to major side roads; and the effect of side road interaction on main road delays. • Inability to properly model the effects of restricted speed zones (such as small
• Ineffectiveness in modelling congested situations such as passing lane merges in peak holiday flows, and delays at temporary lane closures or single-lane bridges. • Difficulty in using field data for calibration, with little guidance available and no
automatic calibration assistance built into the program.
• Difficulties creating and editing road data, particularly for planned new alignments and in using recent State Highway RAMM2 road geometry data, and in relating files to SH route positions.
• Limited ability to use the same tool to check for speed environment consistency and safety risks associated with various alignments (i.e. models traffic "efficiency" only).
• Additional effort required in applying speed, bunching and travel time results to Transfund project evaluations.
• Lack of practical documentation for running typical TRARR applications in New Zealand, including information on suitable field data, model calibration, appropriate parameters, and how to apply the results to derive project benefits. • Lack of a modern interface (being a DOS-based program), with features and
DOS command issues unfamiliar to many Windows-trained users.
ARRB have stated that they are not planning further development of TRARR, therefore the desired improvements will not be seen in future upgrades. What has perpetuated the use of TRARR to date has been the lack of feasible alternatives in New Zealand. There is thus an incentive to identify or develop an alternative rural simulation tool for use in New Zealand with the desired improvements.
For this project, the researcher had TRARR-4 available, as well as manuals from this and earlier versions, and in-house documentation and software tools developed to assist Opus users of the package (Koorey 2000). This software has been widely used in the past for highway design projects and strategic research, so the author is very familiar with it.
2.3.2 TWOPAS
The US software package TWOPAS (St John & Harwood 1986) is an alternative tool that appears very much worth investigating. Like TRARR, TWOPAS ("TWO-lane PASsing") is a microscopic simulation model of traffic on two-lane rural highways
first developed in the mid-1970s by MidWest Research Institute and others (St John & Kobett 1978) for the Federal Highways Administration (FHWA). The operational analysis procedures for two-lane highways in the 1985 Highway Capacity Manual (HCM) are based on an early version of the TWOPAS model.
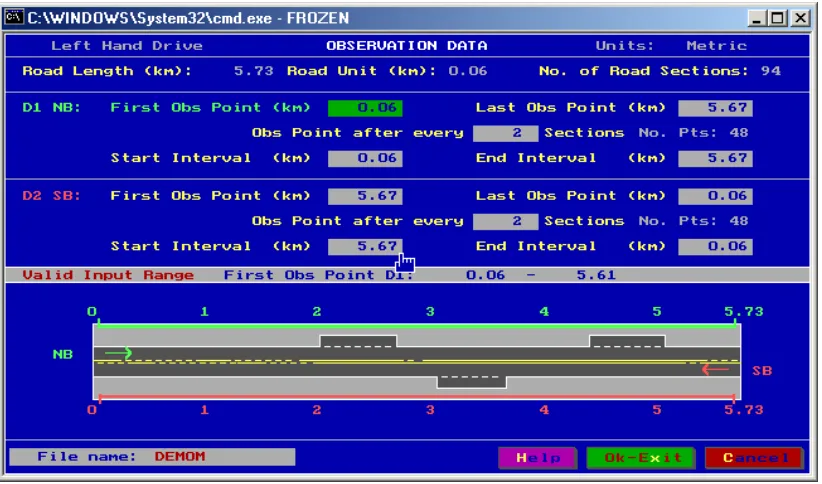
TWOPAS was revised most recently in 1998 (Leiman et al 1998) to serve as the basis for updating the HCM analysis procedures in the 2000 version of the manual (TRB 2000). This work included a (DOS-based) graphical interface UCBRURAL, developed by the University of Berkeley, California. Figure 2.5 shows a typical screen (selection of observation points) when running the "front-end" interface.
Figure 2.5 Screenshot from TWOPAS Front-End (UCBRURAL)
TWOPAS simulates the operation of each individual vehicle on the roadway. The operation of each vehicle as it advances along the road is influenced by the characteristics of the vehicle and its driver, by the geometrics of the roadway, and by the surrounding traffic situation. The simulation contains a comprehensive overtaking sub-model allowing for both sight distance and opposing-vehicle-restricted opportunities, and for single and multiple overtakings. The following features are found in TWOPAS:
• Three general vehicle categories - passenger cars, recreational vehicles, and trucks, placed in 13 sub-types.
• Roadway geometrics are specified by the user as elements in input data, including horizontal curves, grades, vertical curves, and auxiliary lanes.
• Traffic controls are specified by the user, particularly passing and no-passing zones marked on the roadway.
• Traffic streams enter at each end of the simulated roadway generated in response to user-specified flow rate, traffic mix, and percentage of traffic platooned.
• Variations in driver performance and preferences are based on field data.
• Driver speed choices in unimpeded traffic are based on user-specified distribution of driver desired speeds.
• Driver speed choices in impeded traffic are based on a car-following model that simulates driver preferences for following distances (headways), based on relative leader/follower speeds, driver desired speeds, and desire to pass the leader.
• Driver decision concerning behaviour in passing/climbing/four-lane sections, including lane choice at the beginning of an added lane, lane changing/passing within added lanes and at lane drops, are based on field data.
• Processing of traffic and updating of vehicle speeds, accelerations, and position is done at intervals of one second of simulated time.
TWOPAS has been updated to incorporate changes in driver and vehicle characteristics and to allow users to adjust for the effect on traffic operations of narrow lanes or shoulders and limited speed zones. Another major enhancement in the latest version is the capability to automatically generate available sight distance based on user specified offsets to sight obstructions.
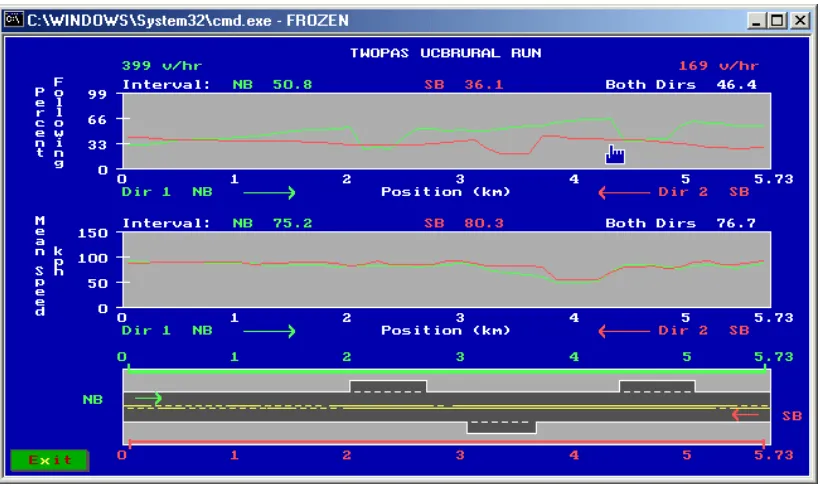
[image:30.595.87.497.391.634.2]TWOPAS uses just one input file to specify road and traffic parameters, and another file to hold default values such as vehicle performances. The simulation produces a very detailed output file, although an accompanying program, TWOSUM, is also available to produce more succinct and useable summary reports. The results can then be viewed within UCBRURAL; Figure 2.6 shows an example of this. Although all of these files are text files, the standard TWOPAS input file has few prompts to describe the data contained, making it difficult to edit manually without additional documentation.
Figure 2.6 Typical outputs from TWOPAS
In the past some comparisons of the capabilities and features of the TRARR and TWOPAS models have been undertaken with mixed results (Botha et al 1993, Staba
While TWOPAS appears to be a promising alternative to TRARR, work is needed to confirm its validity and practicality for use here. Some issues, like its lack of direct compatibility with RGDAS road geometry data, need to be considered and solutions identified. Although the UCBRURAL front-end enables data entry in metric units, the underlying program still uses Imperial units, which could also cause problems if dealing with TWOPAS directly.
For this project, the researcher had a copy of TWOPAS-98 available for evaluation. Unfortunately the original manuals (St John & Harwood 1986), which contain much detail of the underlying model parameters, have proved difficult to obtain, leaving only the basic documentation provided with this version. Some correspondence with the US developers has also been undertaken.
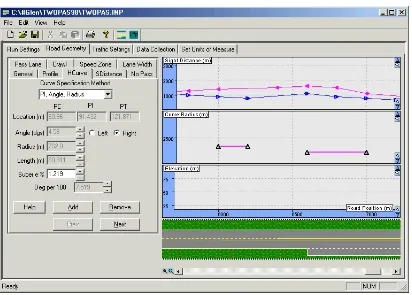
[image:31.595.101.513.442.737.2]Some further work is now continuing to improve TWOPAS even further, as part of the FHWA Interactive Highway Safety Design Model (IHSDM) programme (FHWA 2001). Improvements planned include allowance for vehicles turning on or off side roads, and a Windows interface. This ongoing development of TWOPAS makes it an attractive proposition to consider when compared with TRARR. An updated Windows version of TWOPAS became available for testing in late 2002 (after the completion of this study) and Figure 2.7 shows a screenshot from an earlier beta version obtained. At the time of review, the newer version did not appear to be sufficiently stable to test fully, nor did it add significant functionality to earlier versions. Therefore the earlier TWOPAS-98 has been used for evaluation in this project.
2.3.3 PARAMICS
Much of the development of traffic models in recent times has focused on (often complex) urban and motorway networks. In the past, computing power has limited the ability to model these networks in great detail, resulting in "macro-simulation" packages that rely largely on speed-flow curves to determine link flows and efficiencies, e.g. SATURN by WS Atkins (UK). Now a number of software tools have been developed to take advantage of micro-simulation techniques and one such tool is PARAMICS, produced by SIAS Ltd (Scotland).
PARAMICS simulates the individual components of traffic flow and congestion, and presents its output as a real-time visual display for traffic management and road network design. PARAMICS micro-simulation is concerned with modelling individual vehicles for the duration of their journey through a network, with the route that a driver chooses not being predetermined, but depending on the network situation being encountered. The conditions in the model vary with time and drivers adapt their behaviour (e.g. route choice) in response to this. Thus a PARAMICS model is not a traditional network equilibrium model, but a dynamic model.
PARAMICS has been developed over more than ten years by UK traffic and transportation engineers. The name PARAMICS ("PARallel MICroSimulation") is a
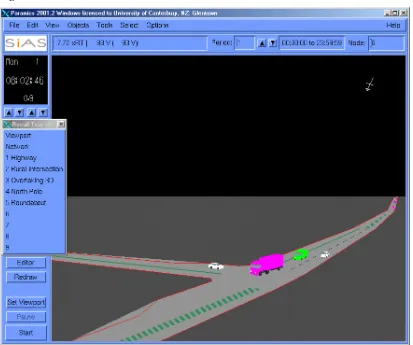
Figure 2.8 3D Screenshot from PARAMICS
Three interacting models applied at the same time govern the movement of individual vehicles in a PARAMICS model; car following, gap acceptance and lane changing. In addition, drivers have certain behavioural characteristics randomly assigned to them – aggression and awareness. These factors represent the characteristics of drivers that result in their different performances with regard to gap acceptance, car following and lane changing. Top speed, headway and lane usage are also influenced by these factors. Some simple vehicle dynamics are also taken into account, such as size, weight (e.g. for tonnage restrictions), acceleration and deceleration.
The road network is coded into the software in considerable detail and the success of the modelling depends somewhat on the accuracy of the road layout description. Unlike macroscopic network models, neither travel times nor intersection capacities are entered into the model. The input data includes details of nodes, links and a large number of other details describing the network, such as number of lanes, parking or bus lanes, bus stop positions, traffic signal data, movement definitions and priorities at intersections etc. An important factor is how well the network is segmented into links, as PARAMICS "looks ahead" only two links when determining the next action of each vehicle.
model's accuracy, major problems can be quickly identified using the maxim "if it looks wrong, it probably is wrong". This approach should help to minimise "coding errors", as opposed to the traditional analysis by abstract accumulation of numerical data and related plots. The visual display also enhances the perceived validity of such models with both transport professionals and lay people alike.
Although primarily aimed at urban networks and inter-urban motorways (where congestion effects tend to dictate vehicle speeds), it appears possible to apply PARAMICS or a similar model to a typical New Zealand rural highway, where geometric constraints may dictate. Some gradient and curve information can be entered and additional lanes and speed limits can also be specified. Laird and Nicholson (2000) developed the first urban PARAMICS model for New Zealand and were able to show that this micro-simulation software can be used to simulate New Zealand urban road conditions and driver behaviour accurately. Given the increasing use of these models in New Zealand for other applications, the relative merits of also applying them to rural highways are worth exploring.
A key difference from modelling many urban networks is that rural studies are generally linear in nature, e.g. along a State Highway. This limits the application of the route choice component of PARAMICS to network reliability studies and the like. However, the ability to add side roads along the route and additional traffic at small towns provides a useful addition to the existing rural modelling capability.
For this project, the author was based at Canterbury University, which currently holds appropriate licences for the PARAMICS 2001 package (Release 2), as well as all relevant documentation. The author has also maintained contact with PARAMICS experts both locally and at SIAS.
2.3.4 Other Simulation Models
Both TRARR and TWOPAS are specifically designed for modelling rural highway links, and there is little else in the world currently developed for this application. HUTSIM from Finland’s VTT is one other recent example, but the author has been unable to obtain sufficient information on this package; it also appears that the latest focus has been on urban modelling.
A parallel development in rural highway modelling has been the World Bank's Highway Development & Management (HDM) research (Kerali 2000). This model has been used for over two decades in many countries to combine technical and economic appraisals of road projects, to prepare road investment programmes and to analyse road network strategies. Although primarily concerned with optimisation of road maintenance investment, HDM also allows the analyst to consider the expected benefits of new construction, e.g. realignments, bypasses or road widening.
Following an intensive research programme to improve the underlying technical relationships, the most recent version (HDM-4) was released in 2000. Amongst its improvements were additional capabilities for modelling traffic congestion, safety, road works and environmental effects. An extensive range of motorised and non-motorised vehicles can be used, with a detailed speed prediction model to determine travel time and vehicle operating costs. Note that HDM-4 is not a micro-simulation tool; it merely models effects over the long term by calculating road user costs year by year.
While in theory the HDM-4 model can be used to assess the merits of a new roading improvement, in practice it is more suited to strategic-level analysis. Typical HDM road network data is usually very coarse in nature and only records aggregate information on geometric attributes for each section. For safety analysis, the crash rate models currently incorporated are very primitive, similar to the simple terrain-based crash rates used in Transfund New Zealand’s Project Evaluation Manual
(Transfund 2001). While both of these issues can be addressed by providing project-specific data, the end result is still likely to be rather simplistic. For example, the effect of a passing lane on congestion would be determined by simple speed-volume relationships and these are normally calibrated locally anyway.
Apart from PARAMICS, a number of similar network micro-simulation packages have also been developed in recent years, such as AIMSUN (TSS, Spain), VISSIM (PTV, Germany), and DRACULA (ITS Leeds and WS Atkins, UK). AIMSUN has been used by Transit New Zealand for modelling the Auckland Motorway network (Hughes 1998). These packages could possibly also be tested in the future for their applicability to rural modelling, subject to their availability in New Zealand.
It may be that the level of detail involved in the above simulation models provides little additional information than what could be provided from a simpler form of model (although given the work that has gone into simulation models, that is unlikely). Generic simulation packages, such as SimScript and GPSS/H for example, could be used to develop a simplified vehicle interaction model that provides a sufficiently adequate level of accuracy. Alternatively, an even simpler calculation approach may be appropriate, such as the recent improvements to two-lane highway evaluation in the US Highway Capacity Manual (TRB 2000).
benefits and costs to also be built in, enabling more immediate feedback on the most optimal designs.
2.4 Assessment of Packages in Terms of Desired Features
It is pertinent first to consider the chosen models in terms of the framework given in Section 2.1. A cursory comparison of the models shows that all three fail to provide every one of the listed outputs, or take account of all of the listed inputs.
For example, currently TRARR can only produce outputs on vehicle speed (and hence travel times), running costs and vehicle emissions via petrol/diesel consumption, although arguably its overtaking rate outputs can also provide some guidance on safety and driver comfort issues. In terms of inputs, TRARR takes no account of driver factors (other than assuming a typical driver for each vehicle type) or road environment features, but road, traffic and vehicle data can be specified in a fairly detailed manner.
TWOPAS is very similar, with PARAMICS even less detailed when it comes to relevant inputs.
In terms of improvements needed for the models in general, road environment features are key inputs that appear to be missing in our current analyses. The driver input category is not likely to be a direct input into a practical model for users. Rather, a representative series of behaviours is likely to be inferred based on observed actions on the road.
In terms of outputs, the lack of safety performance measures is a key omission, although work in this area is now beginning to appear (as will be discussed in Section 4). Driver comfort measures are an evolving area of project evaluation that may not have sufficient research and understanding to be able to implement at this stage.
In assessing technical models, it is useful to be able to see how the underlying routines work in some detail. This helps the user have some faith in the robustness and logic of the model, rather than treating it as a "black box" for entering data and obtaining results. Where this background information is not available, then the user must resort to testing known real-life situations and seeing how well the model reproduces them. A combination of these approaches was used to assess the models available for this project.
Both TRARR and TWOPAS have relatively good detail available on the underlying program logic and algorithms used (Hoban et al 1991, St John & Harwood 1986). Updates to the models have also been well recorded in technical literature (e.g. Leiman et al 1998, McLean 1991). This is largely a function of their public domain origins, having been used extensively by the Australian and US governments for national highway research.
helps users to assess whether the model seems realistic, over a large number of vehicles it may be relatively minor differences in speed or timing that make a significant difference to the perceived effectiveness of a project. There is also a concern that PARAMICS may be less applicable to situations it was not originally conceived for, such as rural highway modelling in New Zealand (as opposed to urban and motorway networks in UK). Without more information on how it deals with various situations, this can only be tested through field studies.
The previously suggested modelling framework and discussion of key features identified a number of features of rural road sections (in terms of inputs or outputs) that would be desirable for the proposed software tools to model. These include: • Free speed prediction, especially on grades and curves
• Vehicle interaction, bunching and overtaking
• The effects of additional lanes (e.g. passing lanes, four-laning, slow vehicle bays) • The effects of speed limits and roadside developments
• Side road interaction with main road traffic
• The effect of constraints such as narrow roads, one-lane bridges, roadworks, etc • Prediction of vehicle running costs
• The ability to assess conflicts between vehicles and to predict relative safety. The practical aspects of modelling rural highways, as discussed in section 2.1.1, also need to be considered while testing the above scenarios.